1991 Wexford County Council election
An election to Wexford County Council took place on 27 June 1991 as part of that year's Irish local elections. 21 councillors were elected from four electoral divisions by PR-STV voting for a five-year term of office.
| |||||||||||||||||||||||||||||||||
All 21 seats to Wexford County Council | |||||||||||||||||||||||||||||||||
|---|---|---|---|---|---|---|---|---|---|---|---|---|---|---|---|---|---|---|---|---|---|---|---|---|---|---|---|---|---|---|---|---|---|
| |||||||||||||||||||||||||||||||||
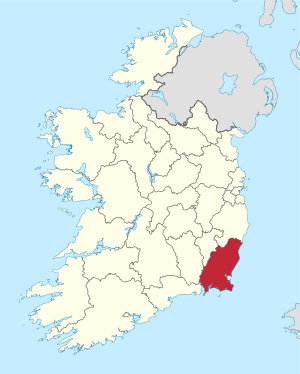 Map showing the area of Wexford County Council | |||||||||||||||||||||||||||||||||
| |||||||||||||||||||||||||||||||||
Results by party
| Party | Seats | ± | First Pref. votes | FPv% | ±% | |
|---|---|---|---|---|---|---|
| Fianna Fáil | 8 | -3 | 17,080 | 40.25% | ||
| Fine Gael | 8 | +2 | 12,806 | 30.18% | ||
| Labour Party | 1 | - | 5,331 | 12.56% | ||
| Independent | 4 | +1 | 5,243 | 12.36% | ||
| Totals | 21 | - | 42,436 | 100% | — | |
Results by Electoral Area
Enniscorthy
| Enniscorthy - 5 seats | |||||||||||
|---|---|---|---|---|---|---|---|---|---|---|---|
| Party | Candidate | FPv% | Count 1 | Count 2 | Count 3 | Count 4 | Count 5 | Count 6 | Count 7 | ||
| Fianna Fáil | John BrowneTD* | 21.6% | 2,167 | ||||||||
| Fine Gael | Ivan YatesTD* | 17.3% | 1,740 | ||||||||
| Fianna Fáil | Michael Sinnott* | 14.6% | 1,470 | 1,602 | 1,606 | 1,704 | |||||
| Independent | Seán Doyle* | 10.7% | 1,075 | 1,201 | 1,213 | 1,298 | 1,302 | 1,517 | 1,559 | ||
| Fine Gael | Jack Bolger* | 10.7% | 1,000 | 1,020 | 1,044 | 1,102 | 1,104 | 1,166 | 1,816 | ||
| Fine Gael | John Walsh | 8.6% | 861 | 866 | 881 | 934 | 941 | 1,010 | |||
| Fianna Fáil | Henry Hipwell | 8.4% | 845 | 996 | 998 | 1,035 | 1,051 | 1,080 | 1,140 | ||
| Labour Party | Franicis O'Connor | 4.5% | 454 | 485 | 490 | 537 | 537 | ||||
| Independent | Pat Murphy | 4.3% | 432 | 459 | 462 | ||||||
| Electorate: 17,954 Valid: 10,044 (55.94%) Spoilt: 228 Quota: 1,675 Turnout: 10,182 (56.71%) | |||||||||||
Gorey
| Gorey - 5 seats | ||||||||||
|---|---|---|---|---|---|---|---|---|---|---|
| Party | Candidate | FPv% | Count 1 | Count 2 | Count 3 | Count 4 | Count 5 | Count 6 | ||
| Fine Gael | Michael D'ArcyTD* | 24.4% | 2,469 | |||||||
| Fianna Fáil | Lorcan Allen* | 13.9% | 1,406 | 1,503 | 1,620 | 1,733 | ||||
| Fianna Fáil | Rory Murphy* | 12.8% | 1,297 | 1,319 | 1,345 | 1,457 | 1,461 | 1,471 | ||
| Fianna Fáil | Joe Murphy | 12.2% | 1,230 | 1,260 | 1,310 | 1,416 | 1,424 | 1,442 | ||
| Fine Gael | Jim Gahan | 10.8% | 1,092 | 1,276 | 1,316 | 1,618 | 1,668 | 1,688 | ||
| Fine Gael | Deirdre Bolger* | 10.2% | 1,029 | 1,383 | 1,504 | 1,747 | ||||
| Labour Party | Paddy Murray | 8.6% | 870 | 903 | 1,279 | |||||
| Labour Party | Bobby Ireton | 7.1% | 714 | 778 | ||||||
| Electorate: 16,825 Valid: 10,107 (60.07%) Spoilt: 148 Quota: 1,685 Turnout: 10,255 (60.95%) | ||||||||||
New Ross
| New Ross - 5 seats | |||||||||||
|---|---|---|---|---|---|---|---|---|---|---|---|
| Party | Candidate | FPv% | Count 1 | Count 2 | Count 3 | Count 4 | Count 5 | Count 6 | Count 7 | ||
| Fianna Fáil | Senator Hugh Byrne* | 21.8% | 2,200 | 1,307 | 1,355 | 1,431 | 1,442 | 1,877 | |||
| Fianna Fáil | Jim Walsh* | 15.1% | 1,525 | 1,602 | 1,736 | ||||||
| Fianna Fáil | Jimmy Curtis* | 11.8% | 1,192 | 1,351 | 1,361 | 1,362 | 1,927 | ||||
| Fine Gael | Larry O'Brien | 11.2% | 1,134 | 1,184 | 1,228 | 1,234 | 1,362 | 1,415 | 1,748 | ||
| Fine Gael | John T. Browne* | 10.2% | 1,037 | 1,059 | 1,090 | 1,096 | 1,167 | 1,217 | 1,517 | ||
| Progressive Democrats | Eoin Minihan | 8.4% | 849 | 883 | 988 | 1,014 | 1,071 | 1,102 | |||
| Labour Party | John Doyle | 8.2% | 827 | 847 | 1,059 | 1,069 | 1,100 | 1,113 | 1,276 | ||
| Fianna Fáil | Seamus Whelan* | 7.9% | 798 | 938 | 945 | 947 | |||||
| Labour Party | Patrick Doyle | 5.4% | 546 | 558 | |||||||
| Electorate: 16,815 Valid: 10,108 (60.11%) Spoilt: 138 Quota: 1,685 Turnout: 10,246 (60.93%) | |||||||||||
Wexford
| Wexford - 6 seats | ||||||||||||||
|---|---|---|---|---|---|---|---|---|---|---|---|---|---|---|
| Party | Candidate | FPv% | Count 1 | Count 2 | Count 3 | Count 4 | Count 5 | Count 6 | Count 7 | Count 8 | Count 9 | Count 10 | ||
| Labour Party | Brendan HowlinTD* | 13.1% | 1,597 | 1,624 | 1,803 | |||||||||
| Fine Gael | Senator Avril Doyle* | 11.8% | 1,431 | 1,467 | 1,483 | 1,488 | 1,555 | 1,576 | 1,619 | 1,672 | 1,689 | 1,816 | ||
| Independent | Helen Corish | 10.7% | 1,301 | 1,344 | 1,363 | 1,375 | 1,444 | 1,471 | 1,533 | 1,583 | 1,620 | 1,918 | ||
| Independent | Leo Carthy* | 8.5% | 1,032 | 1,045 | 1,060 | 1,068 | 1,133 | 1,153 | 1,160 | 1,340 | 1,455 | 1,527 | ||
| Fine Gael | Pat Codd | 8.3% | 1,013 | 1,019 | 1,028 | 1,031 | 1,070 | 1,182 | 1,186 | 1,223 | 1,236 | 1,250 | ||
| Fianna Fáil | Gus Byrne* | 8.1% | 992 | 1,012 | 1,028 | 1,031 | 1,097 | 1,246 | 1,534 | 2,141 | ||||
| Independent | Padge Reck* | 7.6% | 931 | 975 | 1,004 | 1,015 | 1,091 | 1,103 | 1,187 | 1,212 | 1,222 | 1,525 | ||
| Workers' Party | Michael Enright | 7.3% | 893 | 907 | 932 | 951 | 959 | 969 | 1,048 | 1,056 | 1,060 | |||
| Fianna Fáil | Josephine Doyle | 6.7% | 811 | 813 | 818 | 818 | 846 | 979 | 1,047 | |||||
| Fianna Fáil | Paddy Nolan | 5% | 610 | 615 | 619 | 621 | 632 | 686 | ||||||
| Fianna Fáil | Bridget Molloy | 4.4% | 537 | 540 | 542 | 542 | 567 | |||||||
| Independent | Pat Murphy | 3.9% | 472 | 476 | 481 | 481 | ||||||||
| Labour Party | Vincent Byrne | 2.7% | 323 | 331 | ||||||||||
| Progressive Democrats | John Roche | 1.9% | 234 | |||||||||||
| Electorate: 22,875 Valid: 12,177 (53.23%) Spoilt: 115 Quota: 1,740 Turnout: 12,292 (53.74%) | ||||||||||||||
External links
| Preceded by 1985 Wexford County Council election |
Wexford County Council elections | Succeeded by 1999 Wexford County Council election |
This article is issued from Wikipedia. The text is licensed under Creative Commons - Attribution - Sharealike. Additional terms may apply for the media files.