1991 Waterford City Council election
An election to Waterford City Council took place on 27 June 1991 as part of that year's Irish local elections. 15 councillors were elected from three electoral divisions by PR-STV voting for a five-year term of office.
| |||||||||||||||||||||||||||||||||||||
All 15 seats to Waterford City Council | |||||||||||||||||||||||||||||||||||||
|---|---|---|---|---|---|---|---|---|---|---|---|---|---|---|---|---|---|---|---|---|---|---|---|---|---|---|---|---|---|---|---|---|---|---|---|---|---|
| |||||||||||||||||||||||||||||||||||||
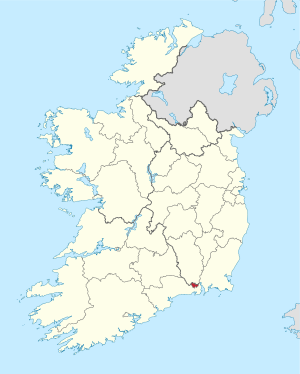 Map showing the area of Waterford City Council | |||||||||||||||||||||||||||||||||||||
| |||||||||||||||||||||||||||||||||||||
Results by party
| Party | Seats | ± | First Pref. votes | FPv% | ±% | |
|---|---|---|---|---|---|---|
| Fianna Fáil | 3 | -2 | 3,165 | 19.01% | ||
| Fine Gael | 2 | -2 | 2,220 | 13.34% | ||
| Labour Party | 3 | +1 | 3,415 | 20.5% | ||
| Workers' Party | 3 | +1 | 3,359 | 20.18% | ||
| Progressive Democrats | 2 | +2 | 1,666 | 10.01% | ||
| Independent | 2 | - | 2,360 | 14.2% | ||
| Totals | 15 | - | 16,645 | 100% | — | |
Results by Electoral Area
Waterford No.1
| Waterford No.1 - 5 seats | |||||||||||
|---|---|---|---|---|---|---|---|---|---|---|---|
| Party | Candidate | FPv% | Count 1 | Count 2 | Count 3 | Count 4 | Count 5 | Count 6 | Count 7 | ||
| Labour Party | Pat Hayes | 19.9% | 997 | ||||||||
| Fine Gael | Hilary Quinlan* | 13.4% | 669 | 694 | 715 | 739 | 797 | 834 | |||
| Workers' Party | Davy Walsh* | 12.5% | 625 | 658 | 670 | 742 | 828 | 843 | |||
| Fine Gael | James Brett* | 9.3% | 463 | 472 | 479 | 486 | 493 | 515 | 537 | ||
| Fianna Fáil | Patrick Power* | 9.2% | 459 | 472 | 525 | 549 | 565 | 809 | 849 | ||
| Progressive Democrats | Senator Martin Cullen | 8.4% | 419 | 437 | 449 | 467 | 515 | 545 | 600 | ||
| Progressive Democrats | Billy McCarthy | 6.2% | 309 | 337 | 341 | 383 | 433 | 442 | |||
| Fianna Fáil | Larry Dower | 6% | 299 | 305 | 367 | 380 | 401 | ||||
| Independent | Val White | 5.7% | 286 | 303 | 323 | 360 | |||||
| Sinn Féin | Noel Ryan | 5.5% | 273 | 281 | 288 | ||||||
| Fianna Fáil | Joe Guilfoyle | 4% | 201 | 207 | |||||||
| Electorate: 7,945 Valid: 5,000 (62.93%) Spoilt: 55 Quota: 834 Turnout: 5,055 (63.62%) | |||||||||||
Waterford No.2
| Waterford No.2 - 5 seats | |||||||||||
|---|---|---|---|---|---|---|---|---|---|---|---|
| Party | Candidate | FPv% | Count 1 | Count 2 | Count 3 | Count 4 | Count 5 | Count 6 | Count 7 | ||
| Independent | Davy Daniels* | 21.5% | 1,174 | ||||||||
| Labour Party | Liam Curham* | 15.8% | 862 | 916 | |||||||
| Fianna Fáil | Brendan KenneallyTD* | 13.2% | 720 | 761 | 769 | 803 | 974 | ||||
| Independent | Stephen Rogers* | 11% | 597 | 662 | 694 | 769 | 829 | 991 | |||
| Progressive Democrats | Brian Cunningham | 10.6% | 579 | 607 | 628 | 668 | 687 | 829 | 896 | ||
| Workers' Party | Olga Redmond | 8.9% | 484 | 501 | 527 | 580 | 597 | 676 | 691 | ||
| Fine Gael | Michael Lane | 5.9% | 319 | 335 | 407 | 446 | 466 | ||||
| Fianna Fáil | Frank King | 5.2% | 283 | 298 | 308 | 322 | |||||
| Independent | Brian Jones | 4.7% | 257 | 278 | 285 | ||||||
| Fine Gael | George Power | 3.2% | 175 | 183 | |||||||
| Electorate: 9,189 Valid: 5,450 (59.31%) Spoilt: 49 Quota: 909 Turnout: 5,489 (59.73%) | |||||||||||
Waterford No.3
| Waterford No.3 - 6 seats | ||||||||||||
|---|---|---|---|---|---|---|---|---|---|---|---|---|
| Party | Candidate | FPv% | Count 1 | Count 2 | Count 3 | Count 4 | Count 5 | Count 6 | Count 7 | Count 8 | ||
| Labour Party | Brian O'SheaTD* | 25.1% | 1,556 | |||||||||
| Workers' Party | Paddy Gallagher* | 17.5% | 1,082 | |||||||||
| Workers' Party | Martin O'Regan* | 12.7% | 784 | 898 | 953 | 971 | 1,009 | 1,098 | ||||
| Fine Gael | Maurice Cummins | 9.6% | 594 | 699 | 720 | 724 | 760 | 798 | 801 | 885 | ||
| Fianna Fáil | Tom Browne* | 7.8% | 482 | 532 | 560 | 562 | 720 | 958 | 972 | 1,028 | ||
| Fianna Fáil | Tom Murphy | 6.2% | 386 | 410 | 420 | 421 | 483 | |||||
| Workers' Party | John Halligan | 6.2% | 384 | 461 | 498 | 515 | 536 | 552 | 561 | |||
| Progressive Democrats | Michelle O'Neill | 5.8% | 359 | 432 | 468 | 473 | 511 | 561 | 581 | 698 | ||
| Fianna Fáil | Brian Swift* | 5.4% | 335 | 382 | 402 | 404 | ||||||
| Sinn Féin | Denis O'Brien | 3% | 187 | 204 | ||||||||
| Independent | Paud Sweeney | 0.7% | 46 | 62 | ||||||||
| Electorate: 10,360 Valid: 6,195 (59.8%) Spoilt: 57 Quota: 1,033 Turnout: 6,252 (60.35%) | ||||||||||||
External links
| Preceded by 1985 Waterford City Council election |
Waterford City Council elections | Succeeded by 1999 Waterford City Council election |
This article is issued from Wikipedia. The text is licensed under Creative Commons - Attribution - Sharealike. Additional terms may apply for the media files.