1991 Clare County Council election
An election to Clare County Council took place on 10 June 1999 as part of that year's Irish local elections. 32 councillors were elected from six electoral divisions by PR-STV voting for a five-year term of office.
| |||||||||||||||||||||||||||||||||
All 32 seats to Clare County Council | |||||||||||||||||||||||||||||||||
|---|---|---|---|---|---|---|---|---|---|---|---|---|---|---|---|---|---|---|---|---|---|---|---|---|---|---|---|---|---|---|---|---|---|
| |||||||||||||||||||||||||||||||||
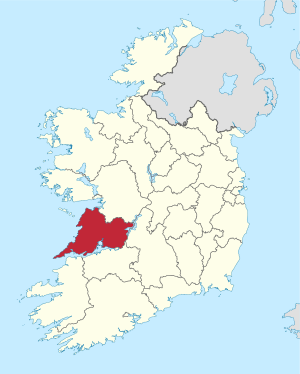 Map showing the area of Clare County Council | |||||||||||||||||||||||||||||||||
| |||||||||||||||||||||||||||||||||
Results by party
| Party | Seats | ± | First Pref. votes | FPv% | ±% | |
|---|---|---|---|---|---|---|
| Fianna Fáil | 17 | - | 21,062 | 48.54% | ||
| Fine Gael | 8 | - | 9,370 | 21.59% | ||
| Labour Party | 1 | -1 | 3,171 | 7.31% | ||
| Progressive Democrats | 1 | +1 | 2,627 | 6.05% | ||
| Independent | 5 | - | 6,701 | 15.44% | ||
| Totals | 32 | - | 43,393 | 100% | — | |
Results by Electoral Area
Ennis
| Ennis - 7 seats | |||||||||||||
|---|---|---|---|---|---|---|---|---|---|---|---|---|---|
| Party | Candidate | FPv% | Count 1 | Count 2 | Count 3 | Count 4 | Count 5 | Count 6 | Count 7 | Count 8 | Count 9 | ||
| Independent | Tommy Brennan* | 22.3% | 1,212 | ||||||||||
| Fianna Fáil | Raymond Greene | 17.3% | 942 | 966 | 990 | 1,039 | 1,120 | ||||||
| Fianna Fáil | Peter Considine | 12.9% | 702 | 722 | 735 | 749 | 870 | 932 | 1,026 | 1,056 | 1,266 | ||
| Progressive Democrats | Frankie Neylon | 11% | 599 | 619 | 633 | 653 | 688 | 738 | 940 | 942 | |||
| Labour Party | Michael Corley | 10.5% | 569 | 585 | 599 | 630 | 648 | 694 | |||||
| Fine Gael | Anna Mulqueen | 8.2% | 445 | 461 | 477 | 491 | 499 | 735 | 969 | 970 | 1,288 | ||
| Fine Gael | Michael Howard* | 7.2% | 391 | 405 | 418 | 436 | 446 | ||||||
| Fianna Fáil | Josie Nevin | 4.8% | 263 | 270 | 274 | 287 | |||||||
| Sinn Féin | Tony McCarthy | 3.5% | 190 | 196 | 207 | ||||||||
| Independent | Frank Kenny | 2.2% | 118 | 120 | |||||||||
| Electorate: 10,739 Valid: 5,431 (50.57%) Spoilt: 39 Quota: 1,087 Turnout: 5,470 (50.94%) | |||||||||||||
Ennistymon
| Ennistymon - 5 seats | |||||||
|---|---|---|---|---|---|---|---|
| Party | Candidate | FPv% | Count 1 | Count 2 | Count 3 | ||
| Fianna Fáil | Tony Killeen* | 21.1% | 1,355 | ||||
| Fine Gael | Frank Henchy* | 9.43 | 1,258 | ||||
| Labour Party | Martin Lafferty* | 17.7% | 1,142 | ||||
| Fianna Fáil | Enda Mulkere* | 17.5% | 1,128 | ||||
| Fianna Fáil | Jimmy Nagle* | 15.3% | 985 | 1,221 | |||
| Progressive Democrats | Noel Moran | 4.8% | 307 | 332 | 361 | ||
| Fine Gael | Paddy O'Connor | 4% | 260 | 281 | 437 | ||
| Electorate: 9,891 Valid: 6,435 (65.06%) Spoilt: 43 Quota: 1,073 Turnout: 6,478 (65.49%) | |||||||
Killaloe
| Killaloe - 6 seats | |||||||||||||
|---|---|---|---|---|---|---|---|---|---|---|---|---|---|
| Party | Candidate | FPv% | Count 1 | Count 2 | Count 3 | Count 4 | Count 5 | Count 6 | Count 7 | Count 8 | Count 9 | ||
| Fianna Fáil | Colm Wiley* | 13.9% | 1,377 | 1,429 | |||||||||
| Progressive Democrats | Mary Mannion | 11% | 1,094 | 1,112 | 1,186 | 1,225 | 1,226 | 1,255 | 1,666 | ||||
| Fianna Fáil | Michael Begley | 10.8% | 1,071 | 1,112 | 1,269 | 1,286 | 1,290 | 1,370 | 1,477 | ||||
| Fine Gael | Patrick Bugler* | 10.3% | 1,019 | 1,036 | 1,055 | 1,257 | 1,258 | 1,387 | 1,431 | ||||
| Fine Gael | Tony McMahon* | 10.1% | 999 | 1,010 | 1,085 | 1,176 | 1,176 | 1,189 | 1,270 | 1,399 | 1,419 | ||
| Fianna Fáil | Joe Gorman* | 10.1% | 998 | 1,007 | 1,007 | 1,101 | 1,101 | 1,194 | 1,218 | 1,250 | 1,260 | ||
| Labour Party | Brendan Hayes | 7.3 | 723 | 762 | 802 | 821 | 823 | 831 | |||||
| Fianna Fáil | Pat Hayes | 6.6% | 657 | 677 | 728 | 776 | 779 | ||||||
| Fianna Fáil | Michael Torpey | 6.2% | 617 | 625 | 656 | 785 | 786 | 1,116 | 1,158 | 1,180 | 1,195 | ||
| Fine Gael | Eugene Conlon | 5.7% | 566 | 571 | 578 | ||||||||
| Fianna Fáil | Eugene Givinan | 5.3% | 524 | 542 | |||||||||
| Sinn Féin | Tony Foley | 2.7% | 272 | ||||||||||
| Electorate: 13,913 Valid: 9,917 (71.28%) Spoilt: 69 Quota: 1,417 Turnout: 9,986 (71.77%) | |||||||||||||
Kilrush
| Kilrush - 6 seats | |||||||||||||
|---|---|---|---|---|---|---|---|---|---|---|---|---|---|
| Party | Candidate | FPv% | Count 1 | Count 2 | Count 3 | Count 4 | Count 5 | Count 6 | Count 7 | Count 8 | Count 9 | ||
| Fianna Fáil | P.J. Kelly* | 13.5% | 1,080 | 1,080 | 1,117 | 1,135 | 1,161 | ||||||
| Fine Gael | Jackie Keane* | 13.4% | 1,072 | 1,073 | 1,189 | ||||||||
| Fianna Fáil | Tom Prendeville | 12.3% | 987 | 992 | 995 | 1,047 | 1,298 | ||||||
| Fianna Fáil | Bill Chambers* | 12% | 963 | 964 | 978 | 1,041 | 1,122 | 1,151 | |||||
| Fianna Fáil | Patrick Keane | 11.5% | 924 | 927 | 939 | 976 | 1,024 | 1,035 | 1,048 | 1,052 | 1,061 | ||
| Fianna Fáil | Seán Keating* | 10.9% | 877 | 877 | 886 | 923 | 972 | 993 | 1,019 | 1,044 | 1,049 | ||
| Fine Gael | Madeleine Taylor-QuinnTD* | 10.5% | 845 | 848 | 898 | 974 | 1,144 | 1,234 | |||||
| Independent | William O'Looney* | 7.5% | 603 | 612 | 617 | 691 | |||||||
| Independent | Mossie Horgan | 4.7% | 380 | 391 | 398 | ||||||||
| Fine Gael | Tom O'Brien | 3.2% | 257 | 257 | |||||||||
| Independent | John O'Shea | 0.4% | 35 | ||||||||||
| Electorate: 11,610 Valid: 8,023 (69.10%) Spoilt: 66 Quota: 1,147 Turnout: 8,089 (69.67%) | |||||||||||||
Miltown-Malbay
| Miltown-Malbay - 6 seats | |||||||||||
|---|---|---|---|---|---|---|---|---|---|---|---|
| Party | Candidate | FPv% | Count 1 | Count 2 | Count 3 | Count 4 | Count 5 | Count 6 | Count 7 | ||
| Independent | Christy Curtin* | 19.7% | 1,416 | ||||||||
| Fianna Fáil | Michael Hillery* | 15.8% | 1,132 | ||||||||
| Independent | P.J. Burke* | 15.1% | 1,085 | ||||||||
| Fianna Fáil | James Breen* | 14.9% | 1,072 | ||||||||
| Fine Gael | Donal CareyTD* | 11.8% | 848 | 936 | 947 | 960 | 971 | 1,102 | |||
| Fianna Fáil | Flan Garvey* | 8.2% | 592 | 719 | 785 | 807 | 828 | 861 | 959 | ||
| Fianna Fáil | Bernard Hanrahan | 7.6% | 549 | 580 | 595 | 601 | 611 | 652 | 674 | ||
| Labour Party | Peadar McNamara | 3.6% | 256 | 299 | 302 | 310 | 313 | ||||
| Fine Gael | Dick Pilkington | 3.2% | 229 | 330 | 341 | 351 | 352 | 376 | |||
| Electorate: 10,040 Valid: 7,179 (71.5%) Spoilt: 42 Quota: 1,026 Turnout: 7,221 (71.92%) | |||||||||||
Shannon
| Shannon - 5 seats | |||||||||||||||
|---|---|---|---|---|---|---|---|---|---|---|---|---|---|---|---|
| Party | Candidate | FPv% | Count 1 | Count 2 | Count 3 | Count 4 | Count 5 | Count 6 | Count 7 | Count 8 | Count 9 | Count 10 | Count 11 | ||
| Independent | Patricia McCarthy* | 15% | 963 | 985 | 1,020 | 1,073 | |||||||||
| Fianna Fáil | Pat McMahon* | 14.7% | 941 | 947 | 948 | 949 | 982 | 1,029 | 1,040 | 1,222 | |||||
| Fine Gael | Sonny Scanlon* | 10.6% | 678 | 680 | 709 | 715 | 764 | 771 | 980 | 1,109 | |||||
| Independent | Brigid Makowski | 8.5% | 545 | 608 | 621 | 632 | 638 | 688 | 699 | 726 | 734 | 955 | 1,004 | ||
| Fianna Fáil | Pat O'Loughlin | 8.4% | 540 | 542 | 543 | 546 | 600 | 634 | 652 | 691 | 733 | 769 | |||
| Fianna Fáil | Seán Hillery* | 7.7% | 496 | 502 | 507 | 524 | 531 | 625 | 672 | 748 | 788 | 924 | 1,329 | ||
| Labour Party | Tom O'Shaughnessy | 7.5% | 481 | 497 | 511 | 528 | 544 | 584 | 612 | 669 | 686 | ||||
| Progressive Democrats | Tom Casey | 7.1% | 453 | 457 | 465 | 534 | 557 | 572 | 600 | ||||||
| Fine Gael | Mary Cusack | 5.2% | 336 | 338 | 380 | 380 | 383 | 388 | |||||||
| Fianna Fáil | Geraldine Lambert | 4.5% | 290 | 297 | 300 | 305 | 310 | ||||||||
| Independent | J.J. McCabe | 3.2% | 204 | 204 | 206 | 208 | |||||||||
| Progressive Democrats | Mary McGrath | 2.7% | 174 | 177 | 187 | ||||||||||
| Fine Gael | Dermot Hammond | 2.6% | 167 | 169 | |||||||||||
| Independent | Peter Flanagan | 2.2% | 140 | ||||||||||||
| Electorate: 10,717 Valid: 6,408 (59.79%) Spoilt: 20 Quota: 1,069 Turnout: 6,428 (59.98%) | |||||||||||||||
External links
| Preceded by 1985 Clare County Council election |
Clare County Council elections | Succeeded by 1999 Clare County Council election |
This article is issued from Wikipedia. The text is licensed under Creative Commons - Attribution - Sharealike. Additional terms may apply for the media files.