1991 Galway County Council election
An election to Galway County Council took place on 27 June 1991 as part of that year's Irish local elections. 30 councillors were elected from five electoral divisions by PR-STV voting for a five-year term of office.
| |||||||||||||||||||||||||||||||||
All 30 seats to Galway County Council | |||||||||||||||||||||||||||||||||
|---|---|---|---|---|---|---|---|---|---|---|---|---|---|---|---|---|---|---|---|---|---|---|---|---|---|---|---|---|---|---|---|---|---|
| |||||||||||||||||||||||||||||||||
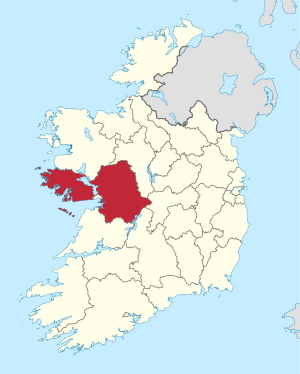 Map showing the area of Galway County Council | |||||||||||||||||||||||||||||||||
| |||||||||||||||||||||||||||||||||
Results by party
| Party | Seats | ± | First Pref. votes | FPv% | ±% | |
|---|---|---|---|---|---|---|
| Fianna Fáil | 14 | -3 | 25,630 | 44.89% | ||
| Fine Gael | 10 | +1 | 15,976 | 27.98% | ||
| Progressive Democrats | 4 | +4 | 6,177 | 10.82% | ||
| Independent | 2 | -1 | 7,630 | 13.36% | ||
| Sinn Féin --> | 0 | -1 | - | - | ||
| Totals | 30 | - | 57,093 | 100% | — | |
Results by Electoral Area
Ballinasloe
| Ballinasloe - 5 seats | ||||||||||
|---|---|---|---|---|---|---|---|---|---|---|
| Party | Candidate | FPv% | Count 1 | Count 2 | Count 3 | Count 4 | Count 5 | Count 6 | ||
| Fianna Fáil | Michael P. KittTD* | 23.8% | 2,230 | |||||||
| Fianna Fáil | Joe Callanan* | 18.7% | 1,751 | |||||||
| Fine Gael | Michael Mullins* | 17.9% | 1,676 | 1,669 | ||||||
| Fine Gael | Michael Finnerty | 12% | 1,122 | 926 | 1,184 | 1,200 | 1,597 | |||
| Fianna Fáil | James Joyce* | 9.7% | 904 | 1,177 | 1,265 | 1,380 | 1,429 | 1,442 | ||
| Independent | Joe Brennan* | 9.4% | 883 | 945 | 968 | |||||
| Fianna Fáil | Pat O'Sullivan | 8.5% | 799 | 1,070 | 1,132 | 1,393 | 1,458 | 1,480 | ||
| Electorate: 15,564 Valid: 9,365 (60.17%) Spoilt: 95 Quota: 1,562 Turnout: 9,460 (60.78%) | ||||||||||
Connemara
| Connemara - 5 seats | ||||||||||||||
|---|---|---|---|---|---|---|---|---|---|---|---|---|---|---|
| Party | Candidate | FPv% | Count 1 | Count 2 | Count 3 | Count 4 | Count 5 | Count 6 | Count 7 | Count 8 | Count 9 | Count 10 | ||
| Fianna Fáil | Senator Éamon Ó Cuív | 20% | 1,766 | |||||||||||
| Fine Gael | John Mannion Jnr* | 13.5% | 1,189 | 1,211 | 1,215 | 1,253 | 1,333 | 1,410 | 1,500 | |||||
| Fianna Fáil | Connie Ní Fhatharta | 10.1% | 890 | 948 | 952 | 955 | 958 | 1,042 | 1,057 | 1,057 | 1,136 | 1,284 | ||
| Independent | Seosamh O Cuaig* | 8.8% | 776 | 801 | 804 | 833 | 844 | 852 | 860 | 860 | 982 | |||
| Independent | Peadar O Tuathail* | 8% | 708 | 718 | 722 | 752 | 769 | 769 | 782 | 784 | 1,011 | 1,461 | ||
| Fianna Fáil | Tom Welby Snr* | 7.8% | 689 | 781 | 783 | 794 | 815 | 961 | 1,040 | 1,043 | 1,070 | 1,117 | ||
| Fine Gael | Pól Ó Foighil | 7.8% | 688 | 703 | 708 | 717 | 729 | 737 | 756 | 765 | ||||
| Progressive Democrats | Michael O'Neill | 7.3% | 647 | 656 | 658 | 696 | 765 | 836 | 1,179 | 1,191 | 1,258 | 1,307 | ||
| Progressive Democrats | Jimmy Geoghegan | 6.5% | 574 | 585 | 587 | 589 | 597 | 601 | ||||||
| Fianna Fáil | Malachy King | 4.3% | 384 | 417 | 419 | 439 | 469 | |||||||
| Independent | Malachy Gorman | 3% | 266 | 270 | 271 | 309 | ||||||||
| Independent | Erin Gibbons | 2.6% | 228 | 235 | 240 | |||||||||
| Independent | Joe Molloy | 0.4% | 35 | 41 | ||||||||||
| Electorate: 14,706 Valid: 8,840 (60.11%) Spoilt: 135 Quota: 1,474 Turnout: 8,975 (61.03%) | ||||||||||||||
Galway
| Galway- 6 seats | ||||||||||||
|---|---|---|---|---|---|---|---|---|---|---|---|---|
| Party | Candidate | FPv% | Count 1 | Count 2 | Count 3 | Count 4 | Count 5 | Count 6 | Count 7 | Count 8 | ||
| Fine Gael | Jarlath McDonagh* | 18.2% | 1,971 | |||||||||
| Independent | Seamus Gavin | 13.2% | 1,431 | 1,436 | 1,497 | 1,551 | ||||||
| Fianna Fáil | Sean O Neachtain | 11.1% | 1,201 | 1,208 | 1,227 | 1,271 | 1,400 | 1,498 | 1,566 | |||
| Fianna Fáil | Paddy McHugh* | 10.1% | 1,095 | 1,124 | 1,144 | 1,146 | 1,162 | 1,216 | 1,219 | 1,554 | ||
| Fine Gael | Padraig McCormackTD* | 9.5% | 1,027 | 1,215 | 1,242 | 1,342 | 1,392 | 1,444 | 1,492 | 1,546 | ||
| Progressive Democrats | Evelyn Varley | 7.9% | 858 | 881 | 912 | 918 | 949 | 973 | 1,342 | 1,440 | ||
| Fianna Fáil | Murty McGrath | 7% | 753 | 852 | 862 | 868 | 890 | 1,072 | 1,082 | 1,226 | ||
| Fianna Fáil | Mary Hoade | 5.3% | 571 | 584 | 595 | 603 | 627 | 682 | 704 | |||
| Fianna Fáil | John Molloy* | 4.3% | 466 | 481 | 490 | 494 | 519 | |||||
| Progressive Democrats | Marie Halliday | 4.2% | 453 | 458 | 488 | 532 | 588 | 601 | ||||
| Republican Sinn Féin | Tomas O Curraoin | 3.6% | 390 | 396 | 427 | 477 | ||||||
| Labour Party | Tom Cunningham | 2.8% | 300 | 305 | ||||||||
| Fine Gael | Patsy Clancy | 2.8% | 298 | 329 | 349 | |||||||
| Electorate: 18,636 Valid: 10,814 (58.03%) Spoilt: 111 Quota: 1,545 Turnout: 10,925 (58.62%) | ||||||||||||
Loughrea
| Loughrea - 7 seats | ||||||||||||||||||
|---|---|---|---|---|---|---|---|---|---|---|---|---|---|---|---|---|---|---|
| Party | Candidate | FPv% | Count 1 | Count 2 | Count 3 | Count 4 | Count 5 | Count 6 | Count 7 | Count 8 | Count 9 | Count 10 | Count 11 | Count 12 | Count 13 | Count 14 | ||
| Fianna Fáil | Michael (Stroke) Fahy* | 13.7% | 2,055 | |||||||||||||||
| Fianna Fáil | Matt Loughnane* | 9.9% | 1,484 | 1,511 | 1,518 | 1,523 | 1,530 | 1,551 | 1,580 | 1,586 | 1,623 | 1,861 | 2,119 | |||||
| Fine Gael | Jimmy McClearn | 9.1% | 1,367 | 1,367 | 1,367 | 1,368 | 1,372 | 1,379 | 1,482 | 1,485 | 1,618 | 1,685 | 1,690 | 1,690 | 1,848 | 1,931 | ||
| Fianna Fáil | Michael Regan* | 8.3% | 1,247 | 1,256 | 1,257 | 1,259 | 1,262 | 1,276 | 1,304 | 1,309 | 1,339 | 1,610 | 1,733 | 1,801 | 1,886 | |||
| Progressive Democrats | Willie Burke | 7.3% | 1,102 | 1,104 | 1,110 | 1,123 | 1,138 | 1,142 | 1,216 | 1,252 | 1,297 | 1,350 | 1,419 | 1,426 | 1,562 | 1,580 | ||
| Independent | Pat Hynes | 7.3% | 1,100 | 1,102 | 1,104 | 1,134 | 1,140 | 1,179 | 1,188 | 1,216 | 1,271 | 1,357 | 1,373 | 1,374 | 1,427 | 1,432 | ||
| Fine Gael | Martin Lynch* | 6.8% | 1,018 | 1,021 | 1,027 | 1,031 | 1,042 | 1,056 | 1,069 | 1,080 | 1,210 | 1,221 | 1,298 | 1,314 | ||||
| Fianna Fáil | Bernie O'Connor | 6.6% | 986 | 1,008 | 1,018 | 1,026 | 1,033 | 1,047 | 1,049 | 1,081 | 1,104 | 1,133 | ||||||
| Fianna Fáil | Michael Cunningham | 5.9% | 890 | 938 | 944 | 970 | 976 | 1,025 | 1,028 | 1,055 | 1,127 | 1,194 | 1,472 | 1,546 | 1,705 | 1,709 | ||
| Fine Gael | Toddie Byrne | 5.8% | 867 | 883 | 890 | 903 | 916 | 927 | 930 | 1,073 | 1,325 | 1,352 | 1,479 | 1,486 | 1,987 | |||
| Fianna Fáil | Michael Flanagan | 5.5% | 828 | 843 | 844 | 845 | 847 | 850 | 900 | 908 | 960 | |||||||
| Fine Gael | Justin Flannery | 5.3% | 792 | 807 | 813 | 823 | 832 | 855 | 863 | 889 | ||||||||
| Independent | Donal O'Meara | 2.3% | 342 | 343 | 344 | 346 | 353 | 354 | ||||||||||
| Workers' Party | Stan McEoin | 2.3% | 338 | 344 | 350 | 360 | 403 | 431 | 433 | |||||||||
| Sinn Féin | Michael Loughrey | 1.5% | 232 | 237 | 238 | 252 | 260 | |||||||||||
| Independent | P.J. Baldwin | 1% | 146 | 150 | 150 | |||||||||||||
| Independent | Malcolm Samuel | 0.9% | 142 | 143 | 152 | 153 | ||||||||||||
| Independent | Margaret Murphy | 0.5% | 72 | 74 | ||||||||||||||
| Electorate: 22,731 Valid: 15,008 (66.02%) Spoilt: 134 Quota: 1,877 Turnout: 15,142 (66.61%) | ||||||||||||||||||
Tuam
| Tuam - 7 seats | ||||||||||||||
|---|---|---|---|---|---|---|---|---|---|---|---|---|---|---|
| Party | Candidate | FPv% | Count 1 | Count 2 | Count 3 | Count 4 | Count 5 | Count 6 | Count 7 | Count 8 | Count 9 | Count 10 | ||
| Progressive Democrats | Joe Burke* | 14% | 1,824 | |||||||||||
| Fine Gael | Paul ConnaughtonTD | 12.6% | 1,650 | |||||||||||
| Fianna Fáil | Senator Thomas Hussey* | 11% | 1,440 | 1,455 | 1,456 | 1,610 | 1,666 | |||||||
| Fianna Fáil | Patrick Finnegan* | 9.8% | 1,274 | 1,310 | 1,311 | 1,342 | 1,413 | 1,462 | 1,474 | 1,609 | 1,805 | |||
| Fine Gael | Tiernan Walsh* | 9.1% | 1,191 | 1,194 | 1,196 | 1,232 | 1,246 | 1,366 | 1,367 | 1,420 | 1,430 | 1,434 | ||
| Fine Gael | Michael Ryan* | 8.6% | 1,120 | 1,131 | 1,137 | 1,167 | 1,304 | 1,362 | 1,365 | 1,471 | 1,680 | |||
| Republican Sinn Féin | Frank Glynn* | 6.2% | 810 | 829 | 830 | 842 | 873 | 945 | 946 | 1,147 | 1,194 | 1,217 | ||
| Progressive Democrats | T.J. Gormley | 5.5% | 719 | 805 | 806 | 810 | 855 | 899 | 900 | |||||
| Fianna Fáil | Michael Connolly | 5.4% | 703 | 710 | 711 | 789 | 860 | 909 | 919 | 963 | ||||
| Fianna Fáil | Kathleen Quinn | 5.2% | 677 | 679 | 680 | 798 | 820 | 958 | 967 | 1,008 | 1,204 | 1,348 | ||
| Independent | Sean Hehir | 4.3% | 565 | 572 | 572 | 575 | ||||||||
| Fianna Fáil | Peter Raftery* | 4.2% | 547 | 548 | 549 | |||||||||
| Independent | Tom Ward | 4.2% | 546 | 549 | 550 | 596 | 654 | |||||||
| Electorate: 19,649 Valid: 13,066 (66.50%) Spoilt: 133 Quota: 1,634 Turnout: 13,199 (67.17%) | ||||||||||||||
External links
| Preceded by 1985 Galway County Council election |
Galway County Council elections | Succeeded by 1999 Galway County Council election |
This article is issued from Wikipedia. The text is licensed under Creative Commons - Attribution - Sharealike. Additional terms may apply for the media files.