1991 Kilkenny County Council election
An election to Kilkenny County Council took place on 27 June 1991 as part of that year's Irish local elections. 26 councillors were elected from five electoral divisions by PR-STV voting for an eight-year term of office.
| |||||||||||||||||||||||||||||||||
All 26 seats to Kilkenny County Council | |||||||||||||||||||||||||||||||||
|---|---|---|---|---|---|---|---|---|---|---|---|---|---|---|---|---|---|---|---|---|---|---|---|---|---|---|---|---|---|---|---|---|---|
| |||||||||||||||||||||||||||||||||
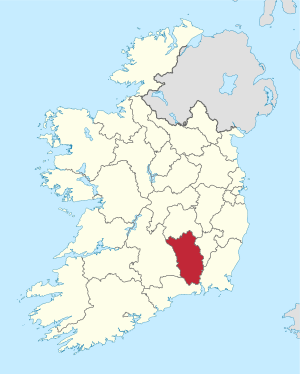 Map showing the area of Kilkenny County Council | |||||||||||||||||||||||||||||||||
| |||||||||||||||||||||||||||||||||
Results by party
| Party | Seats | ± | First Pref. votes | FPv% | ±% | |
|---|---|---|---|---|---|---|
| Fianna Fáil | 12 | +1 | 13,981 | 43.19% | ||
| Fine Gael | 10 | - | 10,787 | 33.33% | ||
| Labour Party | 4 | +1 | 5,178 | 16% | ||
| Workers' Party | 0 | -1 | 664 | 2.05% | ||
| Independent | 0 | -1 | 798 | 2.47% | ||
| Totals | 26 | - | 32,369 | 100% | — | |
Results by Electoral Area
Ballyragget
| Ballyragget - 5 seats | |||||||||||||
|---|---|---|---|---|---|---|---|---|---|---|---|---|---|
| Party | Candidate | FPv% | Count 1 | Count 2 | Count 3 | Count 4 | Count 5 | Count 6 | Count 7 | Count 8 | Count 9 | ||
| Fine Gael | Mary Hilda Cavanagh* | 16.5% | 1,142 | 1,155 | |||||||||
| Labour Party | Dick Brennan* | 13.5% | 931 | 981 | 988 | 1,011 | 1,049 | 1,191 | |||||
| Fianna Fáil | John Murphy* | 12.6% | 870 | 874 | 933 | 959 | 1,043 | 1,271 | |||||
| Fine Gael | John Brennan | 11.5% | 797 | 802 | 804 | 820 | 1,094 | 1,212 | |||||
| Fianna Fáil | Martin Fitzpatrick | 9.9% | 682 | 685 | 758 | 882 | 902 | 967 | 1,033 | 1,059 | 1,089 | ||
| Fianna Fáil | Patricia Owens | 9.4% | 650 | 653 | 661 | 677 | 698 | ||||||
| Fianna Fáil | Shem O'Donnell | 8.8% | 609 | 631 | 737 | 768 | 848 | 959 | 1,010 | 1,021 | 1,028 | ||
| Fine Gael | Kathleen Conroy | 7.4% | 509 | 513 | 519 | 555 | |||||||
| Independent | Brid Phelan | 4.5% | 313 | 316 | 350 | ||||||||
| Fianna Fáil | Michael Wilson | 4.4% | 304 | 306 | |||||||||
| Labour Party | John Bergin | 1.6% | 111 | ||||||||||
| Electorate: 9,780 Valid: 6,918 (70.74%) Spoilt: 78 Quota: 1,154 Turnout: 6,996 (71.53%) | |||||||||||||
Kilkenny
| Kilkenny - 4 seats | |||||||||||
|---|---|---|---|---|---|---|---|---|---|---|---|
| Party | Candidate | FPv% | Count 1 | Count 2 | Count 3 | Count 4 | Count 5 | Count 6 | Count 7 | ||
| Labour Party | Seamus PattisonTD* | 24.3% | 1,130 | ||||||||
| Fianna Fáil | Senator Michael Lanigan* | 16.5% | 765 | 792 | 815 | 834 | 842 | 995 | |||
| Fine Gael | Kieran Crotty* | 15.4% | 715 | 762 | 791 | 983 | |||||
| Fianna Fáil | Michael McGuinness | 14.6% | 680 | 701 | 713 | 737 | 741 | 833 | 917 | ||
| Fianna Fáil | Evelyn White | 6.6% | 306 | 322 | 342 | 361 | 366 | ||||
| Fine Gael | Carmel Boyd | 6.4% | 299 | 319 | 329 | ||||||
| Independent | John Bolger* | 6.3% | 292 | 317 | 346 | 394 | 423 | 478 | 624 | ||
| Workers' Party | Joe Butler | 5.8% | 268 | 299 | 362 | 376 | 383 | 409 | |||
| Fianna Fáil | Michael McGrath | 4.2% | 193 | 206 | |||||||
| Electorate: 8,088 Valid: 4,648 (57.47%) Spoilt: 39 Quota: 930 Turnout: 4,687 (57.95%) | |||||||||||
Piltown
| Piltown - 7 seats | ||||||||||||
|---|---|---|---|---|---|---|---|---|---|---|---|---|
| Party | Candidate | FPv% | Count 1 | Count 2 | Count 3 | Count 4 | Count 5 | Count 6 | Count 7 | Count 8 | ||
| Fianna Fáil | Liam AylwardTD* | 23.6% | 1,906 | |||||||||
| Fine Gael | Dick Dowling* | 15.2% | 1,229 | |||||||||
| Fine Gael | Andy Cotterell* | 9.5% | 763 | 812 | 896 | 914 | 931 | 1,069 | ||||
| Labour Party | Joe Walsh | 9.3% | 750 | 795 | 814 | 1,045 | ||||||
| Fine Gael | John Maher* | 8.6% | 697 | 753 | 773 | 784 | 795 | 1,081 | ||||
| Fianna Fáil | Marguerite Drea | 6.6% | 534 | 676 | 682 | 690 | 822 | 837 | 843 | 849 | ||
| Fianna Fáil | Dick Dunphy* | 6.4% | 517 | 739 | 748 | 754 | 855 | 922 | 962 | 981 | ||
| Fine Gael | Catherine Kearns | 6% | 482 | 508 | 563 | 579 | 596 | |||||
| Fianna Fáil | Ann Blackmore | 5.7% | 456 | 678 | 682 | 702 | 823 | 858 | 884 | 890 | ||
| Workers' Party | Martin Kennedy* | 4.9% | 396 | 421 | 434 | |||||||
| Fianna Fáil | Albert Byrne | 4.2% | 335 | 445 | 455 | 491 | ||||||
| Electorate: 12,979 Valid: 8,065 (62.14%) Spoilt: 106 Quota: 1,009 Turnout: 8,171 (62.96%) | ||||||||||||
Thomastown
| Thomastown - 6 seats | |||||||||||
|---|---|---|---|---|---|---|---|---|---|---|---|
| Party | Candidate | FPv% | Count 1 | Count 2 | Count 3 | Count 4 | Count 5 | Count 6 | Count 7 | ||
| Fianna Fáil | James Brett* | 15.7% | 1,179 | ||||||||
| Labour Party | Michael O'Brien* | 14% | 1,055 | 1,061 | 1,075 | ||||||
| Fianna Fáil | Kevin Fennelly | 12.3% | 922 | 948 | 965 | 1,028 | |||||
| Fine Gael | Billy Ireland* | 11.1% | 835 | 841 | 858 | 904 | 936 | 946 | 1,015 | ||
| Fine Gael | Tom Maher | 9.2% | 692 | 701 | 717 | 780 | 940 | 960 | 991 | ||
| Labour Party | John Bolger | 8.6% | 646 | 648 | 657 | 689 | 703 | 708 | |||
| Fine Gael | Philip Brennan* | 8% | 600 | 605 | 610 | 699 | 716 | 729 | 815 | ||
| Fianna Fáil | Michael Fenlon* | 7.6% | 573 | 586 | 594 | 606 | 675 | 806 | 1,039 | ||
| Fianna Fáil | Breda Somers* | 6.6% | 493 | 518 | 528 | 598 | |||||
| Progressive Democrats | Patrick Crowley | 4.7% | 350 | 360 | 434 | ||||||
| Progressive Democrats | Donal McDonald | 2.3% | 175 | 177 | |||||||
| Electorate: 11,771 Valid: 7,520 (63.89%) Spoilt: 96 Quota: 1,075 Turnout: 7,616 (64.7%) | |||||||||||
Tullaroan
| Tullaroan - 4 seats | |||||||||||
|---|---|---|---|---|---|---|---|---|---|---|---|
| Party | Candidate | FPv% | Count 1 | Count 2 | Count 3 | Count 4 | Count 5 | Count 6 | Count 7 | ||
| Fine Gael | Phil HoganTD* | 20.6% | 1,073 | ||||||||
| Fianna Fáil | Pat Millea* | 14.4% | 754 | 758 | 831 | 857 | 931 | 1,244 | |||
| Fianna Fáil | John McGuinness | 12.1% | 633 | 634 | 709 | 733 | 794 | 949 | 1,098 | ||
| Fine Gael | Margaret Tynan* | 11.1% | 578 | 587 | 606 | 789 | 960 | 1,036 | 1,060 | ||
| Labour Party | Tony Patterson | 10.6% | 555 | 557 | 580 | 647 | 739 | 789 | 816 | ||
| Fianna Fáil | Joe Rice | 9.1% | 476 | 477 | 561 | 586 | 665 | ||||
| Progressive Democrats | Martin Gibbons* | 8.4% | 436 | 438 | 473 | 534 | |||||
| Fine Gael | Paul Cuddihy | 7.2% | 376 | 385 | 397 | ||||||
| Fianna Fáil | Tom Brennan* | 6.5% | 337 | 338 | |||||||
| Electorate: 8,832 Valid: 5,218 (59.04%) Spoilt: 49 Quota: 1,044 Turnout: 5,267 (59.64%) | |||||||||||
External links
| Preceded by 1985 Kilkenny County Council election |
Kilkenny County Council elections | Succeeded by 1999 Kilkenny County Council election |
This article is issued from Wikipedia. The text is licensed under Creative Commons - Attribution - Sharealike. Additional terms may apply for the media files.