1991 Laois County Council election
An election to Laois County Council took place on 27 June 1991 as part of that year's Irish local elections. 25 councillors were elected from five electoral divisions by PR-STV voting for a five-year term of office.
| |||||||||||||||||||||||||||||||||
All 25 seats to Laois County Council | |||||||||||||||||||||||||||||||||
|---|---|---|---|---|---|---|---|---|---|---|---|---|---|---|---|---|---|---|---|---|---|---|---|---|---|---|---|---|---|---|---|---|---|
| |||||||||||||||||||||||||||||||||
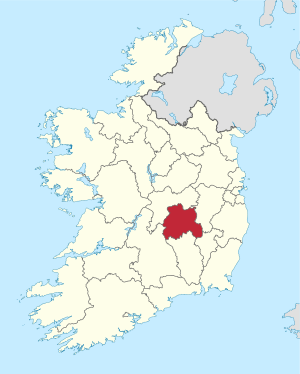 Map showing the area of Laois County Council | |||||||||||||||||||||||||||||||||
| |||||||||||||||||||||||||||||||||
Results by party
| Party | Seats | ± | First Pref. votes | FPv% | ±% | |
|---|---|---|---|---|---|---|
| Fianna Fáil | 13 | -1 | 11,454 | 49.33% | ||
| Fine Gael | 9 | - | 7,910 | 34.07% | ||
| Labour Party | 1 | - | 1,672 | 7.20% | ||
| Progressive Democrats | 1 | +1 | 944 | 4.07% | ||
| Independent | 1 | - | 1,239 | 5.34% | ||
| Totals | 25 | - | 23,219 | 100% | — | |
Results by Electoral Area
Borris-in-Ossory
| Borris-in-Ossory - 7 seats | |||||||||||||
|---|---|---|---|---|---|---|---|---|---|---|---|---|---|
| Party | Candidate | FPv% | Count 1 | Count 2 | Count 3 | Count 4 | Count 5 | Count 6 | Count 7 | Count 8 | Count 9 | ||
| Fianna Fáil | Liam HylandTD* | 18% | 1,219 | ||||||||||
| Independent | Jimmy Kelly* | 12.2% | 828 | 856 | |||||||||
| Fianna Fáil | Kieran Phelan | 11.1% | 751 | 816 | 818 | 861 | |||||||
| Fine Gael | William Mansfield* | 10.7% | 728 | 749 | 751 | 819 | 826 | 898 | |||||
| Labour Party | Larry Kavanagh | 8.8% | 594 | 617 | 618 | 630 | 631 | 729 | 735 | 844 | 917 | ||
| Fianna Fáil | Eamon Rafter* | 8% | 539 | 590 | 591 | 629 | 633 | 638 | 638 | 726 | 754 | ||
| Fine Gael | Marty Phelan | 7% | 476 | 513 | 513 | 576 | 576 | 601 | 612 | 644 | 902 | ||
| Fine Gael | Stephen Murphy | 6.11 | 411 | 425 | 425 | 433 | 433 | 455 | 487 | 496 | |||
| Fianna Fáil | Thomas Fennelly | 5.8% | 392 | 446 | 447 | 447 | 451 | 457 | 457 | 555 | 624 | ||
| Fianna Fáil | Fintan Phelan* | 4.4% | 299 | 365 | 366 | 376 | 377 | 412 | 413 | ||||
| Fine Gael | Patrick McMahon* | 4% | 272 | 276 | 276 | 278 | 278 | ||||||
| Independent | Peter Loughman | 3.9% | 267 | 275 | 275 | ||||||||
| Electorate: 12,812 Valid: 7,814 (60.99%) Spoilt: 116 Quota: 977 Turnout: 7,930 (61.90%) | |||||||||||||
Emo
| Emo- 4 seats | |||||||
|---|---|---|---|---|---|---|---|
| Party | Candidate | FPv% | Count 1 | Count 2 | Count 3 | ||
| Fianna Fáil | Ray Cribbin* | 27.7% | 1,047 | ||||
| Progressive Democrats | Cathy Honan | 17.3% | 652 | 725 | 896 | ||
| Fine Gael | Jim Buggie* | 16.3% | 616 | 624 | 750 | ||
| Fianna Fáil | Theresa Mulhare | 15.3% | 579 | 742 | 770 | ||
| Labour Party | Paddy Bray | 13.5% | 512 | 515 | 590 | ||
| Fine Gael | Sam Gee | 6.5% | 245 | 268 | |||
| Labour Party | Anthony Martin | 3.4% | 128 | 149 | |||
| Electorate: 6,413 Valid: 3,779 (58.93%) Spoilt: 34 Quota: 756 Turnout: 3,813 (59.29%) | |||||||
Luggacurren
| Luggacurren- 4 seats | ||||||||||
|---|---|---|---|---|---|---|---|---|---|---|
| Party | Candidate | FPv% | Count 1 | Count 2 | Count 3 | Count 4 | Count 5 | Count 6 | ||
| Fianna Fáil | James Cooney* | 15.9% | 600 | 629 | 758 | |||||
| Fine Gael | John Moran | 15.5% | 585 | 661 | 693 | 843 | ||||
| Fianna Fáil | Martin Rohan* | 15.3% | 575 | 581 | 626 | 663 | 667 | 679 | ||
| Fianna Fáil | Mary Wheatley* | 13% | 491 | 538 | 631 | 674 | 678 | 690 | ||
| Fine Gael | James Daly | 12.7% | 478 | 552 | 575 | 742 | 822 | |||
| Fianna Fáil | Mary Redmond | 9.8% | 368 | 382 | ||||||
| Fine Gael | Senator Charles McDonald* | 9.5% | 358 | 394 | 431 | |||||
| Labour Party | Tony O'Brien | 7.9% | 299 | |||||||
| Independent | Thomas McCormack | 0.4% | 16 | |||||||
| Electorate: 5,972 Valid: 3,770 (63.13%) Spoilt: 35 Quota: 755 Turnout: 3,805 (63.71%) | ||||||||||
Portlaoise
| Portlaoise - 5 seats | ||||||||||||||
|---|---|---|---|---|---|---|---|---|---|---|---|---|---|---|
| Party | Candidate | FPv% | Count 1 | Count 2 | Count 3 | Count 4 | Count 5 | Count 6 | Count 7 | Count 8 | Count 9 | Count 10 | ||
| Fianna Fáil | Joe Dunne* | 30.5% | 1,316 | |||||||||||
| Fine Gael | William Aird* | 14.5% | 625 | 684 | 685 | 698 | 741 | |||||||
| Fine Gael | Tom Keenan* | 14.5% | 624 | 686 | 688 | 711 | 747 | |||||||
| Fianna Fáil | Tom Jacob | 7.3% | 314 | 489 | 489 | 500 | 517 | 519 | 521 | 534 | 559 | 703 | ||
| Fianna Fáil | Jerry Lodge* | 7.1% | 304 | 436 | 436 | 450 | 466 | 472 | 476 | 518 | 549 | 678 | ||
| Progressive Democrats | Assumpta Broomfield | 6.8% | 292 | 314 | 314 | 325 | 338 | 343 | 346 | 397 | 464 | 493 | ||
| Fianna Fáil | John Fitzgibbon | 5.9% | 254 | 331 | 331 | 338 | 341 | 341 | 342 | 350 | 373 | |||
| Fine Gael | Ger O'Donoghue | 4.3% | 187 | 198 | 198 | 205 | 221 | 233 | 246 | 267 | ||||
| Labour Party | Tom Phelan | 3.2% | 139 | 151 | 151 | 178 | 184 | 186 | 188 | |||||
| Fine Gael | Anthony Dunne | 3% | 129 | 150 | 152 | 165 | ||||||||
| Independent | Joe McCormack | 2.8% | 120 | 145 | 149 | |||||||||
| Independent | Joseph Bannan | 0.2% | 8 | 9 | ||||||||||
| Electorate: 7,588 Valid: 4,312 (56.83%) Spoilt: 24 Quota: 719 Turnout: 4,336 (57.14%) | ||||||||||||||
Tinnahinch
| Tinnahinch- 5 seats | ||||||||
|---|---|---|---|---|---|---|---|---|
| Party | Candidate | FPv% | Count 1 | Count 2 | Count 3 | Count 4 | ||
| Fianna Fáil | John Moloney* | 26.6% | 1,217 | |||||
| Fine Gael | Michael Lalor | 15.4% | 704 | 719 | 725 | 872 | ||
| Fianna Fáil | Seamus McDonald* | 14.6% | 671 | 911 | ||||
| Fine Gael | Charles FlanaganTD* | 14.6% | 670 | 761 | 780 | |||
| Fianna Fáil | Joe Digan* | 11.3% | 518 | 584 | 694 | 785 | ||
| Fine Gael | David Goodwin* | 10.1 | 462 | 498 | 509 | 594 | ||
| Fine Gael | William Daly | 7.4% | 340 | 345 | 346 | |||
| Electorate: 6,381 Valid: 4,582 (71.81%) Spoilt: 44 Quota: 764 Turnout: 4,626 (72.5%) | ||||||||
External links
| Preceded by 1985 Laois County Council election |
Laois County Council elections | Succeeded by 1999 Laois County Council election |
This article is issued from Wikipedia. The text is licensed under Creative Commons - Attribution - Sharealike. Additional terms may apply for the media files.