1991 Limerick County Council election
An election to Limerick County Council took place on 27 June 1991 as part of that year's Irish local elections. 28 councillors were elected from five electoral divisions by PR-STV voting for a five-year term of office.
| |||||||||||||||||||||||||||||||||
All 28 seats to Limerick County Council | |||||||||||||||||||||||||||||||||
|---|---|---|---|---|---|---|---|---|---|---|---|---|---|---|---|---|---|---|---|---|---|---|---|---|---|---|---|---|---|---|---|---|---|
| |||||||||||||||||||||||||||||||||
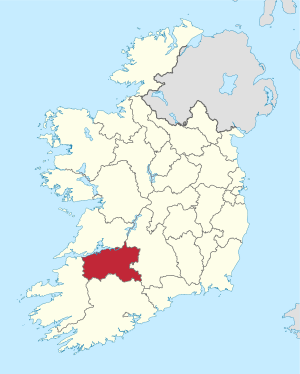 Map showing the area of Limerick County Council | |||||||||||||||||||||||||||||||||
| |||||||||||||||||||||||||||||||||
Results by party
| Party | Seats | ± | First Pref. votes | FPv% | ±% | |
|---|---|---|---|---|---|---|
| Fianna Fáil | 13 | -5 | 21,238 | 43.28% | ||
| Fine Gael | 10 | - | 15,765 | 32.13% | ||
| Progressive Democrats | 4 | +4 | 7,627 | 15.54% | ||
| Labour Party | 1 | +1 | 1,990 | 4.06% | ||
| Totals | 28 | - | 49,068 | 100% | — | |
Results by Electoral Area
Bruff
| Bruff - 6 seats | |||||||||||
|---|---|---|---|---|---|---|---|---|---|---|---|
| Party | Candidate | FPv% | Count 1 | Count 2 | Count 3 | Count 4 | Count 5 | Count 6 | Count 7 | ||
| Fianna Fáil | Michael Brennan* | 18.4% | 1,976 | ||||||||
| Fine Gael | Michael NoonanTD | 13.7% | 1,480 | 1,492 | 1,514 | 1,565 | |||||
| Fianna Fáil | Michael Collins* | 12.3% | 1,328 | 1,497 | 1,505 | 1,545 | |||||
| Fianna Fáil | John Clifford | 12.2% | 1,316 | 1,465 | 1,479 | 1,508 | 1,522 | 1,525 | 1,646 | ||
| Progressive Democrats | Tim O'Malley | 11.9% | 1,281 | 1,300 | 1,408 | 1,661 | |||||
| Fine Gael | Jim McCarthy* | 9.6% | 1,034 | 1,039 | 1,112 | 1,126 | 1,168 | 1,174 | 1,473 | ||
| Fine Gael | Charlie Hanley | 7.9% | 855 | 911 | 918 | 969 | 996 | 1,005 | 1,099 | ||
| Labour Party | Noelle Dason | 6.9% | 740 | 748 | 780 | 822 | 861 | 869 | |||
| Progressive Democrats | Bobbie Penn | 4.% | 434 | 447 | 502 | ||||||
| Progressive Democrats | John Wright | 3% | 323 | 329 | |||||||
| Electorate: 19,044 Valid: 10,767 (56.54%) Spoilt: 76 Quota: 1,539 Turnout: 10,843 (56.94%) | |||||||||||
Castleconnell
| Castleconnell - 6 seats | ||||||||||||||
|---|---|---|---|---|---|---|---|---|---|---|---|---|---|---|
| Party | Candidate | FPv% | Count 1 | Count 2 | Count 3 | Count 4 | Count 5 | Count 6 | Count 7 | Count 8 | Count 9 | Count 10 | ||
| Fianna Fáil | Eddie Wade* | 17.9% | 2,039 | |||||||||||
| Progressive Democrats | Peadar ClohessyTD* | 14.2% | 1,623 | 1,722 | ||||||||||
| Fine Gael | Senator Mary Jackman* | 12.6% | 1,443 | 1,465 | 1,477 | 1,702 | ||||||||
| Fine Gael | Paddy Hourigan* | 9.2% | 1,048 | 1,065 | 1,078 | 1,097 | 1,110 | 1,212 | 1,320 | 1,373 | 1,542 | 1,557 | ||
| Fianna Fáil | Noel Gleeson* | 8.2% | 934 | 998 | 1,006 | 1,017 | 1,019 | 1,167 | 1,193 | 1,467 | 1,697 | |||
| Fianna Fáil | Willie Keane | 6.7% | 760 | 812 | 823 | 855 | 861 | 882 | 984 | 1,109 | 1,186 | 1,218 | ||
| Independent | William Meagher | 6.3% | 721 | 733 | 736 | 766 | 770 | 804 | 913 | 1,037 | ||||
| Progressive Democrats | Michael Finucane | 5.5% | 631 | 660 | 680 | 742 | 759 | 960 | 1,044 | 1,099 | 1,210 | 1,228 | ||
| Fianna Fáil | Tim Long | 5.4% | 612 | 692 | 704 | 715 | 718 | 748 | 779 | |||||
| Progressive Democrats | Martin Ryan | 5% | 574 | 589 | 592 | 600 | 606 | |||||||
| Labour Party | Joe Liston | 4.8% | 552 | 562 | 568 | 604 | 623 | 639 | ||||||
| Independent | Jim Duffy | 4.2% | 484 | 491 | 493 | |||||||||
| Electorate: 18,499 Valid: 11,421 (61.74%) Spoilt: 95 Quota: 1,632 Turnout: 11,516 (62.25%) | ||||||||||||||
Kilmallock
| Kilmallock - 5 seats | ||||||||
|---|---|---|---|---|---|---|---|---|
| Party | Candidate | FPv% | Count 1 | Count 2 | Count 3 | Count 4 | ||
| Fine Gael | Matt Callaghan* | 22.7% | 1,865 | |||||
| Fine Gael | Jim Houlihan* | 18% | 1,479 | |||||
| Fianna Fáil | Michael Barry* | 15.8% | 1,298 | 1,334 | 1,352 | 1,651 | ||
| Progressive Democrats | Eddie Creighton* | 15.2% | 1,248 | 1,325 | 1,341 | 1,434 | ||
| Fianna Fáil | William Sampson* | 12.8% | 1,053 | 1,147 | 1,151 | 1,389 | ||
| Fine Gael | John O'Grady | 7.9% | 654 | 829 | 887 | 916 | ||
| Fianna Fáil | Alan Mee* | 7.7% | 634 | 745 | 756 | |||
| Electorate: 12,482 Valid: 8,231 (65.94%) Spoilt: 97 Quota: 1,372 Turnout: 8,328 (66.72%) | ||||||||
Newcastle
| Newcastle - 6 seats | |||||||||||
|---|---|---|---|---|---|---|---|---|---|---|---|
| Party | Candidate | FPv% | Count 1 | Count 2 | Count 3 | Count 4 | Count 5 | Count 6 | Count 7 | ||
| Fianna Fáil | Michael O'Kelly* | 17.4% | 1,668 | ||||||||
| Fine Gael | Michael FinucaneTD* | 13.5% | 1,300 | 1,309 | 1,331 | 1,382 | |||||
| Fianna Fáil | Michael Healy* | 11.2% | 1,075 | 1,106 | 1,125 | 1,170 | 1,196 | 1,281 | 1,354 | ||
| Fianna Fáil | John Cregan | 10.5% | 1,013 | 1,039 | 1,040 | 1,048 | 1,107 | 1,146 | 1,285 | ||
| Fianna Fáil | Thomas Ahern* | 10.2% | 976 | 1,109 | 1,119 | 1,129 | 1,147 | 1,171 | 1,208 | ||
| Fine Gael | Seán Broderick | 9.7% | 933 | 1,011 | 1,012 | 1,025 | 1,044 | 1,107 | 1,374 | ||
| Fine Gael | John Kelly* | 7.3% | 706 | 709 | 726 | 757 | 814 | 927 | |||
| Labour Party | Mary Kelly | 7.3% | 698 | 704 | 736 | 783 | 845 | 1,009 | 1,228 | ||
| Progressive Democrats | Sean Liston | 5.5 | 525 | 529 | 533 | 605 | 628 | ||||
| Sinn Féin | Coireall MacCurtain | 3.1% | 300 | 301 | 304 | 311 | |||||
| Progressive Democrats | Seamus Hunt | 3% | 288 | 292 | 301 | ||||||
| Independent | Michael Flynn | 1.3% | 127 | 127 | |||||||
| Electorate: 14,404 Valid: 9,609 (66.71%) Spoilt: 109 Quota: 1,373 Turnout: 9,718 (67.47%) | |||||||||||
Rathkeale
| Rathkeale- 5 seats | ||||||||||||
|---|---|---|---|---|---|---|---|---|---|---|---|---|
| Party | Candidate | FPv% | Count 1 | Count 2 | Count 3 | Count 4 | Count 5 | Count 6 | Count 7 | Count 8 | ||
| Fine Gael | Senator Dan Neville* | 18.8% | 1,699 | |||||||||
| Fianna Fáil | Kevin Sheahan* | 17.9% | 1,614 | |||||||||
| Fianna Fáil | John Griffin* | 16.5% | 1,493 | 1,522 | ||||||||
| Fianna Fáil | Maureen Barrett* | 16% | 1,449 | 1,457 | 1,503 | 1,504 | 1,515 | |||||
| Fine Gael | Jimmy Reidy | 7.7% | 696 | 729 | 732 | 732 | 737 | 775 | 821 | |||
| Fine Gael | David Naughton | 6.3% | 573 | 638 | 654 | 656 | 673 | 736 | 832 | 1,222 | ||
| Progressive Democrats | John Carrig | 6.2% | 564 | 585 | 604 | 607 | 651 | 721 | 896 | 1,017 | ||
| Green Party | Patrick O'Doherty | 5.9% | 532 | 551 | 555 | 558 | 581 | 635 | ||||
| Independent | Basil Fitzgibbon | 3.1% | 284 | 291 | 308 | 308 | 320 | |||||
| Progressive Democrats | Patrick Sheehan | 1.5% | 136 | 146 | 148 | 154 | ||||||
| Electorate: 12,705 Valid: 9,040 (71.15%) Spoilt: 147 Quota: 1,507 Turnout: 9,113 (71.73%) | ||||||||||||
External links
| Preceded by 1985 Limerick County Council election |
Limerick County Council elections | Succeeded by 1999 Limerick County Council election |
This article is issued from Wikipedia. The text is licensed under Creative Commons - Attribution - Sharealike. Additional terms may apply for the media files.