1991 Mayo County Council election
An election to Mayo County Council took place on 27 June 1991 as part of that year's Irish local elections. 31 councillors were elected from seven electoral divisions by PR-STV voting for a five-year term of office.
| |||||||||||||||||||||||||||||||||
All 31 seats to Mayo County Council | |||||||||||||||||||||||||||||||||
|---|---|---|---|---|---|---|---|---|---|---|---|---|---|---|---|---|---|---|---|---|---|---|---|---|---|---|---|---|---|---|---|---|---|
| |||||||||||||||||||||||||||||||||
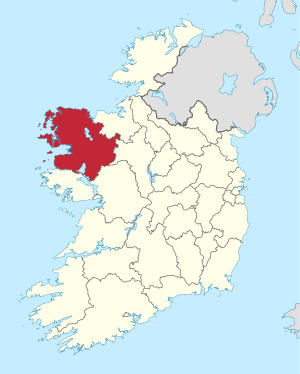 Map showing the area of Mayo County Council | |||||||||||||||||||||||||||||||||
| |||||||||||||||||||||||||||||||||
Results by party
| Party | Seats | ± | First Pref. votes | FPv% | ±% | |
|---|---|---|---|---|---|---|
| Fianna Fáil | 15 | - | 25,672 | 47.29% | ||
| Fine Gael | 13 | -1 | 21,656 | 39.89% | ||
| Labour Party | 1 | +1 | 1,949 | 3.59% | ||
| Independent | 2 | - | 3,484 | 6.42% | ||
| Sinn Féin | 0 | - | 860 | 0.59% | ||
| Green Party | 0 | - | 336 | 0.59% | ||
| Totals | 31 | - | 54,292 | 100% | — | |
Results by Electoral Area
Ballina
| Ballina - 6 seats | |||||||||||
|---|---|---|---|---|---|---|---|---|---|---|---|
| Party | Candidate | FPv% | Count 1 | Count 2 | Count 3 | Count 4 | Count 5 | Count 6 | Count 7 | ||
| Fianna Fáil | Annie Mae Reape | 15.6% | 1,578 | ||||||||
| Fine Gael | Ernie Caffrey | 12.7% | 1,284 | 1,346 | 1,376 | 1,504 | |||||
| Fianna Fáil | Padraic Bourke* | 12.3% | 1,244 | 1,267 | 1,314 | 1,371 | 1,571 | ||||
| Fianna Fáil | Stephen Molloy | 11.9% | 1,200 | 1,206 | 1,218 | 1,238 | 1,253 | 1,275 | 1,290 | ||
| Fine Gael | Frank Devaney* | 11.5% | 1,160 | 1,169 | 1,172 | 1,216 | 1,414 | 1,459 | |||
| Fine Gael | Eddie Staunton* | 11.2% | 1,132 | 1,148 | 1,153 | 1,230 | 1,530 | ||||
| Fianna Fáil | Jimmy Glacken* | 8.5% | 857 | 879 | 903 | 1,125 | 1,162 | 1,189 | 1,200 | ||
| Fine Gael | Paddy Naughten | 7.9% | 801 | 813 | 819 | 873 | |||||
| Independent | Tony Durkan | 6.2% | 630 | 687 | 694 | ||||||
| Labour Party | Dick Melrose | 2.2% | 221 | ||||||||
| Electorate: 15,551 Valid: 10,107 (64.99%) Spoilt: 162 Quota: 1,444 Turnout: 10,188 (65.51%) | |||||||||||
Castlebar
| Castlebar - 5 seats | ||||||||||
|---|---|---|---|---|---|---|---|---|---|---|
| Party | Candidate | FPv% | Count 1 | Count 2 | Count 3 | Count 4 | Count 5 | Count 6 | ||
| Fianna Fáil | Al McDonnell* | 19.7% | 1,851 | |||||||
| Fine Gael | Enda KennyTD* | 14.1% | 1,327 | 1,343 | 1,497 | 1,628 | ||||
| Fianna Fáil | Richard Morrin* | 12.08 | 1,204 | 1,284 | 1,362 | 1,565 | ||||
| Fine Gael | Paddy Burke* | 11.1% | 1,047 | 1,097 | 1,178 | 1,236 | 1,646 | |||
| Labour Party | Johnny Mee | 10.6% | 999 | 1,006 | 1,161 | 1,210 | 1,441 | 1,508 | ||
| Fianna Fáil | George O'Malley | 8.9% | 834 | 886 | 920 | 1,146 | 1,233 | 1,246 | ||
| Fine Gael | Liam Coady | 8.6% | 806 | 813 | 873 | 886 | ||||
| Fine Gael | Regina Mulrooney | 7.6% | 713 | 772 | 797 | |||||
| Progressive Democrats | Kevin Bourke | 6.5% | 613 | 627 | ||||||
| Electorate: 14,146 Valid: 9,394 (66.41%) Spoilt: 77 Quota: 1,566 Turnout: 9,471 (66.95%) | ||||||||||
Claremorris
| Claremorris- 7 seats | |||||||||||||
|---|---|---|---|---|---|---|---|---|---|---|---|---|---|
| Party | Candidate | FPv% | Count 1 | Count 2 | Count 3 | Count 4 | Count 5 | Count 6 | Count 7 | Count 8 | Count 9 | ||
| Fine Gael | Jim HigginsTD* | 14.8% | 1,862 | ||||||||||
| Fianna Fáil | P.J. MorleyTD* | 12.1% | 1,517 | 1,580 | |||||||||
| Fianna Fáil | Patrick McHugh* | 10% | 1,254 | 1,260 | 1,271 | 1,292 | 1,370 | 1,801 | |||||
| Fianna Fáil | Jack Heneghan* | 9.6% | 1,209 | 1,211 | 1,236 | 1,377 | 1,388 | 1,541 | 1,709 | ||||
| Independent | Richard Finn | 9.1% | 1,141 | 1,179 | 1,239 | 1,291 | 1,504 | 1,726 | |||||
| Fine Gael | Jim Mannion* | 8.7% | 1,095 | 1,122 | 1,156 | 1,243 | 1,482 | 1,557 | 1,599 | ||||
| Fine Gael | Michael Raftery* | 7.5% | 942 | 946 | 970 | 1,205 | 1,237 | 1,244 | 1,248 | 1,252 | 1,257 | ||
| Fianna Fáil | Sean Fitzpatrick* | 7.3% | 913 | 916 | 949 | 979 | 1,085 | ||||||
| Fine Gael | Tom Higgins | 6.8% | 860 | 946 | 962 | 975 | 1,102 | 1,138 | 1,149 | 1,174 | 1,188 | ||
| Fine Gael | Ray Leonard | 6.% | 761 | 812 | 862 | 891 | |||||||
| Progressive Democrats | Michael Ryan | 12.5% | 691 | 694 | 739 | ||||||||
| Labour Party | John Murphy | 12.5% | 297 | 300 | |||||||||
| Independent | Michael Robinson | 0.3% | 44 | 46 | |||||||||
| Electorate: 18,132 Valid: 12,586 (69.41%) Spoilt: 80 Quota: 1,574 Turnout: 12,666 (69.85%) | |||||||||||||
Killala
| Killala - 4 seats | ||||||||||
|---|---|---|---|---|---|---|---|---|---|---|
| Party | Candidate | FPv% | Count 1 | Count 2 | Count 3 | Count 4 | Count 5 | Count 6 | ||
| Independent | Padraig Cosgrove* | 22.6% | 1,350 | |||||||
| Fine Gael | Vinnie Munnelly* | 17.4% | 1,039 | 1,069 | 1,077 | 1,086 | 1,087 | 1,104 | ||
| Fianna Fáil | Tim Quinn* | 16.6% | 994 | 1,041 | 1,309 | |||||
| Fianna Fáil | Brian Golden | 15.9 | 949 | 963 | 1,005 | 1,019 | 1,127 | 1,139 | ||
| Fine Gael | John Noel Carey* | 15.8% | 945 | 1,000 | 1,122 | 1,254 | ||||
| Fianna Fáil | Michael Goonan | 14.05 | 496 | 511 | ||||||
| Independent | Tony Mullarkey | 2.8% | 169 | |||||||
| Independent | Martin Tighe | 0.5% | 29 | |||||||
| Electorate: 9,176 Valid: 5,971 (65.07%) Spoilt: 73 Quota: 1,195 Turnout: 6,044 (65.87%) | ||||||||||
Swinford
| Swinford - 4 seats | ||||||||
|---|---|---|---|---|---|---|---|---|
| Party | Candidate | FPv% | Count 1 | Count 2 | Count 3 | Count 4 | ||
| Fianna Fáil | Jimmy Maloney | 22.1% | 1,423 | |||||
| Fine Gael | John Flannery* | 18.6% | 1,200 | 1,211 | 1,215 | 1,383 | ||
| Fianna Fáil | Paddy Oliver | 15.7% | 1,009 | 1,035 | 1,087 | 1,318 | ||
| Fianna Fáil | Patsy Dunne* | 14.9% | 959 | 967 | 1,006 | 1,040 | ||
| Fine Gael | Sean McEvoy* | 14% | 901 | 924 | 956 | 1,342 | ||
| Fine Gael | Joseph Mellett | 12.9% | 830 | 861 | 868 | |||
| Independent | Tony McDonagh | 1.9% | 121 | |||||
| Electorate: 9,877 Valid: 6,443 (65.23%) Spoilt: 62 Quota: 1,289 Turnout: 6,505 (65.86%) | ||||||||
Westport
| Westport - 5 seats | ||||||||
|---|---|---|---|---|---|---|---|---|
| Party | Candidate | FPv% | Count 1 | Count 2 | Count 3 | Count 4 | ||
| Fine Gael | Michael Ring | 21.1% | 2,063 | |||||
| Fianna Fáil | Martin J. O'TooleTD* | 17.21 | 1,697 | |||||
| Fine Gael | Pat Kilbane* | 16.4% | 1,601 | 1,774 | ||||
| Fianna Fáil | Frank Chambers* | 15.7% | 1,538 | 1,564 | 1,584 | 1,662 | ||
| Fianna Fáil | Seamus Hughes* | 12.7% | 1,244 | 1,364 | 1,410 | 1,576 | ||
| Independent | Denis Gallagher | 10.1% | 989 | 1,007 | 1,035 | 1,130 | ||
| Labour Party | Maurice Rice | 4.4% | 432 | 499 | 558 | |||
| Progressive Democrats | John Joe Kilcoyne | 2.2% | 227 | 254 | ||||
| Electorate: 13,691 Valid: 9,791 (71.5%) Spoilt: 93 Quota: 1,632 Turnout: 9,899 (72.3%) | ||||||||
External links
| Preceded by 1985 Mayo County Council election |
Mayo County Council elections | Succeeded by 1999 Mayo County Council election |
This article is issued from Wikipedia. The text is licensed under Creative Commons - Attribution - Sharealike. Additional terms may apply for the media files.