1991 South Dublin County Council election
An election to South Dublin County Council took place on 27 June 1991 as part of that year's Irish local elections. 26 councillors were elected from five electoral divisions by PR-STV voting for a five-year term of office.
| |||||||||||||||||||||||||||||||||||||||||||||||||||||
All 26 seats to South Dublin County Council | |||||||||||||||||||||||||||||||||||||||||||||||||||||
|---|---|---|---|---|---|---|---|---|---|---|---|---|---|---|---|---|---|---|---|---|---|---|---|---|---|---|---|---|---|---|---|---|---|---|---|---|---|---|---|---|---|---|---|---|---|---|---|---|---|---|---|---|---|
| |||||||||||||||||||||||||||||||||||||||||||||||||||||
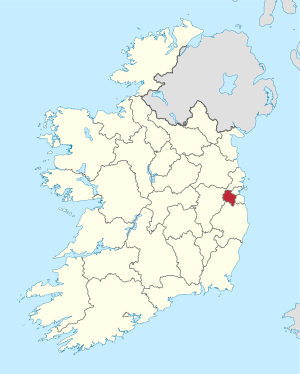 Map showing the area of South Dublin County Council | |||||||||||||||||||||||||||||||||||||||||||||||||||||
| |||||||||||||||||||||||||||||||||||||||||||||||||||||
Results by party
| Party | Seats | ± | First Pref. votes | FPv% | ±% | |
|---|---|---|---|---|---|---|
| Fianna Fáil | 7 | -6 | 16,179 | 29.1% | ||
| Fine Gael | 6 | -2 | 10,176 | 18.3% | ||
| Labour Party | 4 | +2 | 9,796 | 17.6% | ||
| Progressive Democrats | 4 | +4 | 5,080 | 9.1% | ||
| Workers' Party | 3 | +1 | 4,842 | 8.7% | ||
| Green Party | 1 | +1 | 3,294 | 5.9% | ||
| Independent | 1 | - | 4,294 | 7.7% | ||
| Totals | 26 | - | 53,634 | 100% | — | |
Results by Electoral Area
Clondalkin
| Clondalkin - 3 seats | |||||||||||
|---|---|---|---|---|---|---|---|---|---|---|---|
| Party | Candidate | FPv% | Count 1 | Count 2 | Count 3 | Count 4 | Count 5 | Count 6 | Count 7 | ||
| Fine Gael | Therese Ridge* | 18.3% | 1,378 | 1,431 | 1,459 | 1,497 | 1,563 | 1,733 | 1,883 | ||
| Progressive Democrats | Colm Tyndall | 17.7% | 1,332 | 1,355 | 1,375 | 1,447 | 1,544 | 1,647 | 1,863 | ||
| Fianna Fáil | Colm McGrath* | 14.6% | 1,104 | 1,112 | 1,136 | 1,257 | 1,280 | 1,316 | 2,027 | ||
| Fianna Fáil | Catherine Sherwin | 13.1% | 986 | 1,004 | 1,028 | 1,182 | 1,229 | 1,259 | |||
| Workers' Party | Donna Conlon | 8.9% | 671 | 729 | 809 | 813 | 943 | 1,292 | 1,356 | ||
| Labour Party | Robert Dowds | 8.3% | 626 | 679 | 711 | 721 | 794 | ||||
| Fianna Fáil | Pat Smyth | 5.7% | 431 | 436 | 441 | ||||||
| Green Party | Conor Delaney | 5.3% | 400 | 436 | 496 | 518 | |||||
| Sinn Féin | Vincent Coffey | 4.2% | 315 | 340 | |||||||
| Independent | Maurice Duffy | 2.4% | 178 | ||||||||
| Independent | Maire O'Connor | 1.6% | 123 | ||||||||
| Electorate: 20,425 Valid: 7,544 (36.9%) Spoilt: 63 Quota: 1,887 Turnout: 7,607 (37.2%) | |||||||||||
Greenhills
| Greenhills - 4 seats | |||||||||||||
|---|---|---|---|---|---|---|---|---|---|---|---|---|---|
| Party | Candidate | FPv% | Count 1 | Count 2 | Count 3 | Count 4 | Count 5 | Count 6 | Count 7 | Count 8 | Count 9 | ||
| Labour Party | Mervyn TaylorTD* | 24.1% | 1,576 | ||||||||||
| Workers' Party | Don Tipping* | 13.9% | 912 | 966 | 995 | 1,020 | 1,107 | 1,138 | 1,306 | 1,357 | |||
| Fine Gael | Michael Keating | 11% | 720 | 745 | 754 | 875 | 919 | 946 | 1,066 | 1,126 | 1,170 | ||
| Independent | Bob Byrne | 9.3% | 611 | 628 | 645 | 651 | 713 | 736 | |||||
| Fianna Fáil | Geraldine O'Connor | 8.8% | 577 | 584 | 586 | 607 | 626 | 767 | 819 | ||||
| Fianna Fáil | Margaret Farrell | 8.1% | 525 | 537 | 549 | 555 | 580 | 828 | 943 | 1,412 | |||
| Labour Party | Denis Mackin | 8% | 522 | 634 | 648 | 667 | 737 | 755 | 881 | 1,040 | 1,089 | ||
| Fianna Fáil | Michael Hanrahan | 7.2% | 468 | 479 | 505 | 511 | 523 | ||||||
| Green Party | Alison Larkin | 4.6% | 298 | 308 | 345 | 363 | |||||||
| Fine Gael | Michael O'Brien | 3.4% | 224 | 228 | 228 | ||||||||
| Sinn Féin | Dessie Early | 2.4% | 157 | 162 | |||||||||
| Electorate: 16,819 Valid: 6,540 (38.9%) Spoilt: 50 Quota: 1,319 Turnout: 6,590 (39.2%) | |||||||||||||
Lucan
| Lucan - 4 seats | |||||||||||||||
|---|---|---|---|---|---|---|---|---|---|---|---|---|---|---|---|
| Party | Candidate | FPv% | Count 1 | Count 2 | Count 3 | Count 4 | Count 5 | Count 6 | Count 7 | Count 8 | Count 9 | Count 10 | Count 11 | ||
| Independent | Guss O'Connell | 14.2% | 1,406 | 1,477 | 1,532 | 1,649 | 1,894 | 2,032 | |||||||
| Fine Gael | Peter Brady | 13.5% | 1,336 | 1,346 | 1,472 | 1,549 | 1,587 | 1,612 | 1,619 | 1,775 | 1,812 | 1,987 | |||
| Fianna Fáil | Finbarr Hanrahan* | 11.3% | 1,119 | 1,126 | 1,145 | 1,182 | 1,215 | 1,440 | 1,459 | 1,514 | 1,607 | 2,362 | |||
| Fianna Fáil | Liam LawlorTD* | 9.1% | 905 | 910 | 919 | 934 | 950 | 1,110 | 1,123 | 1,173 | 1,246 | ||||
| Labour Party | Eamon Tuffy | 8.3% | 826 | 829 | 834 | 927 | 1,000 | 1,026 | 1,030 | 1,211 | 1,263 | 1,315 | 1,430 | ||
| Sinn Féin | John McCann | 7.9% | 783 | 789 | 797 | 808 | 815 | 828 | 830 | 919 | |||||
| Labour Party | John O'Halloran | 7.8% | 775 | 781 | 795 | 815 | 884 | 898 | 901 | 1,058 | 1,379 | 1,467 | 1,553 | ||
| Workers' Party | Anne Finnegan | 6.7% | 665 | 671 | 677 | 748 | 777 | 799 | 803 | ||||||
| Fianna Fáil | Deirdre Doherty-Ryan | 5.9% | 580 | 591 | 609 | 630 | 675 | ||||||||
| Labour Party | Michael Brennan | 5% | 497 | 534 | 563 | 598 | |||||||||
| Green Party | Bridin O'Connor | 5% | 492 | 512 | 531 | ||||||||||
| Fine Gael | Tom Kavanagh | 3.1% | 311 | 316 | |||||||||||
| Independent | Michael Kirwan | 2% | 200 | ||||||||||||
| Electorate: 20,266 Valid: 9,895 (48.8%) Spoilt: 75 Quota: 1,980 Turnout: 9,970 (49.2%) | |||||||||||||||
Rathfarnam
| Rathfarnam - 4 seats | |||||||||||
|---|---|---|---|---|---|---|---|---|---|---|---|
| Party | Candidate | FPv% | Count 1 | Count 2 | Count 3 | Count 4 | Count 5 | Count 6 | Count 7 | ||
| Fianna Fáil | Ann Ormonde* | 19% | 1,582 | 1,584 | 1,601 | 1,872 | |||||
| Fine Gael | Alan ShatterTD* | 14.3% | 1,191 | 1,202 | 1,241 | 1,286 | 1,303 | 1,538 | 1,671 | ||
| Green Party | Máire Mullarney | 14% | 1,163 | 1,176 | 1,289 | 1,313 | 1,327 | 1,511 | 1,877 | ||
| Fine Gael | Mary Muldoon* | 13.96% | 1,161 | 1,166 | 1,194 | 1,206 | 1,213 | 1,355 | 1,622 | ||
| Fianna Fáil | Damien Fee | 10.4% | 862 | 884 | 897 | 989 | 1,142 | 1,223 | 1,325 | ||
| Independent | Vincent Kenny | 9.1% | 760 | 767 | 832 | 842 | 849 | 944 | |||
| Progressive Democrats | Ronnie McBrien | 8.6% | 719 | 721 | 760 | 778 | 788 | ||||
| Fianna Fáil | Stephen Riney* | 5.8% | 479 | 479 | 485 | ||||||
| Labour Party | Billy Byrne | 2.7% | 227 | 339 | |||||||
| Labour Party | Graham Corcoran | 1.9% | 154 | ||||||||
| Electorate: 20,175 Valid: 8,318 (41.2%) Spoilt: 35 Quota: 1,664 Turnout: 8,353 (41.4%) | |||||||||||
Tallaght-Oldbawn
| Tallaght-Oldbawn - 3 seats | ||||||||||||||
|---|---|---|---|---|---|---|---|---|---|---|---|---|---|---|
| Party | Candidate | FPv% | Count 1 | Count 2 | Count 3 | Count 4 | Count 5 | Count 6 | Count 7 | Count 8 | Count 9 | Count 10 | ||
| Fianna Fáil | John Hannon* | 22.3% | 1,572 | 1,579 | 1,590 | 1,663 | 1,684 | 1,915 | ||||||
| Workers' Party | Pat RabbitteTD* | 13.5% | 947 | 967 | 980 | 994 | 1,066 | 1,102 | 1,125 | 1,255 | 1,472 | 1,736 | ||
| Progressive Democrats | Breda Cass* | 12.7% | 892 | 900 | 916 | 920 | 969 | 998 | 1,021 | 1,062 | 1,131 | 1,501 | ||
| Fine Gael | Senator Larry McMahon* | 11.2% | 789 | 799 | 889 | 912 | 942 | 964 | 988 | 1,009 | 1,083 | |||
| Labour Party | Eamonn Maloney | 9.5% | 667 | 677 | 689 | 703 | 741 | 748 | 756 | 801 | ||||
| Labour Party | Ned Gibbons | 9.4% | 663 | 667 | 673 | 676 | 706 | 762 | 775 | 885 | 1,271 | 1,415 | ||
| Sinn Féin | Seán Crowe | 5.7% | 399 | 436 | 438 | 441 | 461 | 480 | 496 | |||||
| Fianna Fáil | Jim Barry* | 5.5% | 389 | 394 | 395 | 430 | 434 | |||||||
| Green Party | Malachy Murphy | 3.7% | 259 | 271 | 279 | 280 | ||||||||
| Fianna Fáil | Frank Dwan | 2.5% | 178 | 179 | 179 | |||||||||
| Fine Gael | Paul Ringland | 2.2% | 158 | 159 | ||||||||||
| Republican Sinn Féin | Peter Cunningham | 1.8% | 125 | |||||||||||
| Electorate: 14,687 Valid: 6,388 (43.5%) Spoilt: 89 Quota: 1,598 Turnout: 6,477 (44.1%) | ||||||||||||||
Tallaght-Rathcoole
| Tallaght-Rathcoole- 3 seats | |||||||||||||
|---|---|---|---|---|---|---|---|---|---|---|---|---|---|
| Party | Candidate | FPv% | Count 1 | Count 2 | Count 3 | Count 4 | Count 5 | Count 6 | Count 7 | Count 8 | Count 9 | ||
| Workers' Party | Mick Billane | 20.3% | 1217 | 1,228 | 1,264 | 1,306 | 1,368 | 1,488 | 1,554 | ||||
| Fianna Fáil | Charlie O'Connor | 15.4% | 922 | 987 | 996 | 1,019 | 1,144 | 1,182 | 1,216 | 1,220 | 1,656 | ||
| Progressive Democrats | Catherine Quinn | 13.1% | 785 | 786 | 796 | 889 | 934 | 982 | 1,199 | 1,208 | 1,421 | ||
| Fianna Fáil | Jim Daly* | 12.3% | 741 | 757 | 759 | 764 | 783 | 832 | 904 | 914 | |||
| Labour Party | Maria Ingle | 11.6% | 694 | 700 | 712 | 741 | 815 | 886 | 936 | 954 | 1,028 | ||
| Sinn Féin | Tony Flannery | 6.4% | 386 | 390 | 397 | 409 | 429 | ||||||
| Fine Gael | Pat Corcoran | 6.4% | 384 | 388 | 451 | 463 | 484 | 519 | |||||
| Independent | John O'Mahony | 6% | 359 | 363 | 374 | 389 | |||||||
| Progressive Democrats | Martin Smith | 3.7% | 224 | 226 | 248 | ||||||||
| Fine Gael | Jim Lovett | 2.9% | 177 | 178 | |||||||||
| Fianna Fáil | Mary Morton | 1.9% | 114 | ||||||||||
| Electorate: 15,744 Valid: 6,003 (38.1%) Spoilt: 80 Quota: 1,501 Turnout: 6,083 (38.6%) | |||||||||||||
Terenure
| Terenure- 5 seats | ||||||||||||
|---|---|---|---|---|---|---|---|---|---|---|---|---|
| Party | Candidate | FPv% | Count 1 | Count 2 | Count 3 | Count 4 | Count 5 | Count 6 | Count 7 | Count 8 | ||
| Fine Gael | Stanley Laing* | 14.4% | 1,488 | 1,503 | 1,541 | 1,566 | 1,585 | 1,630 | 1,685 | 1,768 | ||
| Labour Party | Eamonn Walsh | 12.4% | 1,278 | 1,382 | 1,384 | 1,527 | 1,625 | 1,656 | 1,678 | 1,845 | ||
| Labour Party | Senator Pat Upton | 11.3% | 1,169 | 1,309 | 1,352 | 1,424 | 1,454 | 1,492 | 1,520 | 1,780 | ||
| Progressive Democrats | Cáit Keane | 10.9% | 1,128 | 1,159 | 1,173 | 1,218 | 1,267 | 1,317 | 1,376 | 1,542 | ||
| Fianna Fáil | Sean Ardagh* | 10.4% | 1,070 | 1,075 | 1,268 | 1,311 | 1,540 | 2,082 | ||||
| Fine Gael | Martin Lynch* | 9.5% | 981 | 992 | 1,014 | 1,037 | 1,051 | 1,081 | 1,096 | 1,163 | ||
| Green Party | Jim Murphy | 6.6% | 682 | 751 | 761 | 851 | 880 | 904 | 940 | |||
| Fianna Fáil | Michael J. Stokes | 5.4% | 555 | 564 | 641 | 675 | 848 | |||||
| Fianna Fáil | Molly Tighe | 5.3% | 550 | 559 | 615 | 671 | ||||||
| Independent | Seamus Ashe* | 5.1% | 532 | 561 | 566 | |||||||
| Fianna Fáil | Gerry Mullally | 4.5% | 470 | 472 | ||||||||
| Workers' Party | Deirdre O'Connell | 4.2% | 430 | |||||||||
| Electorate: 24,148 Valid: 10,333 (42.8%) Spoilt: 85 Quota: 1,723 Turnout: 10,418 (43.1%) | ||||||||||||
External links
| Preceded by 1985 Dublin County Council election |
South Dublin County Council elections | Succeeded by South Dublin County Council election, 1991 |
This article is issued from Wikipedia. The text is licensed under Creative Commons - Attribution - Sharealike. Additional terms may apply for the media files.