Wokingham Borough Council elections
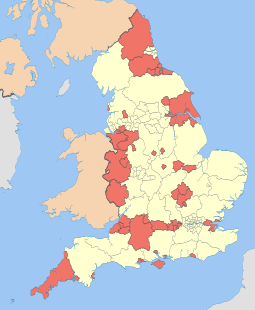
Wokingham is a unitary authority in Berkshire, England. Until 1 April 1998 it was a non-metropolitan district.
Political control
Since the first election to the council in 1973 political control of the council has been held by the following parties:[1][2]
Non-metropolitan district
| Party in control | Years | |
|---|---|---|
| No overall control | 1973-1976 | |
| Conservative | 1976-1995 | |
| No overall control | 1995-1996 | |
| Liberal Democrats | 1996-1998 | |
Unitary authority
| Party in control | Years | |
|---|---|---|
| Conservative | 1997-2000 | |
| No overall control | 2000-2002 | |
| Conservative | 2002–present | |
Council elections
Non-metropolitan district elections
- Wokingham District Council election, 1973
- Wokingham District Council election, 1976
- Wokingham District Council election, 1979 (New ward boundaries)[3]
- Wokingham District Council election, 1980
- Wokingham District Council election, 1982
- Wokingham District Council election, 1983
- Wokingham District Council election, 1984
- Wokingham District Council election, 1986
- Wokingham District Council election, 1987
- Wokingham District Council election, 1988
- Wokingham District Council election, 1990
- Wokingham District Council election, 1991 (District boundary changes took place but the number of seats remained the same)[4]
- Wokingham District Council election, 1992
- Wokingham District Council election, 1994
- Wokingham District Council election, 1995
- Wokingham District Council election, 1996
Unitary authority elections
- Wokingham District Council election, 1997
- Wokingham District Council election, 1999
- Wokingham District Council election, 2000
- Wokingham District Council election, 2001
- Wokingham District Council election, 2002
- Wokingham District Council election, 2003
- Wokingham District Council election, 2004 (New ward boundaries)[5][6][7]
- Wokingham District Council election, 2006
- Wokingham District Council election, 2007
- Wokingham Borough Council election, 2008
- Wokingham Borough Council election, 2010
- Wokingham Borough Council election, 2011
- Wokingham Borough Council election, 2012
- Wokingham Borough Council election, 2014
- Wokingham Borough Council election, 2015
- Wokingham Borough Council election, 2016
- Wokingham Borough Council election, 2018
Borough result maps
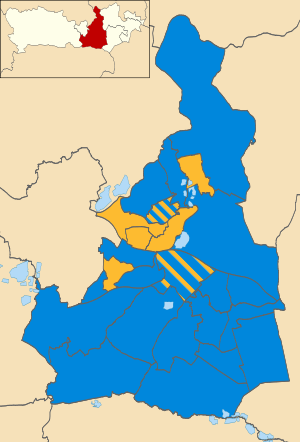
 2004 results map
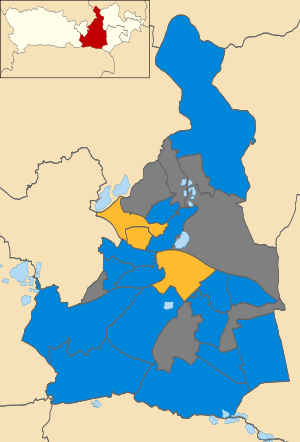
 2006 results map
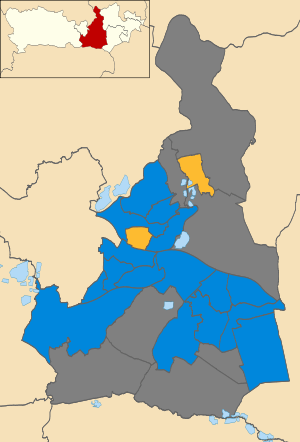
 2007 results map
 2008 results map
 2010 results map
 2011 results map
By-election results
1997–2005
| Party | Candidate | Votes | % | ± | |
|---|---|---|---|---|---|
| Liberal Democrat | 540 | 44.3 | +2.7 | ||
| Labour | 456 | 37.4 | +3.7 | ||
| Conservative | 222 | 18.2 | -6.5 | ||
| Majority | 84 | 6.9 | |||
| Turnout | 1,218 | 39.6 | |||
| Liberal Democrat hold | Swing | ||||
| Party | Candidate | Votes | % | ± | |
|---|---|---|---|---|---|
| Conservative | 303 | 78.1 | -2.8 | ||
| UKIP | 45 | 11.6 | +11.6 | ||
| Liberal Democrat | 40 | 10.3 | -0.8 | ||
| Majority | 258 | 66.5 | |||
| Turnout | 388 | 22.7 | |||
| Conservative hold | Swing | ||||
| Party | Candidate | Votes | % | ± | |
|---|---|---|---|---|---|
| Liberal Democrat | Malcolm Armstrong | 751 | 51.5 | +13.1 | |
| Conservative | 622 | 42.6 | +1.0 | ||
| UKIP | 86 | 5.9 | -8.5 | ||
| Majority | 129 | 8.9 | |||
| Turnout | 1,459 | 24.0 | |||
| Liberal Democrat gain from Conservative | Swing | ||||
| Party | Candidate | Votes | % | ± | |
|---|---|---|---|---|---|
| Conservative | Stuart Munro | 405 | 60.5 | -18.3 | |
| Independent | Max Bowker | 120 | 17.9 | +17.9 | |
| Liberal Democrat | Caroline Smith | 109 | 16.3 | -4.9 | |
| UKIP | Vince Pearson | 35 | 5.2 | +5.2 | |
| Majority | 254 | 42.6 | |||
| Turnout | 669 | ||||
| Conservative hold | Swing | ||||
2005–2009
| Party | Candidate | Votes | % | ± | |
|---|---|---|---|---|---|
| Conservative | Paul Swaddle | 1,027 | 51.0 | +8.6 | |
| Liberal Democrat | Dave Swindells | 835 | 41.5 | +11.5 | |
| Labour | Jacqueline Rupert | 97 | 4.8 | -5.3 | |
| UKIP | David Lamb | 55 | 2.7 | -8.1 | |
| Majority | 192 | 9.5 | |||
| Turnout | 2,014 | 28.2 | |||
| Conservative hold | Swing | ||||
| Party | Candidate | Votes | % | ± | |
|---|---|---|---|---|---|
| Conservative | John Kersley | 913 | 70.6 | -2.9 | |
| Liberal Democrat | Martin Alder | 237 | 18.3 | -0.5 | |
| UKIP | Franklin Carstairs | 83 | 6.4 | +2.5 | |
| Labour | Brian Scott | 60 | 4.6 | +0.8 | |
| Majority | 676 | 52.3 | |||
| Turnout | 1,293 | ||||
| Conservative hold | Swing | ||||
| Party | Candidate | Votes | % | ± | |
|---|---|---|---|---|---|
| Conservative | Katherine Povey | 850 | 53.2 | +0.0 | |
| Liberal Democrat | Coling Lawley | 675 | 42.2 | +4.6 | |
| UKIP | Amy Thornton | 74 | 4.6 | -0.2 | |
| Majority | 175 | 11.0 | |||
| Turnout | 1,599 | ||||
| Conservative hold | Swing | ||||
2009–2013
| Party | Candidate | Votes | % | ± | |
|---|---|---|---|---|---|
| Conservative | David Sleight | 1,809 | 67.3 | -8.9 | |
| Liberal Democrat | David Vaughan | 711 | 26.5 | +13.0 | |
| BNP | Mark Burke | 166 | 6.2 | +6.2 | |
| Majority | 1,098 | 40.8 | |||
| Turnout | 2,686 | 44.5 | |||
| Conservative hold | Swing | ||||
| Party | Candidate | Votes | % | ± | |
|---|---|---|---|---|---|
| Conservative | John Halsall | 850 | 65.9 | +0.6 | |
| Liberal Democrat | Martin Alder | 272 | 21.1 | -7.1 | |
| Labour | Matthew Dent | 94 | 7.3 | +0.7 | |
| UKIP | Andy Heape | 55 | 4.3 | +4.3 | |
| Green | Martyn Foss | 19 | 1.5 | +1.5 | |
| Majority | 578 | 44.8 | |||
| Turnout | 1,290 | 29.4 | |||
| Conservative hold | Swing | ||||
2013-present
| Party | Candidate | Votes | % | ± | |
|---|---|---|---|---|---|
| Liberal Democrat | Imogen Shepherd-DuBey | 1,575 | 59.7 | +22.6 | |
| Conservative | Kevin Morgan | 879 | 33.3 | -4.2 | |
| UKIP | Phil Ray | 104 | 3.9 | -11.5 | |
| Labour | Christopher Everett | 79 | 3.0 | -6.9 | |
| Majority | 696 | 26.4 | |||
| Turnout | 2,637 | 39.7 | –3.4 | ||
| Liberal Democrat gain from Conservative | Swing | ||||
References
- ↑ "Council compositions". The Elections Centre. Retrieved 3 May 2016.
- ↑ "Wokingham". BBC News Online. 19 April 2008. Retrieved 9 January 2010.
- ↑ The District of Wokingham (Electoral Arrangements) Order 1978
- ↑ legislation.gov.uk - The Berkshire, Buckinghamshire, Hampshire, Oxfordshire and Surrey (County Boundaries) Order 1991. Retrieved on 5 November 2015.
- ↑ legislation.gov.uk - The District of Wokingham (Electoral Changes) Order 2002. Retrieved on 4 October 2015.
- ↑ "Wokingham council". BBC News Online. Retrieved 9 January 2010.
- ↑ "Decision making and structure". Wokingham Borough Council. Retrieved 9 January 2010.
- ↑ "Tories inch ahead". London: guardian.co.uk. 9 November 2001. Retrieved 9 January 2010.
- ↑ "Tories suffer triple defeat". London: guardian.co.uk. 26 November 2004. Retrieved 9 January 2010.
- ↑ "Tories claim clean sweep in council byelections". London: guardian.co.uk. 4 November 2005. Retrieved 9 January 2010.
- ↑ "Election results for Remenham, Wargrave and Ruscombe by-election". Wokingham Borough Council. Retrieved 9 January 2010.
- ↑ "Woodley by-election results". Wokingham Borough Council. Retrieved 9 January 2010.
- ↑ "Election results for Wokingham Without Ward by-election 4 June 2009". Wokingham Borough Council. Retrieved 9 January 2010.
- ↑ "Tories seal comfortable by-election victory". Reading Chronicle. 22 July 2011. Retrieved 22 July 2011.
- ↑ "Election results for Emmbrook, 17 February 2017". Wokingham Borough Council. Retrieved 19 February 2017.
External links
This article is issued from
Wikipedia.
The text is licensed under Creative Commons - Attribution - Sharealike.
Additional terms may apply for the media files.
