Southampton City Council elections are held three out of every four years to elect members of Southampton City Council, the local authority for the city of Southampton in Hampshire, England. Since 1 April 1997 Southampton has been a unitary authority responsible for all local government functions; prior to this it was a non-metropolitan district beneath Hampshire County Council.
Southampton City Council is made up of 48 councillors, with three councillors representing each of 16 wards. One councillor from each ward is elected each May on a four-year cycle, with no elections in the fourth year.[1]
Political control
Since the first election to the council in 1973 political control of the council has been held by the following parties:[2][3]
Non-metropolitan district
Unitary authority
Council elections
Non-metropolitan district elections
- Southampton City Council election, 1973
- Southampton City Council election, 1976
- Southampton City Council election, 1979 (New ward boundaries & city boundary changes also took place)[4][5]
- Southampton City Council election, 1980
- Southampton City Council election, 1982
- Southampton City Council election, 1983
- Southampton City Council election, 1984
- Southampton City Council election, 1986
- Southampton City Council election, 1987
- Southampton City Council election, 1988
- Southampton City Council election, 1990
- Southampton City Council election, 1991
- Southampton City Council election, 1992
- Southampton City Council election, 1994
- Southampton City Council election, 1995
Unitary authority elections
- Southampton City Council election, 1996
- Southampton City Council election, 1998
- Southampton City Council election, 1999
- Southampton City Council election, 2000
- Southampton City Council election, 2002 (New ward boundaries increased the number of seats by 3)[6][7][8]
- Southampton City Council election, 2003
- Southampton City Council election, 2004
- Southampton City Council election, 2006
- Southampton City Council election, 2007
- Southampton City Council election, 2008
- Southampton City Council election, 2010
- Southampton City Council election, 2011
- Southampton City Council election, 2012
- Southampton City Council election, 2014
- Southampton City Council election, 2015
- Southampton City Council election, 2016
- Southampton City Council election, 2018
External links
|
|---|
| Districts | | |
|---|
| Councils | |
|---|
| Local elections | |
|---|
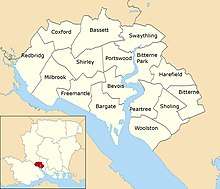 Ward boundaries used since 2002
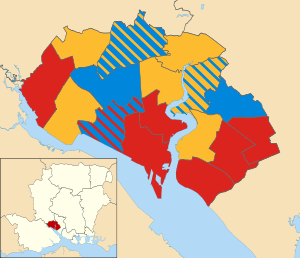 2002 results map
 2003 results map
 2004 results map
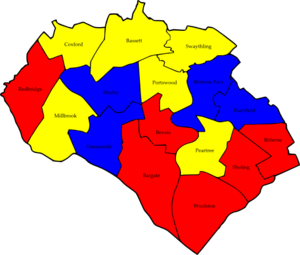 2006 results map
 2007 results map
 2008 results map
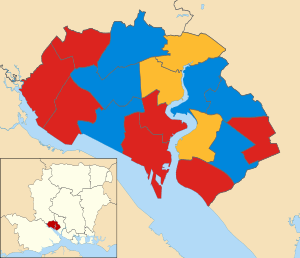 2010 results map
 2011 results map
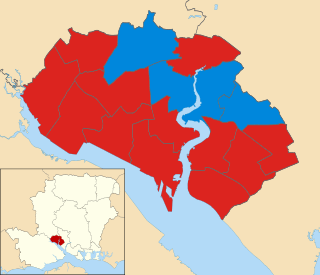 2012 results map
 2014 results map
 2015 results map
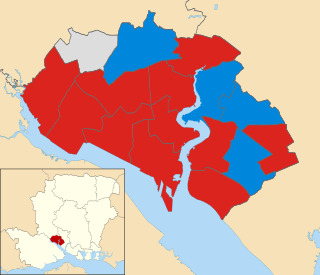 2016 results map
 2018 results map