Hull City Council elections
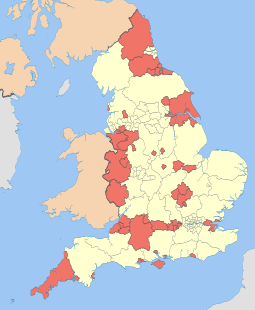
Kingston upon Hull is a unitary authority in the East Riding of Yorkshire, England. Until 1 April 1996 it was a non-metropolitan district in Humberside. A third of the Council is elected each year with no election every four years. Since the boundary changes in 2002 until 2018, 59 councillors are elected from 23 wards with each ward electing either 2 or 3 councillors.[1] Following a review, in 2017, by the Local Government Boundary Commission this was reduced to 57 councillors from 21 wards effective from the 2018 elections.[2]
Due to boundary changes every ward and every council seat were up for election on 3 May 2018, new wards "East Carr" and "West Carr" replace East Bransholme and West Bransholme and include part of Sutton Park estate too. Labour, Lib Dems and Conservatives are standing candidates for every seat, Green Party have 9 standing and UKIP only two.[3]
Political control
Since the first election to the council in 1973 political control of the council has been held by the following parties:[4][5]
Non-metropolitan district
| Party in control | Years | |
|---|---|---|
| Labour | 1973–1996 | |
Unitary authority
| Party in control | Years | |
|---|---|---|
| Labour | 1995–2002 | |
| No overall control | 2002–2007 | |
| Liberal Democrats | 2007–2011 | |
| Labour | 2011–present | |
Council elections
Non-metropolitan district elections
- Hull City Council election, 1973
- Hull City Council election, 1976
- Hull City Council election, 1979
- Hull City Council election, 1983 (New ward boundaries)[6]
- Hull City Council election, 1984
- Hull City Council election, 1986
- Hull City Council election, 1987
- Hull City Council election, 1988
- Hull City Council election, 1990
- Hull City Council election, 1991
- Hull City Council election, 1992
- Hull City Council election, 1994
Unitary authority elections
- Hull City Council election, 1995
- Hull City Council election, 1998
- Hull City Council election, 1999
- Hull City Council election, 2000
- Hull City Council election, 2002 (New ward boundaries reduced the number of seats by one)[1][7][8]
- Hull City Council election, 2003
- Hull City Council election, 2004
- Hull City Council election, 2006
- Hull City Council election, 2007
- Hull City Council election, 2008
- Hull City Council election, 2010
- Hull City Council election, 2011
- Hull City Council election, 2012
- Hull City Council election, 2014
- Hull City Council election, 2015
- Hull City Council election, 2016
- Hull City Council election, 2018 (New ward boundaries reduced the number of seats by two)[9]
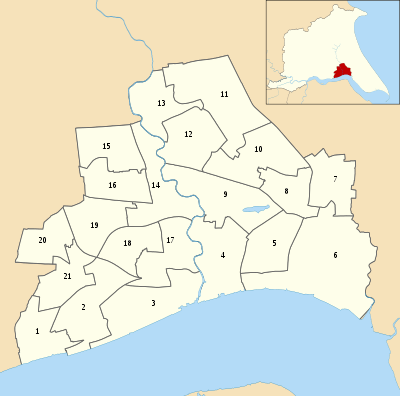
Wards
2002–2018

| Ward | Area | Map | No. Councillors |
|---|---|---|---|
| Avenue | Wyke | 19 | 3 |
| Beverley | Northern | 15 | 2 |
| Boothferry | West | 22 | 3 |
| Bransholme East | North Carr | 12 | 2 |
| Bransholme West | North Carr | 13 | 2 |
| Bricknell | Wyke | 20 | 2 |
| Derringham | West | 21 | 3 |
| Drypool | Riverside | 4 | 3 |
| Holderness | Park | 10 | 3 |
| Ings | East | 9 | 3 |
| Kings Park | North Carr | 14 | 2 |
| Longhill | East | 8 | 3 |
| Marfleet | Park | 5 | 3 |
| Myton | Riverside | 3 | 3 |
| Newington | Riverside | 23 | 3 |
| Newland | Wyke | 18 | 2 |
| Orchard Park & Greenwood | Northern | 16 | 3 |
| Pickering | West | 1 | 3 |
| Southcoates East | Park | 7 | 2 |
| Southcoates West | Park | 6 | 2 |
| St Andrews | Riverside | 2 | 2 |
| Sutton | East | 11 | 3 |
| University | Northern | 17 | 2 |
2002–2018
| Ward | Map | No. Councillors |
|---|---|---|
| Avenue | 18 | 3 |
| Beverley and Newland | 14 | 3 |
| Boothferry | 21 | 3 |
| Bricknell | 19 | 2 |
| Central | 17 | 2 |
| Derringham | 20 | 3 |
| Drypool | 4 | 3 |
| Holderness | 9 | 3 |
| Ings | 8 | 2 |
| Kingswood | 13 | 2 |
| Longhill and Bilton Grange | 7 | 3 |
| Marfleet | 6 | 3 |
| Newington and Gipsyville | 2 | 3 |
| North Carr | 11 | 3 |
| Orchard Park | 15 | 3 |
| Pickering | 1 | 2 |
| Southcoates | 5 | 3 |
| St Andrews and Docklands | 3 | 3 |
| Sutton | 10 | 3 |
| University | 16 | 2 |
| West Carr | 12 | 3 |
By-election results
1997–2004
| Party | Candidate | Votes | % | ± | |
|---|---|---|---|---|---|
| Labour | 1,422 | 48.0 | |||
| Liberal Democrat | 1,329 | 45.0 | |||
| Conservative | 157 | 5.0 | |||
| Independent Labour | 42 | 2.0 | |||
| Majority | 93 | 3.0 | |||
| Turnout | 2,950 | 29.5 | |||
| Labour hold | Swing | ||||
| Party | Candidate | Votes | % | ± | |
|---|---|---|---|---|---|
| Labour | 730 | 56.2 | -6.7 | ||
| Liberal Democrat | 370 | 28.5 | +11.2 | ||
| Conservative | 156 | 12.0 | -7.8 | ||
| Majority | 360 | 27.7 | |||
| Turnout | 1,256 | 14.5 | |||
| Labour hold | Swing | ||||
| Party | Candidate | Votes | % | ± | |
|---|---|---|---|---|---|
| Labour | 701 | 40.8 | -17.0 | ||
| Liberal Democrat | 644 | 37.5 | +23.3 | ||
| Conservative | 279 | 16.2 | -4.1 | ||
| Independent Labour | 76 | 4.4 | -3.2 | ||
| Socialist Labour | 18 | 1.0 | +1.0 | ||
| Majority | 57 | 3.3 | |||
| Turnout | 1,718 | 21.0 | |||
| Labour hold | Swing | ||||
| Party | Candidate | Votes | % | ± | |
|---|---|---|---|---|---|
| Labour | Sean Chaytor | 1,026 | 57.0 | -14.2 | |
| Liberal Democrat | 705 | 39.1 | +10.3 | ||
| Conservative | 47 | 2.6 | +2.6 | ||
| UKIP | 23 | 1.3 | +1.3 | ||
| Majority | 321 | 17.9 | |||
| Turnout | 1,801 | 20.2 | |||
| Labour hold | Swing | ||||
2005–present
| Party | Candidate | Votes | % | ± | |
|---|---|---|---|---|---|
| Liberal Democrat | Michael Rouse-Deane | 927 | 38.7 | +29.7 | |
| Independent | John Considine | 679 | 28.3 | -0.1 | |
| Labour | Alan Gardiner | 353 | 14.7 | -11.1 | |
| UKIP | John Cornforth | 320 | 13.4 | -15.1 | |
| BNP | Paul Buckley | 116 | 4.8 | ||
| Majority | 248 | 10.4 | |||
| Turnout | 2,395 | 27.0 | |||
| Liberal Democrat gain from UKIP | Swing | ||||
| Party | Candidate | Votes | % | ± | |
|---|---|---|---|---|---|
| Liberal Democrat | Joyce Korczak | 1,375 | 64.5 | +5.0 | |
| Labour | Andrew Whiting | 382 | 17.9 | -5.7 | |
| Conservative | Alec Dear | 187 | 8.8 | -8.2 | |
| BNP | 76 | 3.6 | +3.6 | ||
| Liberal | 57 | 2.7 | +2.7 | ||
| Independent | 42 | 2.0 | +2.0 | ||
| Veritas | 13 | 0.6 | +0.6 | ||
| Majority | 993 | 46.6 | |||
| Turnout | 2,132 | ||||
| Liberal Democrat hold | Swing | ||||
| Party | Candidate | Votes | % | ± | |
|---|---|---|---|---|---|
| Liberal Democrat | Linda Chambers | 1,306 | 52.3 | -11.6 | |
| Labour | Gary Wareing | 891 | 35.7 | +7.9 | |
| National Front | Mike Cooper | 184 | 7.4 | +7.4 | |
| Conservative | Andrew Allison | 117 | 4.7 | -3.7 | |
| Majority | 415 | 16.61 | |||
| Turnout | 2,498 | 26.70 | |||
| Liberal Democrat gain from Conservative | Swing | ||||
References
- 1 2 "Councillors and wards". Hull City Council. Retrieved 19 August 2009.
- ↑ "Ward Boundary Changes". Hull City Council. Retrieved 6 June 2018.
- ↑ Young, Angus (7 April 2018). "Find out who is standing to become a Hull councillor in your area". Hull Daily Mail. Retrieved 15 April 2018.
- ↑ "Council compositions". The Elections Centre. Retrieved 3 May 2016.
- ↑ "Kingston-Upon-Hull". BBC News Online. BBC. 19 April 2008. Retrieved 25 October 2009.
- ↑ The City of Kingston upon Hull (Electoral Arrangements) Order 1979
- ↑ "The City of Kingston upon Hull (Electoral Changes) Order 2001". legislation.gov.uk. Retrieved 4 October 2015.
- ↑ "Kingston-upon-Hull". BBC News Online. BBC. Retrieved 19 August 2009.
- ↑ "Ward Boundary Changes". www.hull.gov.uk. Hull City Council. Retrieved 7 June 2018.
- ↑ "Labour makes only gain". The Guardian. 15 November 2002. Retrieved 20 August 2009.
- ↑ "Surprise Lib Dem victory in election re-run". Yorkshire Post. 14 January 2005. p. 1. Retrieved 20 August 2009.
- ↑ "Lib Dems retain city council seat". BBC News Online. BBC. 14 October 2005. Retrieved 20 November 2011.
- ↑ "Tories lose city council election". BBC News Online. BBC. 9 January 2009. Retrieved 9 January 2009.
External links
| East Riding of Yorkshire Council | |
|---|---|
| Hull City Council | |
| Humberside County Council |
|
| Boothferry Borough Council |
|
| East Yorkshire Borough of Beverley Council |
|
| East Yorkshire District Council |
|
| Holderness Borough Council |
|
| East Riding County Council |
|
| |