United States House of Representatives elections, 1998
|
| |||||||||||||||||||||||||||||||||||||||||||||||||||||||||||
| |||||||||||||||||||||||||||||||||||||||||||||||||||||||||||
All 435 seats in the U.S. House of Representatives 218 seats needed for a majority | |||||||||||||||||||||||||||||||||||||||||||||||||||||||||||
|---|---|---|---|---|---|---|---|---|---|---|---|---|---|---|---|---|---|---|---|---|---|---|---|---|---|---|---|---|---|---|---|---|---|---|---|---|---|---|---|---|---|---|---|---|---|---|---|---|---|---|---|---|---|---|---|---|---|---|---|
| |||||||||||||||||||||||||||||||||||||||||||||||||||||||||||
 Democratic hold Republican hold Democratic gain Republican gain Independent gain | |||||||||||||||||||||||||||||||||||||||||||||||||||||||||||
| |||||||||||||||||||||||||||||||||||||||||||||||||||||||||||
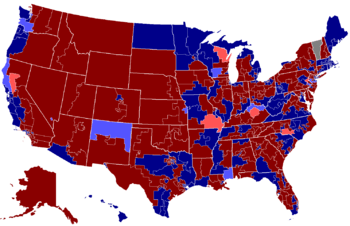
The 1998 United States House of Representatives elections were part of the midterm elections held during President Bill Clinton's second term. They were a major disappointment to the Republicans, who were expecting to gain seats due to the embarrassment Clinton suffered during the Monica Lewinsky scandal, and the "six-year itch" effect observed in most second-term midterm elections. However, the Republicans lost five seats to the Democrats, but retained a narrow majority in the House. A wave of Republican discontent with Speaker Newt Gingrich prompted him to resign shortly after the election; he was replaced by Congressman Dennis Hastert of Illinois.
The campaign was marked by Republican attacks on the morality of President Bill Clinton, with Independent Counsel Kenneth Starr having released his report on the Lewinsky scandal and House leaders having initiated an inquiry into whether impeachable offenses had occurred. However, exit polls indicated that most voters opposed impeaching Clinton, and predictions of high Republican or low Democratic turnout due to the scandal failed to materialize.[1] Some speculate that the losses reflected a backlash against the Republicans for attacking the popular President Clinton. With the Republicans having lost 4 House seats and failing to gain any seats in the Senate, it was the first time since 1934 that the non-presidential party failed to gain congressional seats in a mid-term election. This status quo election was also due to the strong and growing economy due to the Dot Com Bubble. It was also the first time since 1822 that the non-presidential party had failed to gain seats in the mid-term election of a President's second term.
Seats picked up by the Democrats included Kansas's 3rd district, Nevada's 1st district, Pennsylvania's 13th district, New Mexico's 3rd district, New Jersey's 12th district, Kentucky's 4th district, Mississippi's 4th district, California's 1st district, Wisconsin's 2nd district, Washington's 1st district, and Washington's 3rd district. The Republicans, however, picked up seats in Kentucky's 6th district, Wisconsin's 8th district, California's 3rd district, California's 36th district, Pennsylvania's 15th district, and North Carolina's 8th district.
Overall results
| 223 | 1 | 211 |
| Republican | I | Democratic |
| Party | Seats | Seat percentage |
Vote percentage |
Popular vote | ||||
|---|---|---|---|---|---|---|---|---|
| 1996 | Elected | Net Change | ||||||
| Republican Party | 227 | 223 | 51.3% | 48.4% | 32,237,964 | |||
| Democratic Party | 206 | 211 | 48.5% | 47.3% | 31,490,298 | |||
| Libertarian Party | 0 | 0 | 0.0% | 1.3% | 880,024 | |||
| Independent | 2 | 1 | 0.2% | 0.6% | 372,072 | |||
| Reform Party | 0 | 0 | 0.0% | 0.4% | 239,173 | |||
| Natural Law Party | 0 | 0 | 0.0% | 0.3% | 195,015 | |||
| U.S. Taxpayers' Party | 0 | 0 | 0.0% | 0.1% | 73,983 | |||
| Green Party | 0 | 0 | 0.0% | 0.1% | 70,932 | |||
| Conservative Party | 0 | 0 | 0.0% | 0.1% | 57,775 | |||
| Right to Life Party | 0 | 0 | 0.0% | 0.1% | 52,356 | |||
| Independent American Party | 0 | 0 | 0.0% | 0.1% | 45,206 | |||
| American Heritage Party | 0 | 0 | 0.0% | <0.1% | 23,510 | |||
| Socialist Party | 0 | 0 | 0.0% | <0.1% | 19,268 | |||
| Socialist Workers Party | 0 | 0 | 0.0% | <0.1% | 17,470 | |||
| Peace and Freedom Party | 0 | 0 | 0.0% | <0.1% | 14,070 | |||
| Liberal Party | 0 | 0 | 0.0% | <0.1% | 12,490 | |||
| Marijuana Party | 0 | 0 | 0.0% | <0.1% | 5,839 | |||
| Grassroots Party | 0 | 0 | 0.0% | <0.1% | 3,464 | |||
| Term Limits Party | 0 | 0 | 0.0% | <0.1% | 3,045 | |||
| Liberty Union Party | 0 | 0 | 0.0% | <0.1% | 2,153 | |||
| Anti-Federalist Party | 0 | 0 | 0.0% | <0.1% | 1,561 | |||
| American Freedom Party | 0 | 0 | 0.0% | <0.1% | 1,046 | |||
| Patriot Party | 0 | 0 | 0.0% | <0.1% | 950 | |||
| Fusion Party | 0 | 0 | 0.0% | <0.1% | 320 | |||
| Others | 0 | 0 | 0.0% | 1.2% | 775,818 | |||
| Totals | 435 | 435 | 100.0% | 100.0% | 66,604,802 | |||
| Source: Election Statistics - Office of the Clerk | ||||||||
|
[[File:106 us house membership.png|thumb|450px|
|
[[File:106 us house changes.png|thumb|450px|
| ||||||||||||||||||
Incumbent retirements
Democrats
- California 3: Vic Fazio
- California 34: Esteban Edward Torres
- California 36: Jane Harman: To run for Governor
- Colorado 2: David Skaggs
- Connecticut 1: Barbara Kennelly: To run for Governor
- Illinois 9: Sidney Yates
- Illinois 19: Glenn Poshard: To run for Governor
- Indiana 9: Lee H. Hamilton
- Kentucky 6: Scotty Baesler: To run for U.S. Senate
- Massachusetts 8: Joseph P. Kennedy II
- New York 7: Thomas J. Manton
- New York 9: Charles Schumer: To run for U.S. Senate
- North Carolina 8: Bill Hefner
- Ohio 11: Louis Stokes
- Oregon 1: Elizabeth Furse
- Pennsylvania 15: Paul McHale
- Texas 20: Henry Gonzalez
Republicans
- California 1: Frank Riggs: To run for U.S. Senate
- Colorado 6: Daniel Schaefer
- Idaho 2: Mike Crapo: To run for U.S. Senate
- Illinois 13: Harris Fawell
- Kentucky 4: Jim Bunning: To run for U.S. Senate
- Mississippi 4: Mike Parker: To run for Governor
- Nebraska 2: Jon L. Christensen: To run for Governor
- Nevada 1: John Ensign: To run for U.S. Senate
- New York 22: Gerald B.H. Solomon
- New York 27: Bill Paxon
- Oregon 2: Robert Freeman Smith
- Pennsylvania 10: Joe McDade
- South Carolina 4: Bob Inglis: To run for U.S. Senate
- Washington 3: Linda Smith: To run for U.S. Senate
- Wisconsin 1: Mark Neumann: To run for U.S. Senate
- Wisconsin 2: Scott Klug
Incumbents defeated
In primary elections
Republicans who lost to a Republican challenger
- California 41: Jay Kim lost to Gary Miller who later won the general election
In the general election
Democrats who lost to a Republican challenger
- Wisconsin 8: Jay W. Johnson lost to Mark Green
Republicans who lost to a Democratic challenger
- Kansas 3: Vince Snowbarger lost to Dennis Moore
- New Jersey 12: Mike Pappas lost to Rush D. Holt Jr.
- New Mexico 3: Bill Redmond lost to Tom Udall
- Pennsylvania 13: Jon D. Fox lost to Joe Hoeffel
- Washington 1: Rick White lost to Jay Inslee
Special elections
| District | Incumbent | Party | First elected |
Results | Candidates |
|---|---|---|---|---|---|
| New York 6 | Floyd Flake | Democratic | [Data unknown/missing.] | Incumbent resigned November 17, 1997 to work at his church full-time. New member elected February 3, 1998. Democratic hold. Winner was subsequently re-elected in November. |
√ Gregory W. Meeks (Democratic) [Data unknown/missing.] |
| California 22 | Walter Capps | Democratic | [Data unknown/missing.] | Incumbent died October 28, 1997. New member elected March 10, 1998. Democratic hold. Winner was subsequently re-elected in November. |
√ Lois Capps (Democratic) [Data unknown/missing.] |
| California 9 | Ron Dellums | Democratic | [Data unknown/missing.] | Incumbent resigned February 6, 1998. New member elected April 7, 1998. Democratic hold. Winner was subsequently re-elected in November. |
√ Barbara Lee (Democratic) [Data unknown/missing.] |
| California 44 | Sonny Bono | Republican | [Data unknown/missing.] | Incumbent died January 5, 1998. New member elected April 7, 1998. Republican hold. Winner was subsequently re-elected in November. |
√ Mary Bono (Republican) [Data unknown/missing.] |
| Pennsylvania 1 | Thomas M. Foglietta | Democratic | [Data unknown/missing.] | Incumbent resigned November 11, 1997, to become U.S. Ambassador to Italy. New member elected May 19, 1998. Democratic hold. Winner was subsequently re-elected in November. |
√ Bob Brady (Democratic) [Data unknown/missing.] |
| New Mexico 1 | Steven Schiff | Republican | [Data unknown/missing.] | Incumbent died March 25, 1998. New member elected June 23, 1998. Republican hold. Winner was subsequently re-elected in November. |
√ Heather Wilson (Republican) [Data unknown/missing.] |
Alabama
| District | Incumbent | Party | First elected |
Results | Candidates |
|---|---|---|---|---|---|
| Alabama 1 | Sonny Callahan | Republican | 1984 | Incumbent re-elected. | √ Sonny Callahan (Republican) Unopposed |
| Alabama 2 | Terry Everett | Republican | 1992 | Incumbent re-elected. | √ Terry Everett (Republican) 69% Joe Fondren (Democratic) 31% |
| Alabama 3 | Bob Riley | Republican | 1996 | Incumbent re-elected. | √ Bob Riley (Republican) 58% Joe Turnham (Democratic) 42% |
| Alabama 4 | Robert Aderholt | Republican | 1996 | Incumbent re-elected. | √ Robert Aderholt (Republican) 56% Don Bevill (Democratic) 44% |
| Alabama 5 | Robert E. Cramer | Democratic | 1990 | Incumbent re-elected. | √ Robert E. Cramer (Democratic) 70% Gil Aust (Republican) 30% |
| Alabama 6 | Spencer Bachus | Republican | 1992 | Incumbent re-elected. | √ Spencer Bachus (Republican) 72% Donna Wesson Smalley (Democratic) 28% |
| Alabama 7 | Earl Hilliard | Democratic | 1992 | Incumbent re-elected. | √ Earl Hilliard (Democratic) Unopposed |
Alaska
| District | Incumbent | Party | First elected |
Results | Candidates |
|---|---|---|---|---|---|
| Alaska at-large | Don Young | Republican | 1972 | Incumbent re-elected. | √ Don Young (Republican) 62.6% Jim Duncan (Democratic) 34.6% John Grames (Green) 2.7% |
Arizona
| District | Incumbent | Party | First elected |
Results | Candidates |
|---|---|---|---|---|---|
| Arizona 1 | Matt Salmon | Republican | 1994 | Incumbent re-elected. | √ Matt Salmon (Republican) 64% David Mendoza (Democratic) 36% |
| Arizona 2 | Ed Pastor | Democratic | 1990 | Incumbent re-elected. | √ Ed Pastor (Democratic) 67.8% Edward Barron (Republican) 28% Rick Duncan (Libertarian) 3.1% Gregory R. Schultz (Reform) 1.1% |
| Arizona 3 | Bob Stump | Republican | 1976 | Incumbent re-elected. | √ Bob Stump (Republican) 67% Stuart Starky (Democratic) 33% |
| Arizona 4 | John Shadegg | Republican | 1994 | Incumbent re-elected. | √ John Shadegg (Republican) 64.7% Eric Ehst (Democratic) 31.2% Ernest Hancock (Libertarian) 2.4% Doug Quelland (Independent) 1.7% |
| Arizona 5 | Jim Kolbe | Republican | 1984 | Incumbent re-elected. | √ Jim Kolbe (Republican) 51.6% Thomas Volgy (Democratic) 45.2% Phil Murphy (Libertarian) 2.5% Robert Connery Sr. (Reform) 0.8% |
| Arizona 6 | J. D. Hayworth | Republican | 1994 | Incumbent re-elected. | √ J. D. Hayworth (Republican) 53% Steve Owens (Democratic) 43.7% Robert Anderson (Libertarian) 3.3% |
Arkansas
| District | Incumbent | Party | First elected |
Results | Candidates |
|---|---|---|---|---|---|
| Arkansas 1 | Marion Berry | Democratic | 1996 | Incumbent re-elected. | √ Marion Berry (Democratic) Unopposed |
| Arkansas 2 | Vic Snyder | Democratic | 1996 | Incumbent re-elected. | √ Vic Snyder (Democratic) 58% Phil Wyrick (Republican) 42% |
| Arkansas 3 | Asa Hutchinson | Republican | 1996 | Incumbent re-elected. | √ Asa Hutchinson (Republican) 80.7% Ralph Forbes (Reform) 19.3% |
| Arkansas 4 | Jay Dickey | Republican | 1992 | Incumbent re-elected. | √ Jay Dickey (Republican) 57.5% Judy Smith (Democratic) 42.5% |
California
| District | Incumbent | Party | First elected |
Results | Candidates |
|---|---|---|---|---|---|
| California 1 | Frank Riggs | Republican | 1990/1994 | Incumbent retired to run for U.S. Senator. New member elected. Democratic gain. |
√ Mike Thompson (Democratic) 61.9% Mark Luce (Republican) 32.8% Emil Rossi (Libertarian) 2.8% Ernest K. Jones (Peace and Freedom) 2.5% |
| California 2 | Wally Herger | Republican | 1988 | Incumbent re-elected. | √ Wally Herger (Republican) 62.5% Roberts Braden (Democratic) 34.5% Patrice Thiessen (Natural Law) 3% |
| California 3 | Vic Fazio | Democratic | 1978 | Incumbent retired. New member elected. Republican gain. |
√ Doug Ose (Republican) 52.4% Sandra Dunn (Democratic) 45% Ross Crain (Libertarian) 2.6% |
| California 4 | John Doolittle | Republican | 1990 | Incumbent re-elected. | √ John Doolittle (Republican) 62.6% David Shapiro (Democratic) 34.4% Dan Winterrowd (Libertarian) 3% |
| California 5 | Bob Matsui | Democratic | 1978 | Incumbent re-elected. | √ Bob Matsui (Democratic) 71.9% Robert Dinsmore (Republican) 26% Arthur Tuma (Libertarian) 2.1% |
| California 6 | Lynn Woolsey | Democratic | 1992 | Incumbent re-elected. | √ Lynn Woolsey (Democratic) 68% Ken McAuliffe (Republican) 29.7% Alan R Barreca (Natural Law) 2.3% |
| California 7 | George Miller | Democratic | 1974 | Incumbent re-elected. | √ George Miller (Democratic) 77% Norman Reece (Republican) 23% |
| California 8 | Nancy Pelosi | Democratic | 1987 | Incumbent re-elected. | √ Nancy Pelosi (Democratic) 85.8% David Martz (Republican) 12% David Smithstein (Natural Law) 2.1% |
| California 9 | Barbara Lee | Democratic | April 7, 1998 (special) |
Incumbent re-elected. | √ Barbara Lee (Democratic) 82.8% Claiborne Sanders (Republican) 13.2% Gerald Sanders (Peace and Freedom) 2.8% Walter Ruehling (Natural Law) 1.2% |
| California 10 | Ellen Tauscher | Democratic | 1996 | Incumbent re-elected. | √ Ellen Tauscher (Democratic) 53.5% Charles Ball (Republican) 43.4% Valerie Janlois (Natural Law) 1.7% John Place (Reform) 1.4% |
| California 11 | Richard Pombo | Republican | 1992 | Incumbent re-elected. | √ Richard Pombo (Republican) 61.4% Robert Figueroa (Democratic) 36.3% Jesse Baird (Libertarian) 2.3% |
| California 12 | Tom Lantos | Democratic | 1980 | Incumbent re-elected. | √ Tom Lantos (Democratic) 74% Robert Evans (Republican) 21.1% Michael Moloney (Libertarian) 4.9% |
| California 13 | Pete Stark | Democratic | 1972 | Incumbent re-elected. | √ Pete Stark (Democratic) 71.2% James Goetz (Republican) 26.7% Karnig Beylikjian (Natural Law) 2.2% |
| California 14 | Anna Eshoo | Democratic | 1992 | Incumbent re-elected. | √ Anna Eshoo (Democratic) 68.6% Chris Haugen (Republican) 28.4% Joseph Dehn III (Libertarian) 1.7% |
| California 15 | Tom Campbell | Republican | 1988/1995 | Incumbent re-elected. | √ Tom Campbell (Republican) 60.5% Dick Lane (Democratic) 37.9% Frank Strutner (Natural Law) 1.5% |
| California 16 | Zoe Lofgren | Democratic | 1994 | Incumbent re-elected. | √ Zoe Lofgren (Democratic) 72.8% H.E. Thayn (Republican) 23.4% John H Black (Natural Law) 3.8% |
| California 17 | Sam Farr | Democratic | 1993 | Incumbent re-elected. | √ Sam Farr (Democratic) 64.5% Bill McCampbell (Republican) 32.7% Rick Garrett (Libertarian) 1.7% Scott Harley (Natural Law) 1% |
| California 18 | Gary Condit | Democratic | 1989 | Incumbent re-elected. | √ Gary Condit (Democratic) 86.7% Linda Degroat (Libertarian) 13.2% |
| California 19 | George Radanovich | Republican | 1996 | Incumbent re-elected. | √ George Radanovich (Republican) 79.4% Johnathan Richter (Libertarian) 20.6% |
| California 20 | Cal Dooley | Democratic | 1990 | Incumbent re-elected. | √ Cal Dooley (Democratic) 60.7% Cliff Unruh (Republican) 39.3% |
| California 21 | Bill Thomas | Republican | 1978 | Incumbent re-elected. | √ Bill Thomas (Republican) 78.9% John Evans (Reform) 21% |
| California 22 | Lois Capps | Democratic | March 10, 1998 (special) |
Incumbent re-elected. | √ Lois Capps (Democratic) 55% Thomas Bordonaro (Republican) 43% Robert Bakhaus (Libertarian) 1.3% Richard Porter (Reform) 0.6% |
| California 23 | Elton Gallegly | Republican | 1986 | Incumbent re-elected. | √ Elton Gallegly (Republican) 60% Daniel Gonzalez (Democratic) 39.4% |
| California 24 | Brad Sherman | Democratic | 1996 | Incumbent re-elected. | √ Brad Sherman (Democratic) 57.3% Randy Hoffman (Republican) 38.5% Catherine Carter (Natural Law) 1.7% Erich Miller (Libertarian) 1.5% Ralph Shroyer (Peace and Freedom) 1% |
| California 25 | Howard McKeon | Republican | 1992 | Incumbent re-elected. | √ Howard McKeon (Republican) 74.7% Bruce Acker (Libertarian) 25.3% |
| California 26 | Howard Berman | Democratic | 1982 | Incumbent re-elected. | √ Howard Berman (Democratic) 82.5% Juan Carlos Ros (Libertarian) 7.8% Maria Armoudian (Green) 5.8% David Cossak (Natural Law) 3.9% |
| California 27 | Jim Rogan | Republican | 1996 | Incumbent re-elected. | √ Jim Rogan (Republican) 50.7% Barry Gordon (Democratic) 46.4% Bob New (Libertarian) 2.8% |
| California 28 | David Dreier | Republican | 1980 | Incumbent re-elected. | √ David Dreier (Republican) 57.6% Janice Nelson (Democratic) 39.2% Jerry Douglas (Libertarian) 1.3% Walt Sheasby (Green) 1.2% M. Lawrence Allison (Natural Law) 0.5% |
| California 29 | Henry Waxman | Democratic | 1974 | Incumbent re-elected. | √ Henry Waxman (Democratic) 73.9% Mike Gottlieb (Republican) 22.6% Mike Binkley (Libertarian) 2% Karen Wilkinson (Natural Law) 1.5% |
| California 30 | Xavier Becerra | Democratic | 1992 | Incumbent re-elected. | √ Xavier Becerra (Democratic) 81.3% Patricia Parker (Republican) 18.8% |
| California 31 | Matthew G. Martinez | Democratic | 1982 | Incumbent re-elected. | √ Matthew G. Martinez (Democratic) 70% Frank Moreno (Republican) 22.6% Krista Lieberg-Wong (Green) 5% Michael Everling (Libertarian) 1.3% Gary Hearne (Natural Law) 1% |
| California 32 | Julian C. Dixon | Democratic | 1978 | Incumbent re-elected. | √ Julian C. Dixon (Democratic) 86.7% Lawrence Ardito (Republican) 11.3% Velko Milosevich (Libertarian) 2% |
| California 33 | Lucille Roybal-Allard | Democratic | 1992 | Incumbent re-elected. | √ Lucille Roybal-Allard (Democratic) 87.2% Wayne Miller (Republican) 12.8% |
| California 34 | Ed Torres | Democratic | 1982 | Incumbent retired. New member elected. Democratic hold. |
√ Grace Napolitano (Democratic) 67.6% Ed Perez (Republican) 28.6% Jason Heath (Libertarian) 1.9% Walter Scott (American Independent) 1.9% |
| California 35 | Maxine Waters | Democratic | 1990 | Incumbent re-elected. | √ Maxine Waters (Democratic) 89.3% Gordon Mego (American Independent) 10.7% |
| California 36 | Jane Harman | Democratic | 1986 | Incumbent retired to run for Governor. New member elected. Republican gain. |
√ Steven T. Kuykendall (Republican) 48.9% Janice Hahn (Democratic) 46.6% Robin Barrett (Green) 2% Kerry Welsh (Libertarian) 1.7% John Konopka (American Independent) 0.9% |
| California 37 | Juanita Millender-McDonald | Democratic | 1996 | Incumbent re-elected. | √ Juanita Millender-McDonald (Democratic) 85.1% Saul Lankster (Republican) 14.9% |
| California 38 | Steve Horn | Republican | 1992 | Incumbent re-elected. | √ Steve Horn (Republican) 52.9% Peter Mathews (Democratic) 44.3% David Bowers (Libertarian) 2.8% |
| California 39 | Ed Royce | Republican | 1992 | Incumbent re-elected. | √ Ed Royce (Republican) 62.6% Cecy Groom (Democratic) 34% Jack Dean (Libertarian) 2.2% Ron Jevning (Natural Law) 1.3% |
| California 40 | Jerry Lewis | Republican | 1978 | Incumbent re-elected. | √ Jerry Lewis (Republican) 64.9% Robert Conaway (Democratic) 31.9% Maurice Mayben (Libertarian) 3.2% |
| California 41 | Jay Kim | Republican | 1992 | Incumbent lost renomination. New member elected. Republican hold. |
√ Gary Miller (Republican) 53.2% Eileen Ansari (Democratic) 40.7% Cynthia Allaire (Green) 2.8% Kenneth Valentine (Libertarian) 2% David Kramer (Natural Law) 1.3% |
| California 42 | George Brown Jr. | Democratic | 1972 | Incumbent re-elected. | √ George Brown Jr. (Democratic) 55.3% Elia Pirozzi (Republican) 40.3% Hale McGee (American Independent) 2.7% David Hollist (Libertarian) 1.7% |
| California 43 | Ken Calvert | Republican | 1992 | Incumbent re-elected. | √ Ken Calvert (Republican) 55.7% Mike Rayburn (Democratic) 37.8% Phill Courtney (Green) 3.7% Annie Wallack (Natural Law) 2.8% |
| California 44 | Mary Bono | Republican | April 7, 1998 (special) |
Incumbent re-elected. | √ Mary Bono (Republican) 60% Ralph Waite (Democratic) 35.7% Jim Meuer (Natural Law) 4.2% |
| California 45 | Dana Rohrabacher | Republican | 1988 | Incumbent re-elected. | √ Dana Rohrabacher (Republican) 56.4% Patricia Neal (Democratic) 37.3% Don Hull (Libertarian) 2.7% William Verkamp (Natural Law) 1.3% |
| California 46 | Loretta Sanchez | Democratic | 1996 | Incumbent re-elected. | √ Loretta Sanchez (Democratic) 56.4% Bob Dornan (Republican) 39.2% Thomas Reimer (Libertarian) 2.7% Larry Engwall (Natural Law) 1.6% |
| California 47 | Christopher Cox | Republican | 1988 | Incumbent re-elected. | √ Christopher Cox (Republican) 67.6% Christina Avalos (Democratic) 29.5% Victor Wagner (Libertarian) 1.5% Paul Fisher (Natural Law) 0.7% |
| California 48 | Ron Packard | Republican | 1982 | Incumbent re-elected. | √ Ron Packard (Republican) 76.9% Sharon Miles (Natural Law) 12.9% Daniel Muhe (Democratic) 10.2% |
| California 49 | Brian Bilbray | Republican | 1994 | Incumbent re-elected. | √ Brian Bilbray (Republican) 48.8% Christine Kehoe (Democratic) 46.6% Ernest Lippe (Libertarian) 1.8% Julie Simon (Natural Law) 1.5% Janice Jordan (Peace and Freedom) 1.3% |
| California 50 | Bob Filner | Democratic | 1992 | Incumbent re-elected. | Bob Filner (Democratic) Unopposed |
| California 51 | Duke Cunningham | Republican | 1990 | Incumbent re-elected. | √ Duke Cunningham (Republican) 61% Dan Kripke (Democratic) 34.7% Jack C. Anderson (Libertarian) 2.6% Eric Bourdette (Natural Law) 1.7% |
| California 52 | Duncan Hunter | Republican | 1980 | Incumbent re-elected. | √ Duncan Hunter (Republican) 75.7% Lynn Badler (Libertarian) 14.3% Adrienne Pelton (Natural Law) 10% |
Colorado
| District | Incumbent | Party | First elected |
Results | Candidates |
|---|---|---|---|---|---|
| Colorado 1 | Diana DeGette | Democratic | 1996 | Incumbent re-elected. | √ Diana DeGette (Democratic) 66.9% Nancy McClanahan (Republican) 30.1% Richard Combs (Libertarian) 3% |
| Colorado 2 | David Skaggs | Democratic | 1986 | Incumbent retired. New member elected. Democratic hold. |
√ Mark Udall (Democratic) 49.9% Bob Greenlee (Republican) 47.4% Patrick C. West (Natural Law) 2.7% |
| Colorado 3 | Scott McInnis | Republican | 1992 | Incumbent re-elected. | √ Scott McInnis (Republican) 66.1% Reed Kelley (Democratic) 31.5% Barry Maggert (Libertarian) 2.4% |
| Colorado 4 | Bob Schaffer | Republican | 1996 | Incumbent re-elected. | √ Bob Schaffer (Republican) 59% Susan Kirkpatrick (Democratic) 41% |
| Colorado 5 | Joel Hefley | Republican | 1986 | Incumbent re-elected. | √ Joel Hefley (Republican) 72.7% Ken Alford (Democratic) 26% Mark A. Mellot (Natural Law) 1.3% |
| Colorado 6 | Daniel Schaefer | Republican | 1983 | Incumbent retired. New member elected. Republican hold. |
√ Tom Tancredo (Republican) 55.9% Henry Strauss (Democratic) 41.5% George Newman (Natural Law) 2.6% |
Connecticut
| District | Incumbent | Party | First elected |
Results | Candidates |
|---|---|---|---|---|---|
| Connecticut 1 | Barbara Kennelly | Democratic | 1982 | Incumbent retired to run for Governor. New member elected. Democratic hold. |
√ John Larson (Democratic) 58% Kevin O'Connor (Republican) 41.4% Jay E. Palmieri IV (Term Limits) .5% |
| Connecticut 2 | Sam Gejdenson | Democratic | 1980 | Incumbent re-elected. | √ Sam Gejdenson (Democratic) 61% Gary Koval (Republican) 35.5% Dianne G. Ondusko (Independence) 3.1% Paul W. Cook (Term Limits) 0.4% |
| Connecticut 3 | Rosa DeLauro | Democratic | 1990 | Incumbent re-elected. | √ Rosa DeLauro (Democratic) 71.3% Martin Reust (Republican) 27.4% Kristen J. Abbatiello (Term Limits) 0.5% David Cole (Reform) 0.4% Gail J. Dalby (Natural Law) 0.4% |
| Connecticut 4 | Chris Shays | Republican | 1987 | Incumbent re-elected. | √ Chris Shays (Republican) 69% Jonathan Kantrowitz (Democratic) 29.9% Marshall C. Harrison (Libertarian) 1.1% |
| Connecticut 5 | Jim Maloney | Democratic | 1996 | Incumbent re-elected. | √ Jim Maloney (Democratic) 49.9% Mark Nielsen (Republican) 48.4% Robert V. Strasdauskas (Concerned Citizens) 1.7% |
| Connecticut 6 | Nancy Johnson | Republican | 1982 | Incumbent re-elected. | √ Nancy Johnson (Republican) 58.1% Charlotte Koskoff (Democratic) 39.6% Timothy A. Knibbs (Concerned Citizens) 1.8% Mark J. Polon (Term Limits) 0.4% |
Delaware
| District | Incumbent | Party | First elected |
Results | Candidates |
|---|---|---|---|---|---|
| Delaware at-large | Michael N. Castle | Republican | 1992 | Incumbent re-elected. | √ Michael N. Castle (Republican) 66.4% Dennis Williams (Democratic) 31.8% James P. Webster (U.S. Taxpayers) 1.3% Kim Stanley Bemis (Natural Law) 0.5% |
Florida
| District | Incumbent | Party | First elected |
Results | Candidates |
|---|---|---|---|---|---|
| Florida 1 | Joe Scarborough | Republican | 1994 | Incumbent re-elected. | √ Joe Scarborough (Republican) 99.5% unopposed |
| Florida 2 | Allen Boyd | Democratic | 1996 | Incumbent re-elected. | √ Allen Boyd (Democratic) Unopposed |
| Florida 3 | Corrine Brown | Democratic | 1992 | Incumbent re-elected. | √ Corrine Brown (Democratic) 56% Bill Randall (Democratic) 44% |
| Florida 4 | Tillie Fowler | Republican | 1992 | Incumbent re-elected. | √ Tillie Fowler (Republican) Unopposed |
| Florida 5 | Karen Thurman | Democratic | 1992 | Incumbent re-elected. | √ Karen Thurman (Democratic) 66.3% Jack Gargan (Reform) 33.7% |
| Florida 6 | Cliff Stearns | Republican | 1988 | Incumbent re-elected. | √ Cliff Stearns (Republican) Unopposed |
| Florida 7 | John Mica | Republican | 1992 | Incumbent re-elected. | √ John Mica (Republican) Unopposed |
| Florida 8 | Bill McCollum | Republican | 1980 | Incumbent re-elected. | √ Bill McCollum (Republican) 66% Al Krulick (Democratic) 34% |
| Florida 9 | Michael Bilirakis | Republican | 1982 | Incumbent re-elected. | √ Michael Bilirakis (Republican) Unopposed |
| Florida 10 | Bill Young | Republican | 1970 | Incumbent re-elected. | √ Bill Young (Republican) Unopposed |
| Florida 11 | Jim Davis | Democratic | 1996 | Incumbent re-elected. | √ Jim Davis (Democratic) 65% John Chillura (Republican) 35% |
| Florida 12 | Charles Canady | Republican | 1992 | Incumbent re-elected. | √ Charles Canady (Republican) Unopposed |
| Florida 13 | Dan Miller | Republican | 1992 | Incumbent re-elected. | √ Dan Miller (Republican) Unopposed |
| Florida 14 | Porter Goss | Republican | 1988 | Incumbent re-elected. | √ Porter Goss (Republican) Unopposed |
| Florida 15 | Dave Weldon | Republican | 1994 | Incumbent re-elected. | √ Dave Weldon (Republican) 63% David Golding (Democratic) 37% |
| Florida 16 | Mark Foley | Republican | 1994 | Incumbent re-elected. | √ Mark Foley (Republican) Unopposed |
| Florida 17 | Carrie Meek | Democratic | 1992 | Incumbent re-elected. | √ Carrie Meek (Democratic) Unopposed |
| Florida 18 | Ileana Ros-Lehtinen | Republican | 1989 | Incumbent re-elected. | √ Ileana Ros-Lehtinen (Republican) Unopposed |
| Florida 19 | Robert Wexler | Democratic | 1996 | Incumbent re-elected. | √ Robert Wexler (Democratic) Unopposed |
| Florida 20 | Peter Deutsch | Democratic | 1992 | Incumbent re-elected. | √ Peter Deutsch (Democratic) Unopposed |
| Florida 21 | Lincoln Diaz-Balart | Republican | 1992 | Incumbent re-elected. | √ Lincoln Diaz-Balart (Republican) 75% Patrick Cusack (Democratic) 25% |
| Florida 22 | Clay Shaw | Republican | 1980 | Incumbent re-elected. | √ Clay Shaw (Republican) Unopposed |
| Florida 23 | Alcee Hastings | Democratic | 1992 | Incumbent re-elected. | √ Alcee Hastings (Democratic) Unopposed |
Georgia
| District | Incumbent | Party | First elected |
Results | Candidates |
|---|---|---|---|---|---|
| Georgia 1 | Jack Kingston | Republican | 1992 | Incumbent re-elected. | √ Jack Kingston (Republican) Unopposed |
| Georgia 2 | Sanford Bishop | Democratic | 1992 | Incumbent re-elected. | √ Sanford Bishop (Democratic) 57% Joseph F. McCormick (Republican) 43% |
| Georgia 3 | Mac Collins | Republican | 1992 | Incumbent re-elected. | √ Mac Collins (Republican) Unopposed |
| Georgia 4 | Cynthia McKinney | Democratic | 1992 | Incumbent re-elected. | √ Cynthia McKinney (Democratic) 61% Sunny Warren (Republican) 39% |
| Georgia 5 | John Lewis | Democratic | 1986 | Incumbent re-elected. | √ John Lewis (Democratic) 79% John Lewis Sr. (Republican) 21% |
| Georgia 6 | Newt Gingrich | Republican | 1978 | Incumbent re-elected. | √ Newt Gingrich (Republican) 71% Gary Pelphrey (Democratic) 29% |
| Georgia 7 | Bob Barr | Republican | 1994 | Incumbent re-elected. | √ Bob Barr (Republican) 55% James Williams (Democratic) 45% |
| Georgia 8 | Saxby Chambliss | Republican | 1994 | Incumbent re-elected. | √ Saxby Chambliss (Republican) 62% Ronald Cain (Democratic) 38% |
| Georgia 9 | Nathan Deal | Republican | 1992 | Incumbent re-elected. | √ Nathan Deal (Republican) Unopposed |
| Georgia 10 | Charlie Norwood | Republican | 1994 | Incumbent re-elected. | √ Charlie Norwood (Republican) 59% Marion Freeman (Democratic) 41% |
| Georgia 11 | John Linder | Republican | 1992 | Incumbent re-elected. | √ John Linder (Republican) 69% Vince Littman (Democratic) 31% |
Hawaii
| District | Incumbent | Party | First elected |
Results | Candidates |
|---|---|---|---|---|---|
| Hawaii 1 | Neil Abercrombie | Democratic | 1990 | Incumbent re-elected. | √ Neil Abercrombie (Democratic) 59.8% Gene Ward (Republican) 35.3% Nicholas Bedworth (Natural Law) 2% |
| Hawaii 2 | Patsy Mink | Democratic | 1964, 1990 |
Incumbent re-elected. | √ Patsy Mink (Democratic) 66.3% Carol Douglass (Republican) 23.2% Noreen Leilehua Chun (Libertarian) 6.1% |
Idaho
| District | Incumbent | Party | First elected |
Results | Candidates |
|---|---|---|---|---|---|
| Idaho 1 | Helen Chenoweth | Republican | 1994 | Incumbent re-elected. | √ Helen Chenoweth (Republican) 55% Dan Williams (Democratic) 45% |
| Idaho 2 | Mike Crapo | Republican | 1992 | Incumbent retired to run for U.S. Senator. New member elected. Republican hold. |
√ Mike Simpson (Republican) 52.5% Richard Stallings (Democratic) 44.7% Jonathan B. Ratner (Natural Law) 2.8% |
Illinois
| District | Incumbent | Party | First elected |
Results | Candidates |
|---|---|---|---|---|---|
| Illinois 1 | Bobby Rush | Democratic | 1992 | Incumbent re-elected. | √ Bobby Rush (Democratic) 87.1% Marlene Ahimaz (Republican) 10.6% Marjorie Kohls (Libertarian) 2.3% |
| Illinois 2 | Jesse Jackson Jr. | Democratic | 1995 | Incumbent re-elected. | √ Jesse Jackson Jr. (Democratic) 89.4% Robert Gordon (Republican) 9.6% Matthew Beauchamp (Libertarian) 1% |
| Illinois 3 | Bill Lipinski | Democratic | 1982 | Incumbent re-elected. | √ Bill Lipinski (Democratic) 72.5% Robert Marshall (Republican) 27.5% |
| Illinois 4 | Luis Gutierrez | Democratic | 1992 | Incumbent re-elected. | √ Luis Gutierrez (Democratic) 81.7% John Birch (Republican) 15.9% William Passmore (Libertarian) 2.4% |
| Illinois 5 | Rod Blagojevich | Democratic | 1996 | Incumbent re-elected. | √ Rod Blagojevich (Democratic) 74% Alan Spitz (Republican) 26% |
| Illinois 6 | Henry Hyde | Republican | 1974 | Incumbent re-elected. | √ Henry Hyde (Republican) 67.3% Thomas Cramer (Democratic) 30.1% George Meyers (Libertarian) 2.5% |
| Illinois 7 | Danny K. Davis | Democratic | 1996 | Incumbent re-elected. | √ Danny K. Davis (Democratic) 92.9% Dorn Van Cleave (Libertarian) 7.1% |
| Illinois 8 | Phil Crane | Republican | 1969 | Incumbent re-elected. | √ Phil Crane (Republican) 68.6% Mike Rothman (Democratic) 31.4% |
| Illinois 9 | Sidney Yates | Democratic | 1964 | Incumbent retired. New member elected. Democratic hold. |
√ Jan Schakowsky (Democratic) 74.6% Herbert Sohn (Republican) 23.1% Michael Ray (Libertarian) 2.3% |
| Illinois 10 | John Porter | Republican | 1980 | Incumbent re-elected. | √ John Porter (Republican) Unopposed |
| Illinois 11 | Jerry Weller | Republican | 1994 | Incumbent re-elected. | √ Jerry Weller (Republican) 58.8% Gary Mueller (Democratic) 41.2% |
| Illinois 12 | Jerry Costello | Democratic | 1988 | Incumbent re-elected. | √ Jerry Costello (Democratic) 60.4% William Price (Republican) 39.6% |
| Illinois 13 | Harris Fawell | Republican | 1984 | Incumbent retired. New member elected. Republican hold. |
√ Judy Biggert (Republican) 61% Susan Hynes (Democratic) 39% |
| Illinois 14 | Dennis Hastert | Republican | 1986 | Incumbent re-elected. | √ Dennis Hastert (Republican) 69.8% Robert Cozzi (Democratic) 30.2% |
| Illinois 15 | Thomas Ewing | Republican | 1991 | Incumbent re-elected. | √ Thomas Ewing (Republican) 61.6% Laurel Lunt Prussing (Democratic) 38.4% |
| Illinois 16 | Donald A. Manzullo | Republican | 1992 | Incumbent re-elected. | √ Donald A. Manzullo (Republican) Unopposed |
| Illinois 17 | Lane Evans | Democratic | 1982 | Incumbent re-elected. | √ Lane Evans (Democratic) 51.6% Mark Baker (Republican) 48.4% |
| Illinois 18 | Ray LaHood | Republican | 1994 | Incumbent re-elected. | √ Ray LaHood (Republican) Unopposed |
| Illinois 19 | Glenn Poshard | Democratic | 1988 | Incumbent retired to run for Governor. New member elected. Democratic hold. |
√ David D. Phelps (Democratic) 58.3% Brent Winters (Republican) 41.7% |
| Illinois 20 | John Shimkus | Republican | 1996 | Incumbent re-elected. | √ John Shimkus (Republican) 61.3% Rick Verticchio (Democratic) 38.7% |
Indiana
| District | Incumbent | Party | First elected |
Results | Candidates |
|---|---|---|---|---|---|
| Indiana 1 | Pete Visclosky | Democratic | 1984 | Incumbent re-elected. | √ Pete Visclosky (Democratic) 72.5% Michael Petyo (Republican) 26.2% Michael Crass (Libertarian) 1.3% |
| Indiana 2 | David McIntosh | Republican | 1994 | Incumbent re-elected. | √ David McIntosh (Republican) 60.6% Sherman Boles (Democratic) 38% Cliff Federle (Libertarian) 1.4% |
| Indiana 3 | Tim Roemer | Democratic | 1990 | Incumbent re-elected. | √ Tim Roemer (Democratic) 58.1% Daniel Holtz (Republican) 41.9% |
| Indiana 4 | Mark Souder | Republican | 1994 | Incumbent re-elected. | √ Mark Souder (Republican) 63.3% Mark Wehrle (Democratic) 36.7% |
| Indiana 5 | Steve Buyer | Republican | 1992 | Incumbent re-elected. | √ Steve Buyer (Republican) 62.6% David Steele III (Democratic) 36% Carl D. Waters (Libertarian) 1.4% |
| Indiana 6 | Dan Burton | Republican | 1982 | Incumbent re-elected. | √ Dan Burton (Republican) 72% Bob Kern (Democratic) 16.8% Joe Hauptmann (Libertarian) 11.2% |
| Indiana 7 | Edward Pease | Republican | 1996 | Incumbent re-elected. | √ Edward Pease (Republican) 68.9% Samuel Hillenburg (Democratic) 28.1% Barbara Bourland (Libertarian) 3% |
| Indiana 8 | John Hostettler | Republican | 1994 | Incumbent re-elected. | √ John Hostettler (Republican) 52.1% Gail Riecken (Democratic) 46% Paul Hager (Libertarian) 1.9% |
| Indiana 9 | Lee H. Hamilton | Democratic | 1964 | Incumbent retired. New member elected. Democratic hold. |
√ Baron Hill (Democratic) 50.8% Jean Leising (Republican) 47.9% Diane L. Feeney (Libertarian) 1.3% |
| Indiana 10 | Julia Carson | Democratic | 1996 | Incumbent re-elected. | √ Julia Carson (Democratic) 58.3% Gary Hofmeister (Republican) 39.4% Diane L. Feeney (Libertarian) 2.3% |
Iowa
| District | Incumbent | Party | First elected |
Results | Candidates |
|---|---|---|---|---|---|
| Iowa 1 | Jim Leach | Republican | 1976 | Incumbent re-elected. | √ Jim Leach (Republican) 56.5% Bob Rush (Democratic) 42.3% Charles Thurston (Reform) 0.7% Jeffrey M. Smith (Natural Law) 0.5% |
| Iowa 2 | Jim Nussle | Republican | 1990 | Incumbent re-elected. | √ Jim Nussle (Republican) 55.2% Rob Tully (Democratic) 44% Peter Lamoureux (Natural Law) 0.8% |
| Iowa 3 | Leonard Boswell | Democratic | 1996 | Incumbent re-elected. | √ Leonard Boswell (Democratic) 56.9% Larry McKibben (Republican) 41.1% Charles Connolly (Reform) 1.1% Joe Seehusen (Independent) 0.8% |
| Iowa 4 | Greg Ganske | Republican | 1994 | Incumbent re-elected. | √ Greg Ganske (Republican) 65.2% Jon Dvorak (Democratic) 33.9% Steven Yellin (Natural Law) 0.9% |
| Iowa 5 | Tom Latham | Republican | 1994 | Incumbent re-elected. | √ Tom Latham (Republican) Unopposed |
Kansas
| District | Incumbent | Party | First elected |
Results | Candidates |
|---|---|---|---|---|---|
| Kansas 1 | Jerry Moran | Republican | 1996 | Incumbent re-elected. | √ Jerry Moran (Republican) 80.7% Jim Phillips (Democratic) 19.3% |
| Kansas 2 | Jim Ryun | Republican | 1996 | Incumbent re-elected. | √ Jim Ryun (Republican) 61% Jim Clark (Democratic) 39% |
| Kansas 3 | Vince Snowbarger | Republican | 1996 | Incumbent lost re-election. New member elected. Democratic gain. |
√ Dennis Moore (Democratic) 52.4% Vince Snowbarger (Republican) 47.6% |
| Kansas 4 | Todd Tiahrt | Republican | 1994 | Incumbent re-elected. | √ Todd Tiahrt (Republican) 58.2% Jim Lawing (Democratic) 38.6% Craig Newland (U.S. Taxpayers) 3.2% |
Kentucky
| District | Incumbent | Party | First elected |
Results | Candidates |
|---|---|---|---|---|---|
| Kentucky 1 | Ed Whitfield | Republican | 1994 | Incumbent re-elected. | √ Ed Whitfield (Republican) 55.2% Tom Barlow (Democratic) 44.8% |
| Kentucky 2 | Ron Lewis | Republican | 1994 | Incumbent re-elected. | √ Ron Lewis (Republican) 63.7% Bob Evans (Democratic) 35.3% Jim Ketchel (Reform) 1% |
| Kentucky 3 | Anne Northup | Republican | 1996 | Incumbent re-elected. | √ Anne Northup (Republican) 51.5% Chris Gorman (Democratic) 47.5% Patricia Jo Metten (Natural Law) 1% |
| Kentucky 4 | Jim Bunning | Republican | 1986 | Incumbent retired to run for U.S. Senator. New member elected. Democratic gain. |
√ Ken Lucas (Democratic) 53.4% Gex Williams (Republican) 46.6% |
| Kentucky 5 | Hal Rogers | Republican | 1980 | Incumbent re-elected. | √ Hal Rogers (Republican) 78.2% Sidney Bailey-Bamer (Democratic) 21.8% |
| Kentucky 6 | Scotty Baesler | Democratic | 1992 | Incumbent retired to run for U.S. Senator. New member elected. Republican gain. |
√ Ernie Fletcher (Republican) 53.1% Ernesto Scorsone (Democratic) 46% Wasley Krogdahl (U.S. Taxpayers) 0.9% |
Louisiana
| District | Incumbent | Party | First elected |
Results | Candidates |
|---|---|---|---|---|---|
| Louisiana 1 | Bob Livingston | Republican | 1977 | Incumbent re-elected. | √ Bob Livingston (Republican) (unopposed) |
| Louisiana 2 | William J. Jefferson | Democratic | 1990 | Incumbent re-elected. | √ William J. Jefferson (Democratic) 86% |
| Louisiana 3 | Billy Tauzin | Republican | 1980 | Incumbent re-elected. | √ Billy Tauzin (Republican) (unopposed) |
| Louisiana 4 | Jim McCrery | Republican | 1988 | Incumbent re-elected. | √ Jim McCrery (Republican) (unopposed) |
| Louisiana 5 | John Cooksey | Republican | 1996 | Incumbent re-elected. | √ John Cooksey (Republican) (unopposed) |
| Louisiana 6 | Richard Baker | Republican | 1986 | Incumbent re-elected. | √ Richard Baker (Republican) 51% Marjorie McKeithen (Democratic) 49% |
| Louisiana 7 | Chris John | Democratic | 1996 | Incumbent re-elected. | √ Chris John (Democratic) (unopposed) |
Maine
| District | Incumbent | Party | First elected |
Results | Candidates |
|---|---|---|---|---|---|
| Maine 1 | Tom Allen | Democratic | 1996 | Incumbent re-elected. | √ Tom Allen (Democratic) 60.3% Ross Connelly (Republican) 35.5% Eric Greiner (U.S. Taxpayers) 4.1% |
| Maine 2 | John Baldacci | Democratic | 1994 | Incumbent re-elected. | √ John Baldacci (Democratic) 76.2% Johnathan Reisman (Republican) 23.8% |
Maryland
| District | Incumbent | Party | First elected |
Results | Candidates |
|---|---|---|---|---|---|
| Maryland 1 | Wayne Gilchrest | Republican | 1990 | Incumbent re-elected. | √ Wayne Gilchrest (Republican) 69% Irving Pinder (Democratic) 31% |
| Maryland 2 | Robert Ehrlich | Republican | 1994 | Incumbent re-elected. | √ Robert Ehrlich (Republican) 69% Kenneth Bosley (Democratic) 31% |
| Maryland 3 | Ben Cardin | Democratic | 1986 | Incumbent re-elected. | √ Ben Cardin (Democratic) 78% Colin Harby (Republican) 22% |
| Maryland 4 | Albert Wynn | Democratic | 1992 | Incumbent re-elected. | √ Albert Wynn (Democratic) 86% John Kimble (Republican) 14% |
| Maryland 5 | Steny Hoyer | Democratic | 1981 | Incumbent re-elected. | √ Steny Hoyer (Democratic) 66% Robert Ostrom (Republican) 34% |
| Maryland 6 | Roscoe Bartlett | Republican | 1992 | Incumbent re-elected. | √ Roscoe Bartlett (Republican) 63% Timothy McCown (Democratic) 37% |
| Maryland 7 | Elijah Cummings | Democratic | 1996 | Incumbent re-elected. | √ Elijah Cummings (Democratic) 86% Kenneth Kondner (Republican) 14% |
| Maryland 8 | Constance Morella | Republican | 1986 | Incumbent re-elected. | √ Constance Morella (Republican) 60% Ralph Neas (Democratic) 40% |
Massachusetts
| District | Incumbent | Party | First elected |
Results | Candidates |
|---|---|---|---|---|---|
| Massachusetts 1 | John Olver | Democratic | 1991 | Incumbent re-elected. | √ John Olver (Democratic) 71.7% Gregory Morgan (Republican) 28.3% |
| Massachusetts 2 | Richard Neal | Democratic | 1988 | Incumbent re-elected. | √ Richard Neal (Democratic) 99% unopposed |
| Massachusetts 3 | Jim McGovern | Democratic | 1996 | Incumbent re-elected. | √ Jim McGovern (Democratic) 56.9% Matthew Amorello (Republican) 41.5% George Phillies (Libertarian) 1.5% |
| Massachusetts 4 | Barney Frank | Democratic | 1980 | Incumbent re-elected. | √ Barney Frank (Democratic) 98.4% unopposed |
| Massachusetts 5 | Marty Meehan | Democratic | 1992 | Incumbent re-elected. | √ Marty Meehan (Democratic) 70.7% David Coleman (Republican) 29.3% |
| Massachusetts 6 | John F. Tierney | Democratic | 1996 | Incumbent re-elected. | √ John F. Tierney (Democratic) 54.6% Peter Torkildsen (Republican) 42.4% Randal C. Fritz (Independent) 3% |
| Massachusetts 7 | Ed Markey | Democratic | 1976 | Incumbent re-elected. | √ Ed Markey (Democratic) 70.6% Patricia Long (Republican) 29.3% |
| Massachusetts 8 | Joe Kennedy | Democratic | 1986 | Incumbent retired. New member elected. Democratic hold. |
√ Mike Capuano (Democratic) 81.7% Philip Hyde (Republican) 11.5% Andrea Morell (Socialist Workers) 4% Anthony A. Schinella (Independent) 2.8% |
| Massachusetts 9 | Joe Moakley | Democratic | 1972 | Incumbent re-elected. | √ Joe Moakley (Democratic) 99.4% unopposed |
| Massachusetts 10 | Bill Delahunt | Democratic | 1996 | Incumbent re-elected. | √ Bill Delahunt (Democratic) 70% Eric Bleicken (Republican) 29.9% |
Michigan
| District | Incumbent | Party | First elected |
Results | Candidates |
|---|---|---|---|---|---|
| Michigan 1 | Bart Stupak | Democratic | 1992 | Incumbent re-elected. | √ Bart Stupak (Democratic) 58.7% Michelle McManus (Republican) 39.5% John Loosemore (Libertarian) 1% Wendy Conway (Natural Law) 0.8% |
| Michigan 2 | Pete Hoekstra | Republican | 1992 | Incumbent re-elected. | √ Pete Hoekstra (Republican) 68.7% Bob Shrauger (Democratic) 29.8% Bruce A. Smith (Libertarian) 1% Tom Russell (Natural Law) 0.5% |
| Michigan 3 | Vern Ehlers | Republican | 1993 | Incumbent re-elected. | √ Vern Ehlers (Republican) 73% John Ferguson (Democratic) 24.7% Erwin Haas (Libertarian) 1.3% Lucille Wiggins (Natural Law) 1% |
| Michigan 4 | Dave Camp | Republican | 1990 | Incumbent re-elected. | √ Dave Camp (Republican) 91.3% Dan Marsh (Libertarian) 6.1% Stuart Goldberg (Natural Law) 2.5% |
| Michigan 5 | James Barcia | Democratic | 1992 | Incumbent re-elected. | √ James Barcia (Democratic) 71.2% Donald Brewster (Republican) 27.1% Clint Foster (Libertarian) 1.1% Brian D. Ellison (Natural Law) 0.6% |
| Michigan 6 | Fred Upton | Republican | 1986 | Incumbent re-elected. | √ Fred Upton (Republican) 70.1% Clarence Annen (Democratic) 28.1% Glenn Douglas Whitt Jr. (Libertarian) 1.1% Ken Asmus (Natural Law) 0.7% |
| Michigan 7 | Nick Smith | Republican | 1992 | Incumbent re-elected. | √ Nick Smith (Republican) 57.4% Jim Berryman (Democratic) 40.1% Kenneth L. Proctor (Libertarian) 1.5% Lynnea Ellison (Natural Law) 1% |
| Michigan 8 | Debbie Stabenow | Democratic | 1996 | Incumbent re-elected. | √ Debbie Stabenow (Democratic) 57.4% Susan Munsell (Republican) 38.6% John Mangopoulos (Reform) 2.1% Ben Steele III (Libertarian) 1.3% Patricia R. Allen (Natural Law) 0.6% |
| Michigan 9 | Dale Kildee | Democratic | 1976 | Incumbent re-elected. | √ Dale Kildee (Democratic) 55.9% Tom McMillin (Republican) 41.9% Malcolm Johnson (Libertarian) 2.2% |
| Michigan 10 | David Bonior | Democratic | 1976 | Incumbent re-elected. | √ David Bonior (Democratic) 52.4% Brian Palmer (Republican) 45.3% R. Friend (Libertarian) 1.6% Henry Ogden Clark (Natural Law) 0.6% |
| Michigan 11 | Joe Knollenberg | Republican | 1992 | Incumbent re-elected. | √ Joe Knollenberg (Republican) 63.9% Travis Reeds (Democratic) 33.7% Dick Gach (Libertarian) 2.4% |
| Michigan 12 | Sander Levin | Democratic | 1982 | Incumbent re-elected. | √ Sander Levin (Democratic) 55.9% Leslie Touma (Republican) 42% Albert J. Titran (Libertarian) 1.5% Fred D. Rosenberg (Natural Law) 0.6% |
| Michigan 13 | Lynn Rivers | Democratic | 1994 | Incumbent re-elected. | √ Lynn Rivers (Democratic) 58.1% Tom Hickey (Republican) 39.8% Dean Hutyra (Libertarian) 1.7% Samir Roger Makarem (Natural Law) 0.4% |
| Michigan 14 | John Conyers Jr. | Democratic | 1964 | Incumbent re-elected. | √ John Conyers Jr. (Democratic) 86.9% Vendella Collins (Republican) 11.1% Michael Freyman (Libertarian) 1.2% Richard R. Miller (Natural Law) 0.7% |
| Michigan 15 | Carolyn Kilpatrick | Democratic | 1996 | Incumbent re-elected. | √ Carolyn Kilpatrick (Democratic) 87% Chrysanthea Boyd-Fields (Republican) 10.3% Linda S. Willey (Libertarian) 1.2% Gregory F. Smith (Natural Law) 0.9% Holly Harkness (Independent) 0.6% |
| Michigan 16 | John Dingell | Democratic | 1955 | Incumbent re-elected. | √ John Dingell (Democratic) 66.6% William Morse (Republican) 31% Edward Hlavac (Libertarian) 1.8% Noha Hamze (Natural Law) 0.6% |
Minnesota
| District | Incumbent | Party | First elected |
Results | Candidates |
|---|---|---|---|---|---|
| Minnesota 1 | Gil Gutknecht | Republican | 1994 | Incumbent re-elected. | √ Gil Gutknecht (Republican) 54.7% Tracy Beckman (Democratic) 45.2% |
| Minnesota 2 | David Minge | Democratic | 1992 | Incumbent re-elected. | √ David Minge (Democratic) 57% Craig Duehring (Republican) 38.1% Stan Bentz (Reform) 4.7% |
| Minnesota 3 | Jim Ramstad | Republican | 1990 | Incumbent re-elected. | √ Jim Ramstad (Republican) 71.9% Stan Leino (Democratic) 23.5% Derek W. Schramm (Minnesota Taxpayers) 4.5% |
| Minnesota 4 | Bruce Vento | Democratic | 1976 | Incumbent re-elected. | √ Bruce Vento (Democratic) 53.7% Dennis Newinski (Republican) 39.8% Dan R. Vacek (Legal Marijuana Now) 2.4% Carol Simmons Schulstad (Minnesota Taxpayers) 1.9% Michael A. Neitzel (Libertarian) 1.2% Heather Wood (Socialist Workers) 0.9% |
| Minnesota 5 | Martin Sabo | Democratic | 1978 | Incumbent re-elected. | √ Martin Sabo (Democratic) 66.9% Frank Taylor (Republican) 27.6% Kevin Houston (Libertarian) 3.4% Michael Pennock (Socialist Workers) 1.4% Jason Kassel (Anti-Federalist) 0.7% |
| Minnesota 6 | Bill Luther | Democratic | 1994 | Incumbent re-elected. | √ Bill Luther (Democratic) 50% John Kline (Republican) 46% Eric M. Johnson (Libertarian) 4% |
| Minnesota 7 | Collin Peterson | Democratic | 1990 | Incumbent re-elected. | √ Collin Peterson (Democratic) 71.7% Jerry Shuster (Republican) 28.1% |
| Minnesota 8 | Jim Oberstar | Democratic | 1974 | Incumbent re-elected. | √ Jim Oberstar (Democratic) 66% Jerry Shuster (Republican) 26.5% Stan Estes (Reform) 5.8% Larry Fuhol (Libertarian) 1.7% |
Mississippi
| District | Incumbent | Party | First elected |
Results | Candidates |
|---|---|---|---|---|---|
| Mississippi 1 | Roger Wicker | Republican | 1994 | Incumbent re-elected. | √ Roger Wicker (Republican) 67.2% Rex Weathersr (Democratic) 30.6% John Rouse (Libertarian) 2.2% |
| Mississippi 2 | Bennie Thompson | Democratic | 1993 | Incumbent re-elected. | Bennie Thompson (Democratic) 71.2% Will Chipman (Libertarian) 28.8% |
| Mississippi 3 | Chip Pickering | Republican | 1996 | Incumbent re-elected. | Chip Pickering (Republican) 84.6% Charles T. Scarborough (Libertarian) 15.4% |
| Mississippi 4 | Mike Parker | Republican | 1988 | Incumbent retired to run for Governor. New member elected. Democratic gain. |
√ Ronnie Shows (Democratic) 54% Delbert Hosemann (Republican) 46% Bill Fausek (Libertarian) 0.7% Vince Thornton (U.S. Taxpayers) 0.6% Kenneth Welch (Reform) 0.5% |
| Mississippi 5 | Gene Taylor | Democratic | 1989 | Incumbent re-elected. | √ Gene Taylor (Democratic) 77.8% Randy McDonnell (Republican) 19.1% Ray Coffey (Libertarian) 1.5% Robert Claunch (Reform) 1.1% Philip Mayeux (Natural Law) 0.5% |
Missouri
| District | Incumbent | Party | First elected |
Results | Candidates |
|---|---|---|---|---|---|
| Missouri 1 | William Lacy Clay | Democratic | 1968 | Incumbent re-elected. | √ William Lacy Clay (Democratic) 72.6% Richmond Soluade (Republican) 24.5% Richard Illyes (Libertarian) 2.9% |
| Missouri 2 | James Talent | Republican | 1992 | Incumbent re-elected. | √ James Talent (Republican) 70% John Ross (Democratic) 28.3% Brian Lundy (Libertarian) 1.6% |
| Missouri 3 | Dick Gephardt | Democratic | 1976 | Incumbent re-elected. | √ Dick Gephardt (Democratic) 55.8% Bill Federer (Republican) 42% Michael Crist (Libertarian) 1.3% Joseph Keller (U.S. Taxpayers) 0.9% |
| Missouri 4 | Ike Skelton | Democratic | 1976 | Incumbent re-elected. | √ Ike Skelton (Democratic) 71% Cecilia Noland (Republican) 27.2% Edwin Hoag (Libertarian) 1.8% |
| Missouri 5 | Karen McCarthy | Democratic | 1994 | Incumbent re-elected. | √ Karen McCarthy (Democratic) 65.9% Penny Bennett (Republican) 31% Grant Stauffer (Libertarian) 1.7% Elizabeth Dulaney (Reform) 1.4% |
| Missouri 6 | Patsy Danner | Democratic | 1992 | Incumbent re-elected. | √ Patsy Danner (Democratic) 71% Jeff Bailey (Republican) 26.8% Karl Wetzel (Libertarian) 2.2% |
| Missouri 7 | Roy Blunt | Republican | 1996 | Incumbent re-elected. | √ Roy Blunt (Republican) 72.6% Marc Perkel (Democratic) 24.3% Mike Harman (Libertarian) 3.2% |
| Missouri 8 | Jo Ann Emerson | Republican | 1996 | Incumbent re-elected. | √ Jo Ann Emerson (Republican) 62.6% Anthony Heckemeyer (Democratic) 35.7% John Hendricks (Libertarian) 1.7% |
| Missouri 9 | Kenny Hulshof | Republican | 1996 | Incumbent re-elected. | √ Kenny Hulshof (Republican) 62.2% Linda Vogt (Democratic) 35.5% Robert Hoffman (Libertarian) 2.3% |
Montana
| District | Incumbent | Party | First elected |
Results | Candidates |
|---|---|---|---|---|---|
| Montana at-large | Rick Hill | Republican | 1996 | Incumbent re-elected. | √ Rick Hill (Republican) 53% Robert Deschamps (Democratic) 44.4% Mike Fellows (Libertarian) 1.7% Webb Sullivan (Reform) 0.9% |
Nebraska
| District | Incumbent | Party | First elected |
Results | Candidates |
|---|---|---|---|---|---|
| Nebraska 1 | Doug Bereuter | Republican | 1978 | Incumbent re-elected. | √ Doug Bereuter (Republican) 73.5% Don Eret (Democratic) 26.4% |
| Nebraska 2 | Jon L. Christensen | Republican | 1994 | Incumbent retired. New member elected. Republican hold. |
√ Lee Terry (Republican) 65.5% Michael Scott (Democratic) 34.2% |
| Nebraska 3 | Bill Barrett | Republican | 1990 | Incumbent re-elected. | √ Bill Barrett (Republican) 84.3% Jerry Hickman (Libertarian) 15.3% |
Nevada
| District | Incumbent | Party | First elected |
Results | Candidates |
|---|---|---|---|---|---|
| Nevada 1 | John Ensign | Republican | 1994 | Incumbent retired to run for U.S. Senator. New member elected. Democratic gain. |
√ Shelley Berkley (Democratic) 49.2% Don Chairez (Republican) 45.7% Jim Burns (Libertarian) 3.3% Jess Howe (IA) 1.8% |
| Nevada 2 | Jim Gibbons | Republican | 1996 | Incumbent re-elected. | √ Jim Gibbons (Republican) 81.1% Christopher Horne (IA) 8.3% Louis Tomburello (Libertarian) 7.5% Robert Winquist (Natural Law) 3.2% |
New Hampshire
| District | Incumbent | Party | First elected |
Results | Candidates |
|---|---|---|---|---|---|
| New Hampshire 1 | John Sununu | Republican | 1996 | Incumbent re-elected. | √ John Sununu (Republican) 66.9% Peter Flood (Democratic) 33.1% |
| New Hampshire 2 | Charlie Bass | Republican | 1994 | Incumbent re-elected. | √ Charlie Bass (Republican) 53.2% Mary Rauh (Democratic) 44.8% Paula Werme (Libertarian) 2% |
New Jersey
| District | Incumbent | Party | First elected |
Results | Candidates |
|---|---|---|---|---|---|
| New Jersey 1 | Rob Andrews | Democratic | 1990 | Incumbent re-elected. | √ Rob Andrews (Democratic) 74% Ronald Richards (Republican) 23% |
| New Jersey 2 | Frank LoBiondo | Republican | 1994 | Incumbent re-elected. | √ Frank LoBiondo (Republican) 66% Derek Hunsberger (Democratic) 31% |
| New Jersey 3 | Jim Saxton | Republican | 1984 | Incumbent re-elected. | √ Jim Saxton (Republican) 62% Steven Polansky (Democratic) 36% |
| New Jersey 4 | Chris Smith | Republican | 1980 | Incumbent re-elected. | √ Chris Smith (Republican) 63% Larry Schneider (Democratic) 35% |
| New Jersey 5 | Marge Roukema | Republican | 1980 | Incumbent re-elected. | √ Marge Roukema (Republican) 64% Mike Schneider (Democratic) 33% |
| New Jersey 6 | Frank Pallone | Democratic | 1988 | Incumbent re-elected. | √ Frank Pallone (Democratic) 57% Mike Ferguson (Republican) 41% Carl Mayer (Independent) 1% |
| New Jersey 7 | Bob Franks | Republican | 1992 | Incumbent re-elected. | √ Bob Franks (Republican) 53% Maryanne Connelly (Democratic) 45% |
| New Jersey 8 | Bill Pascrell | Democratic | 1996 | Incumbent re-elected. | √ Bill Pascrell (Democratic) 62% Matthew Kirnan (Republican) 36% |
| New Jersey 9 | Steve Rothman | Democratic | 1996 | Incumbent re-elected. | √ Steve Rothman (Democratic) 65% Steve Lonegan (Republican) 34% |
| New Jersey 10 | Don Payne | Democratic | 1988 | Incumbent re-elected. | √ Don Payne (Democratic) 84% William Wnuck (Republican) 11% |
| New Jersey 11 | Rodney Frelinghuysen | Republican | 1994 | Incumbent re-elected. | √ Rodney Frelinghuysen (Republican) 68% John Scollo (Democratic) 30% |
| New Jersey 12 | Mike Pappas | Republican | 1996 | Incumbent lost re-election. New member elected. Democratic gain. |
√ Rush D. Holt Jr. (Democratic) 51% Mike Pappas (Republican) 48% |
| New Jersey 13 | Bob Menendez | Democratic | 1992 | Incumbent re-elected. | √ Bob Menendez (Democratic) 81% Theresa De Leon (Republican) 17% |
New Mexico
| District | Incumbent | Party | First elected |
Results | Candidates |
|---|---|---|---|---|---|
| New Mexico 1 | Heather Wilson | Republican | June 23, 1998 (special) |
Incumbent re-elected. | √ Heather Wilson (Republican) 48.4% Philip Maloof (Democratic) 41.9% Robert Anderson (Green) 9.6% |
| New Mexico 2 | Joe Skeen | Republican | 1980 | Incumbent re-elected. | √ Joe Skeen (Republican) 57.9% Shirley Baca (Democratic) 42.1% |
| New Mexico 3 | Bill Redmond | Republican | 1997 | Incumbent lost re-election. New member elected. Democratic gain. |
√ Tom Udall (Democratic) 53.2% Bill Redmond (Republican) 43.2% Carol Miller (Green) 3.6 |
New York
| District | Incumbent | Party | First elected |
Results | Candidates |
|---|---|---|---|---|---|
| New York 1 | Michael Forbes | Republican | 1994 | Incumbent re-elected. | √ Michael Forbes (Republican) 64% William Holst (Democratic) 36% |
| New York 2 | Rick Lazio | Republican | 1992 | Incumbent re-elected. | √ Rick Lazio (Republican) 67% John Bace (Democratic) 30% |
| New York 3 | Peter King | Republican | 1992 | Incumbent re-elected. | √ Peter King (Republican) 65% Kevin Langberg (Democratic) 35% |
| New York 4 | Carolyn McCarthy | Democratic | 1996 | Incumbent re-elected. | √ Carolyn McCarthy (Democratic) 53% Gregory Becker (Republican) 47% |
| New York 5 | Gary Ackerman | Democratic | 1983 | Incumbent re-elected. | √ Gary Ackerman (Democratic) 65% David Pinzon (Republican) 34% |
| New York 6 | Gregory W. Meeks | Democratic | February 3, 1998 (Special) |
Incumbent re-elected. | √ Gregory W. Meeks (Democratic) Unopposed |
| New York 7 | Thomas J. Manton | Democratic | 1984 | Incumbent retired. New member elected. Democratic hold. |
√ Joseph Crowley (Democratic) 68% James Dillon (Republican) 28% |
| New York 8 | Jerrold Nadler | Democratic | 1992 | Incumbent re-elected. | √ Jerrold Nadler (Democratic) 86% Ted Howard (Republican) 14% |
| New York 9 | Charles Schumer | Democratic | 1980 | Incumbent retired to run for U.S. Senator. New member elected. Democratic hold. |
√ Anthony Weiner (Democratic) 66% Leslie Telano (Republican) 24% |
| New York 10 | Ed Towns | Democratic | 1982 | Incumbent re-elected. | √ Ed Towns (Democratic) 92% Ernestine Brown (Republican) 7% |
| New York 11 | Major Owens | Democratic | 1982 | Incumbent re-elected. | √ Major Owens (Democratic) 89% David Greene (Republican) 10% |
| New York 12 | Nydia Velazquez | Democratic | 1992 | Incumbent re-elected. | √ Nydia Velazquez (Democratic) 83% Rosemarie Markgraf (Republican) 13% |
| New York 13 | Vito Fossella | Republican | 1997 | Incumbent re-elected. | √ Vito Fossella (Republican) 66% Eugene Prisco (Democratic) 34% |
| New York 14 | Carolyn Maloney | Democratic | 1992 | Incumbent re-elected. | √ Carolyn Maloney (Democratic) 77% Stephanie Kupferman (Republican) 23% |
| New York 15 | Charles B. Rangel | Democratic | 1970 | Incumbent re-elected. | √ Charles B. Rangel (Democratic) 94% David Cunningham (Republican) 6% |
| New York 16 | Jose Serrano | Democratic | 1990 | Incumbent re-elected. | √ Jose Serrano (Democratic) 96% Thomas Bayley (Republican) 4% |
| New York 17 | Eliot Engel | Democratic | 1988 | Incumbent re-elected. | √ Eliot Engel (Democratic) 88% Peter Fiumefreddo (Republican) 12% |
| New York 18 | Nita Lowey | Democratic | 1988 | Incumbent re-elected. | √ Nita Lowey (Democratic) Unopposed |
| New York 19 | Sue Kelly | Republican | 1994 | Incumbent re-elected. | √ Sue Kelly (Republican) 63% Dick Collins (Democratic) 34% |
| New York 20 | Benjamin Gilman | Republican | 1972 | Incumbent re-elected. | √ Benjamin Gilman (Republican) 58% Paul Feiner (Democratic) 40% |
| New York 21 | Mike McNulty | Democratic | 1988 | Incumbent re-elected. | √ Mike McNulty (Democratic) 74% Lauren Ayers (Republican) 26% |
| New York 22 | Gerald Solomon | Republican | 1978 | Incumbent retired. New member elected. Republican hold. |
√ John Sweeney (Republican) 56% Jean Bordewich (Democratic) 43% |
| New York 23 | Sherwood Boehlert | Republican | 1982 | Incumbent re-elected. | √ Sherwood Boehlert (Republican) Unopposed |
| New York 24 | John McHugh | Republican | 1992 | Incumbent re-elected. | √ John McHugh (Republican) 79% Neil Tallon (Democratic) 21% |
| New York 25 | Jim Walsh | Republican | 1988 | Incumbent re-elected. | √ Jim Walsh (Republican) 69% Yvonne Rothenberg (Democratic) 31% |
| New York 26 | Maurice Hinchey | Democratic | 1992 | Incumbent re-elected. | √ Maurice Hinchey (Democratic) 62% William Walker (Republican) 31% Randall Terry (Independent) 7% |
| New York 27 | Bill Paxon | Republican | 1988 | Incumbent retired. New member elected. Republican hold. |
√ Tom Reynolds (Republican) 58% Bill Cook (Democratic) 42% |
| New York 28 | Louise Slaughter | Democratic | 1986 | Incumbent re-elected. | √ Louise Slaughter (Democratic) 65% Richard Kaplan (Republican) 31% |
| New York 29 | John LaFalce | Democratic | 1974 | Incumbent re-elected. | √ John LaFalce (Democratic) 58% Chris Collins (Republican) 41% |
| New York 30 | Jack Quinn | Republican | 1992 | Incumbent re-elected. | √ Jack Quinn (Republican) 68% Crystal Peoples (Democratic) 32% |
| New York 31 | Amo Houghton | Republican | 1986 | Incumbent re-elected. | √ Amo Houghton (Republican) 69% Caleb Rossiter (Democratic) 25% |
North Carolina
| District | Incumbent | Party | First elected |
Results | Candidates |
|---|---|---|---|---|---|
| North Carolina 1 | Eva Clayton | Democratic | 1992 | Incumbent re-elected. | √ Eva Clayton (Democratic) 63% Ted Tyler (Republican) 37% |
| North Carolina 2 | Bob Etheridge | Democratic | 1996 | Incumbent re-elected. | √ Bob Etheridge (Democratic) 58% Dan Page (Republican) 42% |
| North Carolina 3 | Walter Jones Jr. | Republican | 1994 | Incumbent re-elected. | √ Walter Jones Jr. (Republican) 62% Jon Williams (Democratic) 38% |
| North Carolina 4 | David Price | Democratic | 1986, 1996 |
Incumbent re-elected. | √ David Price (Democratic) 58% Tom Roberg (Republican) 42% |
| North Carolina 5 | Richard Burr | Republican | 1994 | Incumbent re-elected. | √ Richard Burr (Republican) 68% Mike Robinson (Democratic) 32% |
| North Carolina 6 | Howard Coble | Republican | 1984 | Incumbent re-elected. | √ Howard Coble (Republican) 88.6% Jeffrey D. Bentley (Libertarian) 11.4% |
| North Carolina 7 | Mike McIntyre | Democratic | 1996 | Incumbent re-elected. | √ Mike McIntyre (Democratic) 91.3% Paul Meadows (Libertarian) 8.7% |
| North Carolina 8 | Bill Hefner | Democratic | 1974 | Incumbent retired. New member elected. Republican gain. |
√ Robin Hayes (Republican) 51% Mike Taylor (Democratic) 49% |
| North Carolina 9 | Sue Myrick | Republican | 1994 | Incumbent re-elected. | √ Sue Myrick (Republican) 69% Rory Blake (Democratic) 30% |
| North Carolina 10 | Cass Ballenger | Republican | 1986 | Incumbent re-elected. | √ Cass Ballenger (Republican) 85.6% Deborah Garrett Eddins (Libertarian) 14.4% |
| North Carolina 11 | Charles Taylor | Republican | 1990 | Incumbent re-elected. | √ Charles Taylor (Republican) 57% David Young (Democratic) 43% |
| North Carolina 12 | Mel Watt | Democratic | 1992 | Incumbent re-elected. | √ Mel Watt (Democratic) 56% Scott Keadle (Republican) 43% |
North Dakota
| District | Incumbent | Party | First elected |
Results | Candidates |
|---|---|---|---|---|---|
| North Dakota at-large | Earl Pomeroy | Democratic-NPL | 1992 | Incumbent re-elected. |
|
Ohio
| District | Incumbent | Party | First elected |
Results | Candidates |
|---|---|---|---|---|---|
| Ohio 1 | Steve Chabot | Republican | 1994 | Incumbent re-elected. | √ Steve Chabot (Republican) 53% Roxanne Qualls (Democratic) 47% |
| Ohio 2 | Robert J. Portman | Republican | 1993 | Incumbent re-elected. | √ Robert J. Portman (Republican) 76% Charles W. Sanders (Democratic) 24% |
| Ohio 3 | Tony P. Hall | Democratic | 1978 | Incumbent re-elected. | √ Tony P. Hall (Democratic) 69% John Shondel (Republican) 31% |
| Ohio 4 | Michael G. Oxley | Republican | 1981 | Incumbent re-elected. | √ Michael G. Oxley (Republican) 64% Paul McClain (Democratic) 36% |
| Ohio 5 | Paul E. Gillmor | Republican | 1988 | Incumbent re-elected. | √ Paul E. Gillmor (Republican) 67% Susan Darrow (Democratic) 33% |
| Ohio 6 | Ted Strickland | Democratic | 1992 | Incumbent re-elected. | √ Ted Strickland (Democratic) 57% Nancy Hollister (Republican) 43% |
| Ohio 7 | David L. Hobson | Republican | 1990 | Incumbent re-elected. | √ David L. Hobson (Republican) 68% Donald Minor (Democratic) 28% |
| Ohio 8 | John A. Boehner | Republican | 1990 | Incumbent re-elected. | √ John A. Boehner (Republican) 71% John Griffin (Democratic) 29% |
| Ohio 9 | Marcia C. Kaptur | Democratic | 1982 | Incumbent re-elected. | √ Marcia C. Kaptur (Democratic) 81% Edward Emery (Republican) 19% |
| Ohio 10 | Dennis J. Kucinich | Democratic | 1996 | Incumbent re-elected. | √ Dennis J. Kucinich (Democratic) 67% Joe Slovenec (Republican) 33% |
| Ohio 11 | Louis Stokes | Democratic | 1968 | Incumbent retired. New member elected. Democratic hold. |
√ Stephanie Tubbs Jones (Democratic) 80% James Hereford (Republican) 14% |
| Ohio 12 | John Kasich | Republican | 1982 | Incumbent re-elected. | √ John Kasich (Republican) 67% Edward S. Brown (Democratic) 33% |
| Ohio 13 | Sherrod Brown | Democratic | 1992 | Incumbent re-elected. | √ Sherrod Brown (Democratic) 62% Crace Drake (Republican) 38% |
| Ohio 14 | Tom Sawyer | Democratic | 1986 | Incumbent re-elected. | √ Tom Sawyer (Democratic) 63% Tom Watkins (Republican) 37% |
| Ohio 15 | Deborah D. Pryce | Republican | 1992 | Incumbent re-elected. | √ Deborah D. Pryce (Republican) 60% Adam Miller (Democratic) 27% |
| Ohio 16 | Ralph S. Regula | Republican | 1972 | Incumbent re-elected. | √ Ralph S. Regula (Republican) 64% Peter Ferguson (Democratic) 36% |
| Ohio 17 | James Traficant | Democratic | 1984 | Incumbent re-elected. | √ James Traficant (Democratic) 68% Paul Alberty (Republican) 32% |
| Ohio 18 | Robert W. Ney | Republican | 1994 | Incumbent re-elected. | √ Robert W. Ney (Republican) 60% Rob Burch (Democratic) 40% |
| Ohio 19 | Steven C. LaTourette | Republican | 1994 | Incumbent re-elected. | √ Steven C. LaTourette (Republican) 66% Elizabeth Kelley (Democratic) 34% |
Oklahoma
| District | Incumbent | Party | First elected |
Results | Candidates |
|---|---|---|---|---|---|
| Oklahoma 1 | Steve Largent | Republican | 1994 | Incumbent re-elected. | √ Steve Largent (Republican) 62% Howard Plowman (Democratic) 38% |
| Oklahoma 2 | Tom Coburn | Republican | 1994 | Incumbent re-elected. | √ Tom Coburn (Republican) 58% Kent Pharaoh (Democratic) 40% |
| Oklahoma 3 | Wes Watkins | Republican | 1976, 1996 |
Incumbent re-elected. | √ Wes Watkins (Republican) 62% Walt Roberts (Democratic) 38% |
| Oklahoma 4 | J. C. Watts | Republican | 1994 | Incumbent re-elected. | √ J. C. Watts (Republican) 62% Ben Odom (Democratic) 38% |
| Oklahoma 5 | Ernest Istook | Republican | 1992 | Incumbent re-elected. | √ Ernest Istook (Republican) 68% Ben Smothermon (Democratic) 32% |
| Oklahoma 6 | Frank Lucas | Republican | 1994 | Incumbent re-elected. | √ Frank Lucas (Republican) 65% Paul Barby (Democratic) 34% |
Oregon
| District | Incumbent | Party | First elected |
Results | Candidates |
|---|---|---|---|---|---|
| Oregon 1 | Elizabeth Furse | Democratic | 1992 | Incumbent retired. New member elected. Democratic hold. |
√ David Wu (Democratic) 50% Molly Bordonaro (Republican) 47% |
| Oregon 2 | Bob Smith | Republican | 1996 | Incumbent retired. New member elected. Republican hold. |
√ Greg Walden (Republican) 61% Kevin M. Campbell (Democratic) 35% Lindsay Bradshaw (Libertarian) 2% Rohn (Grandpa) Webb (S) 1% |
| Oregon 3 | Earl Blumenauer | Democratic | 1996 | Incumbent re-elected. | √ Earl Blumenauer (Democratic) 84% Bruce Alexander Knight (Libertarian) 9% Walter F. Brown (S) 6% |
| Oregon 4 | Peter DeFazio | Democratic | 1986 | Incumbent re-elected. | √ Peter DeFazio (Democratic) 70% Steve J. Webb (Republican) 29% |
| Oregon 5 | Darlene Hooley | Democratic | 1996 | Incumbent re-elected. | √ Darlene Hooley (Democratic) 55% Marylin Shannon (Republican) 40% |
Pennsylvania
| District | Incumbent | Party | First elected |
Results | Candidates |
|---|---|---|---|---|---|
| Pennsylvania 1 | Bob Brady | Democratic | May 19, 1998 (special) |
Incumbent re-elected. | √ Bob Brady (Democratic) 81% William Harrison (Republican) 17% |
| Pennsylvania 2 | Chaka Fattah | Democratic | 1994 | Incumbent re-elected. | √ Chaka Fattah (Democratic) 86% Anne Marie Mulligan (Republican) 14% |
| Pennsylvania 3 | Robert Borski | Democratic | 1982 | Incumbent re-elected. | √ Robert Borski (Democratic) 60% Charles Dougherty (Republican) 40% |
| Pennsylvania 4 | Ron Klink | Democratic | 1992 | Incumbent re-elected. | √ Ron Klink (Democratic) 64% Mike Turzai (Republican) 36% |
| Pennsylvania 5 | John E. Peterson | Republican | 1996 | Incumbent re-elected. | √ John E. Peterson (Republican) 85% William M. Belitskus (Green) 15% |
| Pennsylvania 6 | Tim Holden | Democratic | 1992 | Incumbent re-elected. | √ Tim Holden (Democratic) 61% John Meckley (Republican) 39% |
| Pennsylvania 7 | Curt Weldon | Republican | 1986 | Incumbent re-elected. | √ Curt Weldon (Republican) 72% Martin D'Urso (Democratic) 28% |
| Pennsylvania 8 | Jim Greenwood | Republican | 1992 | Incumbent re-elected. | √ Jim Greenwood (Republican) 64% Bill Tuthill (Democratic) 33% |
| Pennsylvania 9 | Bud Shuster | Republican | 1972 | Incumbent re-elected. | √ Bud Shuster (Republican) Unopposed |
| Pennsylvania 10 | Joe McDade | Republican | 1962 | Incumbent retired. New member elected. Republican hold. |
√ Don Sherwood (Republican) 49% Patrick Casey (Democratic) 49% |
| Pennsylvania 11 | Paul Kanjorski | Democratic | 1984 | Incumbent re-elected. | √ Paul Kanjorski (Democratic) 67% Stephen Urban (Republican) 33% |
| Pennsylvania 12 | John Murtha | Democratic | 1974 | Incumbent re-elected. | √ John Murtha (Democratic) 68% Timothy Holloway (Republican) 32% |
| Pennsylvania 13 | Jon D. Fox | Republican | 1994 | Incumbent lost re-election. New member elected. Democratic gain. |
√ Joe Hoeffel (Democratic) 52% Jon D. Fox (Republican) 47% |
| Pennsylvania 14 | William Coyne | Democratic | 1980 | Incumbent re-elected. | √ William Coyne (Democratic) 61% Bill Ravotti (Republican) 39% |
| Pennsylvania 15 | Paul McHale | Democratic | 1992 | Incumbent retired. New member elected. Republican gain. |
√ Pat Toomey (Republican) 55% Roy Afflerbach (Democratic) 45% |
| Pennsylvania 16 | Joe Pitts | Republican | 1996 | Incumbent re-elected. | √ Joe Pitts (Republican) 71% Robert Yorczyk (Democratic) 29% |
| Pennsylvania 17 | George Gekas | Republican | 1982 | Incumbent re-elected. | √ George Gekas (Republican) Unopposed |
| Pennsylvania 18 | Mike Doyle | Democratic | 1994 | Incumbent re-elected. | √ Mike Doyle (Democratic) 68% Dick Walker (Republican) 32% |
| Pennsylvania 19 | Bill Goodling | Republican | 1974 | Incumbent re-elected. | √ Bill Goodling (Republican) 68% Linda Ropp (Democratic) 29% |
| Pennsylvania 20 | Frank Mascara | Democratic | 1994 | Incumbent re-elected. | √ Frank Mascara (Democratic) Unopposed |
| Pennsylvania 21 | Phil English | Republican | 1994 | Incumbent re-elected. | √ Phil English (Republican) 63% Larry Klemens (Democratic) 37% |
Rhode Island
| District | Incumbent | Party | First elected |
Results | Candidates |
|---|---|---|---|---|---|
| Rhode Island 1 | Patrick Kennedy | Democratic | 1994 | Incumbent re-elected. | √ Patrick Kennedy (Democratic) 66.8% Joe Santa (Republican) 27.7% James C. Sheehan (Reform) 4.5% Charles Picerno (Independent) 1% |
| Rhode Island 2 | Robert Weygand | Democratic | 1996 | Incumbent re-elected. | √ Robert Weygand (Democratic) 72% John Matson (Republican) 24.8% Timothy L. Miller (Reform) 3.2% |
South Carolina
| District | Incumbent | Party | First elected |
Results | Candidates |
|---|---|---|---|---|---|
| South Carolina 1 | Mark Sanford | Republican | 1994 | Incumbent re-elected. | √ Mark Sanford (Republican) 91% Joe Innella (Natural Law) 8.9% |
| South Carolina 2 | Floyd Spence | Republican | 1970 | Incumbent re-elected. | √ Floyd Spence (Republican) 58% Jane Frederick (Democratic) 41% Maurice Raiford (Natural Law) 1% |
| South Carolina 3 | Lindsey Graham | Republican | 1994 | Incumbent re-elected. | √ Lindsey Graham (Republican) Unopposed |
| South Carolina 4 | Bob Inglis | Republican | 1992 | Incumbent retired to run for U.S. Senator. New member elected. Republican hold. |
√ Jim DeMint (Republican) 57.7% Glenn Reese (Democratic) 40.2% C. Faye Walters (Natural Law) 1.1% Peter J. Ashy (Patriot) 0.5% |
| South Carolina 5 | John Spratt | Democratic | 1982 | Incumbent re-elected. | √ John Spratt (Democratic) 58% Mike Burkhold (Republican) 40.2% Dianne Nevins (Natural Law) 1.7% |
| South Carolina 6 | Jim Clyburn | Democratic | 1992 | Incumbent re-elected. | √ Jim Clyburn (Democratic) 72.6% Gary McLeod (Republican) 25.8% George C. Taylor (Natural Law) 1.6% |
South Dakota
| District | Incumbent | Party | First elected |
Results | Candidates |
|---|---|---|---|---|---|
| South Dakota at-large | John Thune | Republican | 1996 | Incumbent re-elected. | √ John Thune (Republican) 75.1% Jeff Moser (Democratic) 24.9% |
Tennessee
| District | Incumbent | Party | First elected |
Results | Candidates |
|---|---|---|---|---|---|
| Tennessee 1 | William L. Jenkins | Republican | 1996 | Incumbent re-elected. | √ William L. Jenkins (Republican) 69% Kay White (Democratic) 31% |
| Tennessee 2 | Jimmy Duncan Jr. | Republican | 1988 | Incumbent re-elected. | √ Jimmy Duncan Jr. (Republican) Unopposed |
| Tennessee 3 | Zach Wamp | Republican | 1994 | Incumbent re-elected. | √ Zach Wamp (Republican) 67% Lewis Lewis (Democratic) 33% |
| Tennessee 4 | Van Hilleary | Republican | 1994 | Incumbent re-elected. | √ Van Hilleary (Republican) 60% Jerry D. Cooper (Democratic) 40% |
| Tennessee 5 | Bob Clement | Democratic | 1988 | Incumbent re-elected. | √ Bob Clement (Democratic) 83% |
| Tennessee 6 | Bart Gordon | Democratic | 1984 | Incumbent re-elected. | √ Bart Gordon (Democratic) 55% Walt Massey (Republican) 45% |
| Tennessee 7 | Ed Bryant | Republican | 1994 | Incumbent re-elected. | √ Ed Bryant (Republican) Unopposed |
| Tennessee 8 | John Tanner | Democratic | 1988 | Incumbent re-elected. | √ John Tanner (Democratic) Unopposed |
| Tennessee 9 | Harold Ford Jr. | Democratic | 1996 | Incumbent re-elected. | √ Harold Ford Jr. (Democratic) 79% Claude Burdikoff (Republican) 19% |
Texas
| District | Incumbent | Party | First elected |
Results | Candidates |
|---|---|---|---|---|---|
| Texas 1 | Max Sandlin | Democratic | 1996 | Incumbent re-elected. | √ Max Sandlin (Democratic) 59.4% Dennis Boerner (Republican) 40.6% |
| Texas 2 | Jim Turner | Democratic | 1996 | Incumbent re-elected. | Jim Turner (Democratic) 58.4% Brian Babin (Republican) 40.8% Wendell Drye (Libertarian) 0.8% |
| Texas 3 | Sam Johnson | Republican | 1991 | Incumbent re-elected. | √ Sam Johnson (Republican) 91.2% Ken Ashby (Libertarian) 8.8% |
| Texas 4 | Ralph Hall | Democratic | 1980 | Incumbent re-elected. | √ Ralph Hall (Democratic) 57.6% Jim Lohmeyer (Republican) 40.9% Jim Simon (Libertarian) 1.5% |
| Texas 5 | Pete Sessions | Republican | 1996 | Incumbent re-elected. | √ Pete Sessions (Republican) 55.8% Victor Morales (Democratic) 43.4% Michael Needleman (Libertarian) 0.8% |
| Texas 6 | Joe Barton | Republican | 1984 | Incumbent re-elected. | √ Joe Barton (Republican) 72.9% Ben Boothe (Democratic) 25.9% Richard A. Bandlow (Libertarian) 1.2% |
| Texas 7 | Bill Archer | Republican | 1970 | Incumbent re-elected. | √ Bill Archer (Republican) 93.3% Drew Parks (Libertarian) 6.6% |
| Texas 8 | Kevin Brady | Republican | 1996 | Incumbent re-elected. | √ Kevin Brady (Republican) 92.8% Don Richards (Libertarian) 7.2% |
| Texas 9 | Nick Lampson | Democratic | 1996 | Incumbent re-elected. | √ Nick Lampson (Democratic) 63.7% Tom Cottar (Republican) 36.3% |
| Texas 10 | Lloyd Doggett | Democratic | 1994 | Incumbent re-elected. | √ Lloyd Doggett (Democratic) 85.2% Vincent J. May (Libertarian) 14.8% |
| Texas 11 | Chet Edwards | Democratic | 1990 | Incumbent re-elected. | √ Chet Edwards (Democratic) 82.4% Vince Hanke (Libertarian) 17.6% |
| Texas 12 | Kay Granger | Republican | 1996 | Incumbent re-elected. | √ Kay Granger (Republican) 61.9% Tom Hall (Democratic) 36.3% Paul Barthel (Libertarian) 1.8% |
| Texas 13 | Mac Thornberry | Republican | 1994 | Incumbent re-elected. | √ Mac Thornberry (Republican) 67.9% Mark Harmon (Democratic) 31% Georganne Baker Payne (Libertarian) 1.1% |
| Texas 14 | Ron Paul | Republican | 1996 | Incumbent re-elected. | √ Ron Paul (Republican) 55.3% Loy Sneary (Democratic) 44.5% |
| Texas 15 | Ruben Hinojosa | Democratic | 1996 | Incumbent re-elected. | √ Ruben Hinojosa (Democratic) 58.4% Tom Haughey (Republican) 41.6% |
| Texas 16 | Silvestre Reyes | Democratic | 1996 | Incumbent re-elected. | √ Silvestre Reyes (Democratic) 87.9% Stu Nance (Libertarian) 6.9% Lorenzo Morales (Independent) 5.1% |
| Texas 17 | Charles Stenholm | Democratic | 1978 | Incumbent re-elected. | √ Charles Stenholm (Democratic) 53.6% Rudy Izzard (Republican) 45.3% Gordon Mobley (Libertarian) 1.1% |
| Texas 18 | Sheila Jackson Lee | Democratic | 1994 | Incumbent re-elected. | √ Sheila Jackson Lee (Democratic) 89.9% James Galvan (Libertarian) 10.1% |
| Texas 19 | Larry Combest | Republican | 1984 | Incumbent re-elected. | √ Larry Combest (Republican) 83.6% Sidney Blankenship (Democratic) 16.4% |
| Texas 20 | Henry Gonzalez | Democratic | 1961 | Incumbent retired. New member elected. Democratic hold. |
√ Charlie Gonzalez (Democratic) 63.2% James Walker (Republican) 35.6% Alejandro (Alex) DePeña (Libertarian) 1.3% |
| Texas 21 | Lamar S. Smith | Republican | 1986 | Incumbent re-elected. | √ Lamar S. Smith (Republican) 91.4% Jeffrey Charles Blunt (Libertarian) 8.6% |
| Texas 22 | Tom DeLay | Republican | 1984 | Incumbent re-elected. | √ Tom DeLay (Republican) 66% Hill Kemp (Democratic) 34% |
| Texas 23 | Henry Bonilla | Republican | 1992 | Incumbent re-elected. | √ Henry Bonilla (Republican) 64% Charlie Jones (Democratic) 36% |
| Texas 24 | Martin Frost | Democratic | 1978 | Incumbent re-elected. | √ Martin Frost (Democratic) 58% Shawn Terry (Republican) 34.2% |
| Texas 25 | Ken Bentsen | Democratic | 1994 | Incumbent re-elected. | √ Ken Bentsen (Democratic) 58% John Sanchez (Republican) 42% |
| Texas 26 | Dick Armey | Republican | 1984 | Incumbent re-elected. | √ Dick Armey (Republican) 88.1% Joe Turner (Libertarian) 11.9% |
| Texas 27 | Solomon Ortiz | Democratic | 1982 | Incumbent re-elected. | √ Solomon Ortiz (Democratic) 64% Erol Stone (Republican) 36% |
| Texas 28 | Ciro Rodriguez | Democratic | 1997 | Incumbent re-elected. | √ Ciro Rodriguez (Democratic) 90.5% Edward Elmer (Libertarian) 9.5% |
| Texas 29 | Gene Green | Democratic | 1992 | Incumbent re-elected. | √ Gene Green (Democratic) 92.8% Lea Sherman (Independent) 4.2% James P. Chudleigh (Libertarian) 3% |
| Texas 30 | Eddie Bernice Johnson | Democratic | 1992 | Incumbent re-elected. | √ Eddie Bernice Johnson (Democratic) 70% Carrie Kelleher (Republican) 30% |
Utah
| District | Incumbent | Party | First elected |
Results | Candidates |
|---|---|---|---|---|---|
| Utah 1 | James V. Hansen | Republican | 1980 | Incumbent re-elected. | √ James V. Hansen (Republican) 67.7% Steve Beierlein (Democratic) 30.4% Gerard Arthus (Libertarian) 1.9% |
| Utah 2 | Merrill Cook | Republican | 1996 | Incumbent re-elected. | √ Merrill Cook (Republican) 52.7% Lily Eskelsen García (Democratic) 43.4% Ken Larsen (Independent) 2.3% Brian E. Swim (Libertarian) 0.8% Arly H. Pedersen (U.S. Taxpayers) 0.5% Robert C. Lesh (Natural Law) 0.3% |
| Utah 3 | Chris Cannon | Republican | 1996 | Incumbent re-elected. | √ Chris Cannon (Republican) 76.9% Will Christensen (U.S. Taxpayers) 15.8% Kitty Burton (Libertarian) 7.3% |
Vermont
| District | Incumbent | Party | First elected |
Results | Candidates |
|---|---|---|---|---|---|
| Vermont at-large | Bernard Sanders | Independent | 1990 | Incumbent re-elected. | √ Bernard Sanders (Independent) 63.4% Mark Candon (Republican) 32.9% Matthew Mulligan (Grassroots) 1.6% Pete Diamondstone (Liberty Union) 1% Robert Maynard (Libertarian) 1% |
Virginia
| District | Incumbent | Party | First elected |
Results | Candidates |
|---|---|---|---|---|---|
| Virginia 1 | Herb Bateman | Republican | 1982 | Incumbent re-elected. | √ Herb Bateman (Republican) 76.4% Bradford L. Phillips (Independent) 13.2% Josh Billings (Independent) 9.5% |
| Virginia 2 | Owen B. Pickett | Democratic | 1986 | Incumbent re-elected. | √ Owen B. Pickett (Democratic) Unopposed |
| Virginia 3 | Bobby Scott | Democratic | 1992 | Incumbent re-elected. | √ Bobby Scott (Democratic) 76% Robert S. Barnett (Independent) 22.8% |
| Virginia 4 | Norman Sisisky | Democratic | 1982 | Incumbent re-elected. | √ Norman Sisisky (Democratic) Unopposed |
| Virginia 5 | Virgil Goode | Democratic | 1996 | Incumbent re-elected. | √ Virgil Goode (Democratic) Unopposed |
| Virginia 6 | Bob Goodlatte | Republican | 1992 | Incumbent re-elected. | √ Bob Goodlatte (Republican) 69.3% David A. Bowers (Democratic) 30.7% |
| Virginia 7 | Thomas J. Bliley Jr. | Republican | 1980 | Incumbent re-elected. | √ Thomas J. Bliley Jr. (Republican) 78.7% Bradley E. Evans (Independent) 20.7% |
| Virginia 8 | Jim Moran | Democratic | 1990 | Incumbent re-elected. | √ Jim Moran (Democratic) 66.7% Demaris H. Miller (Republican) 33.1% |
| Virginia 9 | Rick Boucher | Democratic | 1982 | Incumbent re-elected. | √ Rick Boucher (Democratic) 60.9% J. A. Barta (Republican) 39.1% |
| Virginia 10 | Frank Wolf | Republican | 1980 | Incumbent re-elected. | √ Frank Wolf (Republican) 71.6% Cornell W. Brooks (Democratic) 25.2% Robert A. Buchanan (Independent) 3.1% |
| Virginia 11 | Thomas M. Davis | Republican | 1994 | Incumbent re-elected. | √ Thomas M. Davis (Republican) 81.7% C. W. Levy (Independent) 16.8% |
Washington
| District | Incumbent | Party | First elected |
Results | Candidates |
|---|---|---|---|---|---|
| Washington 1 | Rick White | Republican | 1994 | Incumbent lost re-election. New member elected. Democratic gain. |
√ Jay Inslee (Democratic) 49.8% Rick White (Republican) 44.1% Bruce Craswell (American Heritage) 6.1% |
| Washington 2 | Jack Metcalf | Republican | 1994 | Incumbent re-elected. | √ Jack Metcalf (Republican) 55.2% Grethe Cammermeyer (Democratic) 44.8% |
| Washington 3 | Linda Smith | Republican | 1994 | Incumbent retired to run for U.S. Senator. New member elected. Democratic gain. |
√ Brian Baird (Democratic) 54.7% Don Benton (Republican) 45.3% |
| Washington 4 | Doc Hastings | Republican | 1994 | Incumbent re-elected. | √ Doc Hastings (Republican) 69.1% Gordon Pross (Democratic) 24.4% Peggy S. McKerlie (Reform) 6.5% |
| Washington 5 | George Nethercutt | Republican | 1994 | Incumbent re-elected. | √ George Nethercutt (Republican) 56.9% Brad Lyons (Democratic) 38.1% John Beal (American Heritage) 5% |
| Washington 6 | Norm Dicks | Democratic | 1976 | Incumbent re-elected. | √ Norm Dicks (Democratic) 68.4% Bob Lawrence (Republican) 31.6% |
| Washington 7 | Jim McDermott | Democratic | 1988 | Incumbent re-elected. | √ Jim McDermott (Democratic) 88.2% Stan Lippmann (Reform) 9.4% Jeff Powers (Socialist Workers) 2.4% |
| Washington 8 | Jennifer Dunn | Republican | 1992 | Incumbent re-elected. | √ Jennifer Dunn (Republican) 59.7% Heidi Behrens-Benedict (Democratic) 40.3% |
| Washington 9 | Adam Smith | Democratic | 1996 | Incumbent re-elected. | √ Adam Smith (Democratic) 64.7% Ron Taber (Republican) 35.3% |
West Virginia
| District | Incumbent | Party | First elected |
Results | Candidates |
|---|---|---|---|---|---|
| West Virginia 1 | Alan Mollohan | Democratic | 1982 | Incumbent re-elected. | √ Alan Mollohan (Democratic) 84.7% Richard Kerr (Libertarian) 15.3% |
| West Virginia 2 | Bob Wise | Democratic | 1982 | Incumbent re-elected. | √ Bob Wise (Democratic) 73% Sally Anne Kay (Republican) 21.4% John Brown (Libertarian) 5.6% |
| West Virginia 3 | Nick Rahall | Democratic | 1976 | Incumbent re-elected. | √ Nick Rahall (Democratic) 86.6% Joe Whelan (Libertarian) 13.4% |
Wisconsin
| District | Incumbent | Party | First elected |
Results | Candidates |
|---|---|---|---|---|---|
| Wisconsin 1 | Mark Neumann | Republican | 1994 | Incumbent retired to run for U.S. Senator. New member elected. Republican hold. |
√ Paul Ryan (Republican) 57.1% Lydia Spottswood (Democratic) 42.7% |
| Wisconsin 2 | Scott Klug | Republican | 1990 | Incumbent retired. New member elected. Democratic gain. |
√ Tammy Baldwin (Democratic) 52.5% Josephine Musser (Republican) 47.4% |
| Wisconsin 3 | Ron Kind | Democratic | 1996 | Incumbent re-elected. | √ Ron Kind (Democratic) 71.5% Troy Brechler (Republican) 28.4% |
| Wisconsin 4 | Jerry Kleczka | Democratic | 1984 | Incumbent re-elected. | √ Jerry Kleczka (Democratic) 57.9% Tom Reynolds (Republican) 42% |
| Wisconsin 5 | Tom Barrett | Democratic | 1992 | Incumbent re-elected. | √ Tom Barrett (Democratic) 78.2% Jack Melvin (Republican) 21.6% |
| Wisconsin 6 | Tom Petri | Republican | 1979 | Incumbent re-elected. | √ Tom Petri (Republican) 92.6% Timothy Farness (U.S. Taxpayers) 7.2% |
| Wisconsin 7 | Dave Obey | Democratic | 1969 | Incumbent re-elected. | √ Dave Obey (Democratic) 60.6% Scott West (Republican) 39.3% |
| Wisconsin 8 | Jay W. Johnson | Democratic | 1996 | Incumbent lost re-election. New member elected. Republican gain. |
√ Mark Green (Republican) 55.6% Jay W. Johnson (Democratic) 45.4% |
| Wisconsin 9 | James Sensenbrenner | Republican | 1979 | Incumbent re-elected. | √ James Sensenbrenner (Republican) 91.3% Jeffrey Gonyo (Independent) 8.5% Anthony Deiss (U.S. Taxpayers) 0% (Write-in) |
Wyoming
| District | Incumbent | Party | First elected |
Results | Candidates |
|---|---|---|---|---|---|
| Wyoming at-large | Barbara Cubin | Republican | 1994 | Incumbent re-elected. | √ Barbara Cubin (Republican) 57.8% Scott Farris (Democratic) 38.7% Steve Richardson (Libertarian) 3.5% |
See also
References
- Wattenberg; Martin P. "The Democrats' Decline in the House during the Clinton Presidency: An Analysis of Partisan Swings" Presidential Studies Quarterly, Vol. 29, 1999
External links
- "Election Results". Office of the Clerk U.S. House of Representatives.