United States House of Representatives elections, 1996
|
| |||||||||||||||||||||||||||||||||||||||||||||||||||||||||||
| |||||||||||||||||||||||||||||||||||||||||||||||||||||||||||
All 435 seats to the United States House of Representatives 218 seats were needed for a majority | |||||||||||||||||||||||||||||||||||||||||||||||||||||||||||
|---|---|---|---|---|---|---|---|---|---|---|---|---|---|---|---|---|---|---|---|---|---|---|---|---|---|---|---|---|---|---|---|---|---|---|---|---|---|---|---|---|---|---|---|---|---|---|---|---|---|---|---|---|---|---|---|---|---|---|---|
| |||||||||||||||||||||||||||||||||||||||||||||||||||||||||||
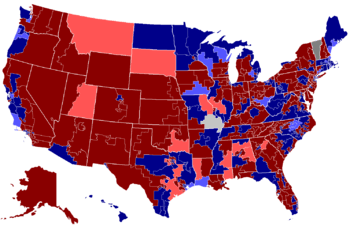 Results:
Democratic hold
Democratic pickup
Republican hold
Republican pickup
Independent hold
Independent pickup | |||||||||||||||||||||||||||||||||||||||||||||||||||||||||||
| |||||||||||||||||||||||||||||||||||||||||||||||||||||||||||
The 1996 United States House of Representatives elections was an election for the U.S. House of Representatives on November 5, 1996, which coincided with the re-election of President Bill Clinton. Democrats won by almost 60,000 votes (0.07%) and gained a net of two[3][4] seats from the Republicans, but the Republicans retained an overall majority of seats in the House for the first time since 1928.
Although the Republicans lost 3 seats, 1 of them included an Independent who would caucus with them and switch to the Republicans. This resulted in a 227 Republican majority to the Democrat's 208 minority which also included an Independent caucusing with them.
The election is similar to the 1952 elections, although, in terms of the total vote this result remains one of the closest in U.S. history.
Notable freshmen included future Senators Jerry Moran, Debbie Stabenow, Roy Blunt, John E. Sununu, and John Thune, future Governor of Arkansas Asa Hutchinson, future Governor of Illinois Rod Blagojevich, future Governor of Nevada Jim Gibbons, future Governor of Alabama Bob Riley, former Mayor of Cleveland and future Presidential candidate Dennis Kucinich, former Lieutenant Governor of Rhode Island Robert Weygand, and future Constitution Party Presidential nominee Virgil Goode.
Results summary
| 206 | 2 | 227 |
| Democratic | I | Republican |
| Party | Seats | Seat percentage |
Vote percentage |
Popular vote | ||||
|---|---|---|---|---|---|---|---|---|
| 1994 | Elected | Net Change | ||||||
| Democratic Party | 204 | 206 | 47.4% | 48.2% | 43,507,586 | |||
| Republican Party | 230 | 227 | 52.4% | 48.2% | 43,447,962 | |||
| Libertarian Party | 0 | 0 | 0.0% | 0.7% | 651,448 | |||
| Independent | 1 | 2 | 0.2% | 0.6% | 572,746 | |||
| Natural Law Party | 0 | 0 | 0.0% | 0.6% | 518,413 | |||
| Reform Party | 0 | 0 | 0.0% | 0.2% | 178,475 | |||
| U.S. Taxpayers' Party | 0 | 0 | 0.0% | 0.1% | 54,054 | |||
| Independence Party | 0 | 0 | 0.0% | 0.1% | 48,272 | |||
| Peace and Freedom Party | 0 | 0 | 0.0% | 0.1% | 48,136 | |||
| Green Party | 0 | 0 | 0.0% | <0.1% | 42,510 | |||
| Right to Life Party | 0 | 0 | 0.0% | <0.1% | 37,154 | |||
| Conservative Party | 0 | 0 | 0.0% | <0.1% | 33,458 | |||
| Independent American Party | 0 | 0 | 0.0% | <0.1% | 20,148 | |||
| Liberal Party | 0 | 0 | 0.0% | <0.1% | 19,763 | |||
| Grassroots Party | 0 | 0 | 0.0% | <0.1% | 18,067 | |||
| Americans Party | 0 | 0 | 0.0% | <0.1% | 7,428 | |||
| Socialist Party | 0 | 0 | 0.0% | <0.1% | 7,092 | |||
| Socialist Workers Party | 0 | 0 | 0.0% | <0.1% | 6,537 | |||
| Francis Worley Congress Party | 0 | 0 | 0.0% | <0.1% | 3,194 | |||
| Workers World Party | 0 | 0 | 0.0% | <0.1% | 2,704 | |||
| Independent Grassroots Party | 0 | 0 | 0.0% | <0.1% | 2,696 | |||
| Working Class Party | 0 | 0 | 0.0% | <0.1% | 2,534 | |||
| Liberty Union Party | 0 | 0 | 0.0% | <0.1% | 1,965 | |||
| Socialist Equality Party | 0 | 0 | 0.0% | <0.1% | 1,871 | |||
| Others | 0 | 0 | 0.0% | 1.1% | 999,254 | |||
| Totals | 435 | 435 | 100.0% | 100.0% | 90,233,467 | |||
| Source: Election Statistics - Office of the Clerk | ||||||||
[[File:105 us house membership.png|thumb|400px|
|
[[File:105 us house changes.png|thumb|400px|
| ||||||||||||||||||
Retiring incumbents
40 incumbents retired: 29 Democrats and 21 Republicans, giving the Republicans a net gain of 6 seats from the Democrats.
Democrats
Democratic hold
- Arkansas's 1st congressional district: Blanche Lincoln
- Arkansas's 2nd congressional district: Ray Thornton
- California's 24th congressional district: Anthony C. Beilenson
- Colorado's 1st congressional district: Patricia Schroeder
- Florida's 2nd congressional district: Pete Peterson
- Florida's 11th congressional district: Sam Gibbons
- Florida's 19th congressional district: Harry Johnston
- Illinois's 7th congressional district: Cardiss Collins
- Indiana's 10th congressional district: Andrew Jacobs, Jr.
- Massachusetts's 10th congressional district: Gerry Studds
- New Jersey's 9th congressional district: Robert Torricelli, to run for U.S. Senate
- North Carolina's 7th congressional district: Charlie Rose
- Rhode Island's 2nd congressional district: Jack Reed, to run for U.S. Senate
- Tennessee's 9th congressional district: Harold Ford, Sr.
- Texas's 1st congressional district: Jim Chapman, to run for U.S. Senate
- Texas's 2nd congressional district: Charlie Wilson
- Texas's 15th congressional district: Kika de la Garza
- Texas's 16th congressional district: Ronald D. Coleman
- Virginia's 5th congressional district: Lewis Payne
Republican gain
- Alabama's 3rd congressional district: Glen Browder, to run for U.S. Senate
- Alabama's 4th congressional district: Tom Bevill
- Illinois's 20th congressional district: Dick Durbin, to run for U.S. Senate
- Louisiana's 5th congressional district: Cleo Fields
- Mississippi's 3rd congressional district: Sonny Montgomery
- Montana's at-large congressional district: Rick Hill
- Oklahoma's 3rd congressional district: William K. Brewster
- South Dakota's at-large congressional district: Tim Johnson, to run for U.S. Senate
- Texas's 5th congressional district: John Bryant, to run for U.S. Senate
- Texas's 12th congressional district: Pete Geren
Republicans
Republican hold
- Arkansas's 3rd congressional district: Tim Hutchinson, to run for U.S. Senate
- California's 27th congressional district: Carlos Moorhead
- Colorado's 4th congressional district: Wayne Allard, to run for U.S. Senate
- Indiana's 7th congressional district: John Myers
- Kansas's 1st congressional district: Pat Roberts, to run for U.S. Senate
- Kansas's 2nd congressional district: Sam Brownback, to run for U.S. Senate
- Kansas's 3rd congressional district: Jan Meyers
- Missouri's 7th congressional district: Mel Hancock
- Nevada's 2nd congressional district: Barbara Vucanovich
- New Hampshire's 1st congressional district: Bill Zeliff, to run for Governor
- New Jersey's 12th congressional district: Dick Zimmer, to run for U.S. Senate
- Oregon's 2nd congressional district: Wes Cooley
- Pennsylvania's 5th congressional district: Bill Clinger
- Pennsylvania's 16th congressional district: Robert Smith Walker
- Tennessee's 1st congressional district: Jimmy Quillen
- Texas's 8th congressional district: Jack Fields
- Utah's 2nd congressional district: Enid Greene
Democratic gain
Incumbents defeated
In primary elections
Democrats
- Michigan's 15th congressional district: Barbara-Rose Collins lost to Carolyn Kilpatrick, who later won the general election
Republicans
- Texas's 14th congressional district: Greg Laughlin lost to Ron Paul, who later won the general election
In the general elections
21 seats switched parties in the November elections, giving the Democrats a net gain of 15 seats from the Republicans.
Democrats who lost to Republicans
Republicans who lost to Democrats
- California's 10th congressional district: William P. Baker lost to Ellen Tauscher
- California's 22nd congressional district: Andrea Seastrand lost to Walter Capps
- California's 46th congressional district: Bob Dornan lost to Loretta Sanchez
- Connecticut's 5th congressional district: Gary Franks lost to Jim Maloney
- Illinois's 5th congressional district: Michael Flanagan lost to Rod Blagojevich
- Maine's 1st congressional district: James B. Longley, Jr. lost to Tom Allen
- Massachusetts's 3rd congressional district: Peter Blute lost to Jim McGovern
- Massachusetts's 6th congressional district: Peter Torkildsen lost to John F. Tierney
- Michigan's 8th congressional district: Dick Chrysler lost to Debbie Stabenow
- New Jersey's 8th congressional district: Bill Martini lost to Bill Pascrell
- New York's 4th congressional district: Daniel Frisa lost to Carolyn McCarthy
- North Carolina's 2nd congressional district: David Funderburk lost to Bob Etheridge
- North Carolina's 4th congressional district: Fred Heineman lost to David Price
- Ohio's 6th congressional district: Frank Cremeans lost to Ted Strickland
- Ohio's 10th congressional district: Martin Hoke lost to Dennis J. Kucinich
- Oregon's 5th congressional district: Jim Bunn lost to Darlene Hooley
- Texas's 9th congressional district: Steve Stockman lost to Nick Lampson
- Washington's 9th congressional district: Randy Tate lost to Adam Smith
Special elections
| District | Predecessor | Party | Result | Candidates |
|---|---|---|---|---|
| California 37 | Walter R. Tucker III | Democratic | Incumbent resigned December 15, 1995 due to scandals during his past tenure as Mayor of Compton, California. New member elected March 26, 1996. Democratic hold. |
√ Juanita Millender-McDonald (Democratic) 27% Willard Murray (Democratic) |
| Maryland 7 | Kweisi Mfume | Democratic | Incumbent resigned February 15, 1996 to become President of the NAACP. New member elected April 16, 1996. Democratic hold. |
√ Elijah Cummings (Democratic) Kenneth Konder (Republican) |
| Oregon 3 | Ron Wyden | Democratic | Incumbent resigned February 6, 1996 when elected U.S. Senator. New member elected May 21, 1996. Democratic hold. |
√ Earl Blumenauer (Democratic) 69% Mark Brunelle (Republican) |
| Kansas 2 | Sam Brownback | Republican | Incumbent resigned November 27, 1996 when elected U.S. Senator. New member elected November 27, 1996. Republican hold. |
√ Jim Ryun (Republican) |
Alabama
| District | Incumbent | Party | First elected |
Result | Candidates |
|---|---|---|---|---|---|
| Alabama 1 | Sonny Callahan | Republican | 1984 | Incumbent re-elected. | √ Sonny Callahan (Republican) 64.36% Don Womack (Democratic) 33.82% Bob Burns (Libertarian) 1.61% |
| Alabama 2 | Terry Everett | Republican | 1992 | Incumbent re-elected. | √ Terry Everett (Republican) 63.19% Bob Gaines (Democratic) 35.42% Michael Probst (Libertarian) 1.26% |
| Alabama 3 | Glen Browder | Democratic | 1988 | Incumbent retired to run for U.S. Senator. New member elected. Republican gain. |
√ Bob Riley (Republican) 50.42% Ted Little (Democratic) 47.3% Lucy Lawrence (Natural Law) 1.20% R.E. Stokes (Libertarian) 1.02% |
| Alabama 4 | Tom Bevill | Democratic | 1966 | Incumbent retired. New member elected. Republican gain. |
√ Robert Aderholt (Republican) 49.89% Bob Wilson (Democratic) 48.20% Alan Barksdale (Libertarian) 1.80% |
| Alabama 5 | Robert "Bud" Cramer | Democratic | 1990 | Incumbent re-elected. | √ Robert "Bud" Cramer (Democratic) 55.68% Wayne Parker (Republican) 42.19% Shirley Madison (Natural Law) 1.21% Craig Goodrich (Libertarian) 0.90% |
| Alabama 6 | Spencer Bachus | Republican | 1992 | Incumbent re-elected. | √ Spencer Bachus (Republican) 70.93% Mary Lynn Bates (Democratic) 27.31% Franklin Harris (Libertarian) 0.90% Diane Vogel (Natural Law) 0.83% |
| Alabama 7 | Earl Hilliard | Democratic | 1992 | Incumbent re-elected. | √ Earl Hilliard (Democratic) 71.13% Joe Powell (Republican) 27.14% Ken Hager (Libertarian) 1.64% |
Alaska
| District | Incumbent | Party | First elected |
Result | Candidates |
|---|---|---|---|---|---|
| Alaska at-large | Don Young | Republican | 1973 | Incumbent re-elected. | √ Don Young (Republican) 59.41% Georgianna Lincoln (Democratic) 36.42% William Nemec (AKI) 2.15% Johnny Grames (Green) 1.93% |
Arizona
| District | Incumbent | Party | First elected |
Result | Candidates |
|---|---|---|---|---|---|
| Arizona 1 | Matt Salmon | Republican | 1994 | Incumbent re-elected. | √ Matt Salmon (Republican) 60.18% John Cox (Democratic) 39.82% |
| Arizona 2 | Ed Pastor | Democratic | 1991 | Incumbent re-elected. | √ Ed Pastor (Democratic) 65.01% Jim Buster (Republican) 30.76% Alice Bangle (Libertarian) 4.23% |
| Arizona 3 | Bob Stump | Republican | 1976 | Incumbent re-elected. | √ Bob Stump (Republican) 66.52% Alexander Schneider (Democratic) 33.48% |
| Arizona 4 | John Shadegg | Republican | 1994 | Incumbent re-elected. | √ John Shadegg (Republican) 66.78% Maria Milton (Democratic) 33.22% |
| Arizona 5 | Jim Kolbe | Republican | 1984 | Incumbent re-elected. | √ Jim Kolbe (Republican) 68.74% Mort Nelson (Democratic) 25.91% John Zajac (Libertarian) 2.81% Ed Finkelstein (Reform) 2.54% |
| Arizona 6 | J. D. Hayworth | Republican | 1994 | Incumbent re-elected. | √ J. D. Hayworth (Republican) 47.57% Steve Owens (Democratic) 46.60% Robert Anderson (Libertarian) 5.84% |
Arkansas
| District | Incumbent | Party | First elected |
Result | Candidates |
|---|---|---|---|---|---|
| Arkansas 1 | Blanche Lincoln | Democratic | 1992 | Incumbent retired. New member elected. Democratic hold. |
√ Marion Berry (Democratic) 52.78% Warren Dupwe (Republican) 44.34% Keith Carle (Reform) 2.87% |
| Arkansas 2 | Ray Thornton | Democratic | 1972, 1990 | Incumbent retired. New member elected. Democratic hold. |
√ Vic Snyder (Democratic) 52.34% Bud Cummins (Republican) 47.65% |
| Arkansas 3 | Tim Hutchinson | Republican | 1992 | Incumbent retired to run for U.S. Senator. New member elected. Republican hold. |
√ Asa Hutchinson (Republican) 55.70% Ann Henry (Democratic) 41.84% Tony Joe Huffman (Reform) 2.43% |
| Arkansas 4 | Jay Dickey | Republican | 1992 | Incumbent re-elected. | √ Jay Dickey (Republican) 63.50% Vincent Tolliver (Democratic) 36.50% |
California
| District | Incumbent | Party | First elected |
Result | Candidates |
|---|---|---|---|---|---|
| California 1 | Frank Riggs | Republican | 1990/1994 | Incumbent re-elected. | √ Frank Riggs (Republican) 49.63% Michela Alioto (Democratic) 43.46% Emil Rossi (Libertarian) 6.91% |
| California 2 | Wally Herger | Republican | 1986 | Incumbent re-elected. | √ Wally Herger (Republican) 60.8% Roberts Braden (Democratic) 33.73% Patrice Thiessen (Natural Law) 3.04% William Brunner (Libertarian) 2.42% |
| California 3 | Vic Fazio | Democratic | 1978 | Incumbent re-elected. | √ Vic Fazio (Democratic) 53.52% Tim Lefever (Republican) 41.1% Tomothy Erich (Reform) 3.47% Erin Donelle (Libertarian) 1.91% |
| California 4 | John Doolittle | Republican | 1990 | Incumbent re-elected. | √ John Doolittle (Republican) 60.46% Katie Hirning (Democratic) 36.1% Patrick McHargue (Libertarian) 3.43% |
| California 5 | Bob Matsui | Democratic | 1978 | Incumbent re-elected. | √ Bob Matsui (Democratic) 70.44% Robert Dinsmore (Republican) 26.15% Joseph Miller (Libertarian) 1.26% Gordon Mors (American Independent) 1.1% Charles Kersey (Natural Law) 1.05% |
| California 6 | Lynn Woolsey | Democratic | 1992 | Incumbent re-elected. | √ Lynn Woolsey (Democratic) 61.83% Duane Hughes (Republican) 33.99% Ernest Jones (PF) 2.54% Bruce Kendall (Natural Law) 1.63% |
| California 7 | George Miller | Democratic | 1974 | Incumbent re-elected. | √ George Miller (Democratic) 71.8% Norman Reece (Republican) 22.28% William C. Thompson (Reform) 3.6% Bob Liatunick (Natural Law) 2.32% |
| California 8 | Nancy Pelosi | Democratic | 1987 | Incumbent re-elected. | √ Nancy Pelosi (Democratic) 84.34% Justin Raimondo (Republican) 12.39% David Smithstein (Natural Law) 3.26% Ed Murray (R-W/I) 0.01% |
| California 9 | Ron Dellums | Democratic | 1970 | Incumbent re-elected. | √ Ron Dellums (Democratic) 77.03% Deborah Wright (Republican) 18.47% Tom Condit (PF) 2.77% Jack Forem (Natural Law) 1.73% |
| California 10 | Bill Baker | Republican | 1992 | Incumbent lost re-election. New member elected. Democratic gain. |
√ Ellen Tauscher (Democratic) 48.63% Bill Baker (Republican) 47.19% John Place (Reform) 2.24% Valerie Janlois (Natural Law) 1.08% Gregory Lyon (Libertarian) 0.86% |
| California 11 | Richard Pombo | Republican | 1992 | Incumbent re-elected. | √ Richard Pombo (Republican) 59.35% Jason Silva (Democratic) 36.19% Kelly Rego (Libertarian) 2.8% Selene Bush (Natural Law) 1.66% |
| California 12 | Tom Lantos | Democratic | 1980 | Incumbent re-elected. | √ Tom Lantos (Democratic) 71.69% Storm Jenkins (Republican) 23.7% Christopher Schmidt (Libertarian) 2.94% Richard Borg (Natural Law) 1.67% |
| California 13 | Pete Stark | Democratic | 1972 | Incumbent re-elected. | √ Pete Stark (Democratic) 65.18% James Fay (Republican) 30.41% Terry Savage (Libertarian) 4.41% |
| California 14 | Anna Eshoo | Democratic | 1992 | Incumbent re-elected. | √ Anna Eshoo (Democratic) 64.87% Ben Brink (Republican) 31.1% Timothy Thompson (PF) 1.59% Joseph Dehn (Libertarian) 1.52% Robert Wells (Natural Law) 0.93% |
| California 15 | Tom Campbell | Republican | 1988/1995 | Incumbent re-elected. | √ Tom Campbell (Republican) 58.5% Dick Lane (Democratic) 34.84% Valli Sharpe-Geisler (Reform) 2.75% Ed Wimmers (Libertarian) 2.42% Bruce Currivan (Natural Law) 1.49% |
| California 16 | Zoe Lofgren | Democratic | 1994 | Incumbent re-elected. | √ Zoe Lofgren (Democratic) 65.65% Chuck Wojslaw (Republican) 30.16% David Bonino (Libertarian) 2.88% Abaan Abu-Shumays (Natural Law) 1.3% |
| California 17 | Sam Farr | Democratic | 1993 | Incumbent re-elected. | √ Sam Farr (Democratic) 58.87% Jess Brown (Republican) 37.77% John H. Black (Libertarian) 3.36% |
| California 18 | Gary Condit | Democratic | 1989 | Incumbent re-elected. | √ Gary Condit (Democratic) 65.72% Bill Conrad (Republican) 31.82% James Morzella (Libertarian) 1.35% Page Riskin (Natural Law) 1.1% |
| California 19 | George Radanovich | Republican | 1994 | Incumbent re-elected. | √ George Radanovich (Republican) 66.58% Paul Barile (Democratic) 28.32% Pamela Pescosolido (Libertarian) 2.95% David Adalian (Natural Law) 2.15% |
| California 20 | Cal Dooley | Democratic | 1990 | Incumbent re-elected. | √ Cal Dooley (Democratic) 56.51% Trice Harvey (Republican) 39.13% Jonathan Richter (Libertarian) 4.36% |
| California 21 | Bill Thomas | Republican | 1978 | Incumbent re-elected. | √ Bill Thomas (Republican) 65.81% Deborah Vollmer (Democratic) 26.5% John Evans (Reform) 4.24% Jane Bialosky (Natural Law) 1.77% Mike Hodges (Libertarian) 1.59% Karen Gentry (R-W/I) |
| California 22 | Andrea Seastrand | Republican | 1994 | Incumbent lost re-election. New member elected. Democratic gain. |
√ Walter Capps (Democratic) 48.45% Andrea Seastrand (Republican) 44.22% Steven Wheeler (Independent) 4.03% Richard Porter (Reform) 1.63% David Bersohn (Libertarian) 0.91% Dawn Tomastik (Natural Law) 0.76% |
| California 23 | Elton Gallegly | Republican | 1986 | Incumbent re-elected. | √ Elton Gallegly (Republican) 59.59% Robert Unruhe (Democratic) 35.1% Gail Lightfoot (Libertarian) 4.18% Stephen Hospodar (Natural Law) 1.12% |
| California 24 | Anthony C. Beilenson | Democratic | 1976 | Incumbent retired. New member elected. Democratic hold. |
√ Brad Sherman (Democratic) 49.43% Rich Sybert (Republican) 43.58% Ralph Shroyer (PF) 2.92% Erich Miller (Libertarian) 2.65% Ron Lawrence (Natural Law) 1.43% |
| California 25 | Howard McKeon | Republican | 1992 | Incumbent re-elected. | √ Howard McKeon (Republican) 62.4% Diane Trautman (Democratic) 33.17% Bruce Acker (Libertarian) 3.15% Justin Charles Gerber (PF) 1.28% |
| California 26 | Howard Berman | Democratic | 1982 | Incumbent re-elected. | √ Howard Berman (Democratic) 65.87% Bill Glass (Republican) 28.61% Scott Fritschler (Libertarian) 3.45% Gary Hearne (Natural Law) 2.07% |
| California 27 | Carlos Moorhead | Republican | 1972 | Incumbent retired. New member elected. Republican hold. |
√ James E. Rogan (Republican) 50.18% Doug Kahn (Democratic) 43.18% Elizabeth Michael (Libertarian) 3.5% Walt Sheasby (Green) 2.21% Martin Zucker (Natural Law) 0.93% |
| California 28 | David Dreier | Republican | 1980 | Incumbent re-elected. | √ David Dreier (Republican) 60.67% David Levering (Democratic) 36.94% Ken Saurenman (Libertarian) 2.38% |
| California 29 | Henry Waxman | Democratic | 1974 | Incumbent re-elected. | √ Henry Waxman (Democratic) 67.63% Paul Stepanek (Republican) 24.6% John Peter Daly (PF) 4.1% Mike Binkley (Libertarian) 2.22% Brian Rees (Natural Law) 1.44% |
| California 30 | Xavier Becerra | Democratic | 1992 | Incumbent re-elected. | √ Xavier Becerra (Democratic) 72.32% Patricia Parker (Republican) 18.71% Pam Probst (Libertarian) 3.42% Shirley Mandel (PF) 3.1% Rosemary Watson-Frith (Natural Law) 2.44% |
| California 31 | Matthew G. Martinez | Democratic | 1982 | Incumbent re-elected. | √ Matthew G. Martinez (Democratic) 67.47% John Flores (Republican) 27.95% Michael Everling (Republican) 4.58% |
| California 32 | Julian C. Dixon | Democratic | 1978 | Incumbent re-elected. | √ Julian C. Dixon (Democratic) 82.36% Larry Ardito (Republican) 12.39% Neal Donner (Libertarian) 4.22% Rashied Jibri (Natural Law) 1.03% |
| California 33 | Lucille Roybal-Allard | Democratic | 1992 | Incumbent re-elected. | √ Lucille Roybal-Allard (Democratic) 82.1% John Leonard (Republican) 14.09% Howard Johnson (Libertarian) 3.81% |
| California 34 | Ed Torres | Democratic | 1982 | Incumbent re-elected. | √ Ed Torres (Democratic) 68.43% David Nunez (Republican) 26.62% Walter Scott (American Independent) 2.98% David Argall (Libertarian) 1.98% |
| California 35 | Maxine Waters | Democratic | 1990 | Incumbent re-elected. | √ Maxine Waters (Democratic) 85.5% Eric Carlson (Republican) 12.09% Gordon Mego (American Independent) 2.4% |
| California 36 | Jane Harman | Democratic | 1992 | Incumbent re-elected. | √ Jane Harman (Democratic) 52.46% Susan Brooks (Republican) 43.9% Bruce Dovner (Libertarian) 2.2% Bradley McManus (Natural Law) 1.44% |
| California 37 | Juanita Millender-McDonald | Democratic | 1996 (Special) | Incumbent re-elected. | √ Juanita Millender-McDonald (Democratic) 85% Michael Voetee (Republican) 15% |
| California 38 | Steve Horn | Republican | 1992 | Incumbent re-elected. | √ Steve Horn (Republican) 52.57% Rick Zbur (Democratic) 42.72% William Yeager (Green) 2.75% Paul Gautreau (Libertarian) 1.95% |
| California 39 | Ed Royce | Republican | 1992 | Incumbent re-elected. | √ Ed Royce (Republican) 62.8% R.O. "Bob" Davis (Democratic) 31.93% Jack Dean (Libertarian) 5.27% |
| California 40 | Jerry Lewis | Republican | 1978 | Incumbent re-elected. | √ Jerry Lewis (Republican) 64.9% Robert Conaway (Democratic) 28.96% Hale McGee (American Independent) 3.26% Joseph Kelley (Libertarian) 2.87% |
| California 41 | Jay Kim | Republican | 1992 | Incumbent re-elected. | √ Jay Kim (Republican) 58.46% Richard Waldron (Democratic) 32.98% Richard Newhouse (Libertarian) 4.97% David Kramer (Natural Law) 3.5% |
| California 42 | George Brown | Democratic | 1962/1972 | Incumbent re-elected. | √ George Brown (Democratic) 50.48% Linda Wilde (Republican) 49.52% |
| California 43 | Ken Calvert | Republican | 1992 | Incumbent re-elected. | √ Ken Calvert (Republican) 54.72% Guy Kimbrough (Democratic) 37.94% Annie Wallack (Natural Law) 3.7% Kevin Akin (PF) 1.86% Gene Berkman (Libertarian) 1.74% |
| California 44 | Sonny Bono | Republican | 1994 | Incumbent re-elected. | √ Sonny Bono (Republican) 57.74% Anita Rufus (Democratic) 38.54% Donald Cochran (American Independent) 2.03% Karen Wilkinson (Natural Law) 1.64% |
| California 45 | Dana Rohrabacher | Republican | 1988 | Incumbent re-elected. | √ Dana Rohrabacher (Republican) 60.98% Sally Alexander (Democratic) 33.24% Mark F. Murphy (Libertarian) 4.29% Rand McDevitt (Natural Law) 1.49% |
| California 46 | Bob Dornan | Republican | 1976/1984 | Incumbent lost re-election. New member elected. Democratic gain. |
√ Loretta Sanchez (Democratic) 46.8% Bob Dornan (Republican) 45.84% Lawrence Stafford (Reform) 3.16% Thomas Reimer (Libertarian) 2.28% Carlos Aguirre (Natural Law) 1.92% |
| California 47 | Christopher Cox | Republican | 1988 | Incumbent re-elected. | √ Christopher Cox (Republican) 65.66% Tina Laine (Democratic) 28.86% Iris Adam (Natural Law) 2.79% Victor Wagner (Libertarian) 2.68% |
| California 48 | Ron Packard | Republican | 1982 | Incumbent re-elected. | √ Ron Packard (Republican) 65.86% Dan Farrell (Democratic) 26.9% Sharon Miles (Natural Law) 3.62% William Dreu (Reform) 3.62% |
| California 49 | Brian Bilbray | Republican | 1994 | Incumbent re-elected. | √ Brian Bilbray (Republican) 52.62% Peter Navarro (Democratic) 41.91% Ernie Lippe (Libertarian) 2.04% Kevin Hambsch (Reform) 1.82% Peter Sterling (Natural Law) 1.6% |
| California 50 | Bob Filner | Democratic | 1992 | Incumbent re-elected. | √ Bob Filner (Democratic) 61.86% Jim Baize (Republican) 32.41% Dan Clark (Reform) 2.75% Earl Shepard (Natural Law) 1.81% Philip Zoebisch (Libertarian) 1.18% |
| California 51 | Duke Cunningham | Republican | 1990 | Incumbent re-elected. | √ Duke Cunningham (Republican) 65.07% Rita Tamerius (Democratic) 28.93% Miriam Clark (Reform) 2.36% Jack C. Anderson (Libertarian) 2.31% Eric Bourdette (Natural Law) 1.33% |
| California 52 | Duncan Hunter | Republican | 1980 | Incumbent re-elected. | √ Duncan Hunter (Republican) 65.47% Darity Wesley (Democratic) 29.78% Janice Jordan (PF) 2.05% Dante Ridley (Libertarian) 1.87% Peter Ballantyne (Natural Law) 0.84% |
Colorado
| District | Incumbent | Party | First elected |
Result | Candidates |
|---|---|---|---|---|---|
| Colorado 1 | Patricia Schroeder | Democratic | 1972 | Incumbent retired. New member elected. Democratic hold. |
√ Diana DeGette (Democratic) 56.93% Joe Rogers (Republican) 40.20% Richard Combs (Libertarian) 2.86% |
| Colorado 2 | David Skaggs | Democratic | 1986 | Incumbent re-elected. | √ David Skaggs (Democratic) 57.04% Pat Miller (Republican) 38.26% Larry E. Johnson (Reform) 2.46% Earl Allen (Libertarian) 2.24% |
| Colorado 3 | Scott McInnis | Republican | 1992 | Incumbent re-elected. | √ Scott McInnis (Republican) 68.87% Albert Gurule (Democratic) 31.13% |
| Colorado 4 | Wayne Allard | Republican | 1990 | Incumbent retired to run for U.S. Senator. New member elected. Republican hold. |
√ Bob Schaffer (Republican) 56.14% Guy Kelley (Democratic) 38.04% Wes McKinley (AMS) 3.04% Cynthia Parker (Natural Law) 2.78% |
| Colorado 5 | Joel Hefley | Republican | 1986 | Incumbent re-elected. | √ Joel Hefley (Republican) 71.94% Mike Robinson (Democratic) 28.06% |
| Colorado 6 | Daniel Schaefer | Republican | 1983 | Incumbent re-elected. | √ Daniel Schaefer (Republican) 62.24% Joan Fitz-Gerald (Democratic) 37.76% |
Connecticut
| District | Incumbent | Party | First elected |
Result | Candidates |
|---|---|---|---|---|---|
| Connecticut 1 | Barbara Kennelly | Democratic | 1982 | Incumbent re-elected. | √ Barbara Kennelly (Democratic) 73.54% Kent Sleath (Republican) 24.94% John Forry (CNC) 0.98% Daniel Wasielewski (Natural Law) 0.53% |
| Connecticut 2 | Sam Gejdenson | Democratic | 1980 | Incumbent re-elected. | √ Sam Gejdenson (Democratic) 51.59% Edward Munster (Republican) 44.94% Dianne Ondusko (IDP) 2.90% Thomas E. Hall (Natural Law) 0.56% |
| Connecticut 3 | Rosa DeLauro | Democratic | 1990 | Incumbent re-elected. | √ Rosa DeLauro (Democratic) 71.35% John Coppola (Republican) 28.07% Gail Dalby (Natural Law) 0.58% |
| Connecticut 4 | Chris Shays | Republican | 1987 | Incumbent re-elected. | √ Chris Shays (Republican) 60.46% William Finch (Democratic) 37.63% Edward Tonkin (Libertarian) 1.40% Terry Nevas (Natural Law) 0.52% |
| Connecticut 5 | Gary Franks | Republican | 1990 | Incumbent lost re-election. New member elected. Democratic gain. |
√ Jim Maloney (Democratic) 52.05% Gary Franks (Republican) 45.92% Rosita Rodriguez (CNC) 1.39% Walter Thiessen (Libertarian) 0.65% |
| Connecticut 6 | Nancy Johnson | Republican | 1982 | Incumbent re-elected. | √ Nancy Johnson (Republican) 49.62% Charlotte Koskoff (Democratic) 48.93% Timothy Knibbs (CNC) 1.45% |
Delaware
| District | Incumbent | Party | First elected |
Result | Candidates |
|---|---|---|---|---|---|
| Delaware at-large | Michael N. Castle | Republican | 1992 | Incumbent re-elected. | √ Michael N. Castle (Republican) 69.55% Dennis Williams (Democratic) 27.45% George Jurgensens (Libertarian) 1.50% Felicia Johnson (Taxpayers) 1.13% Bob Mattson (Natural Law) 0.37% |
Florida
| District | Incumbent | Party | First elected |
Result | Candidates |
|---|---|---|---|---|---|
| Florida 1 | Joe Scarborough | Republican | 1994 | Incumbent re-elected. | √ Joe Scarborough (Republican) 72.54% Kevin Beck (Democratic) 27.42% |
| Florida 2 | Pete Peterson | Democratic | 1990 | Incumbent retired. New member elected. Democratic hold. |
√ Allen Boyd (Democratic) 59.44% Bill Sutton (Republican) 40.50% |
| Florida 3 | Corrine Brown | Democratic | 1992 | Incumbent re-elected. | √ Corrine Brown (Democratic) 61.20% Preston James Fields (Republican) 38.80% |
| Florida 4 | Tillie Fowler | Republican | 1992 | Incumbent re-elected. | √ Tillie Fowler (Republican) Unopposed |
| Florida 5 | Karen Thurman | Democratic | 1992 | Incumbent re-elected. | √ Karen Thurman (Democratic) 61.68% Dave Gentry (Republican) 38.32% |
| Florida 6 | Cliff Stearns | Republican | 1988 | Incumbent re-elected. | √ Cliff Stearns (Republican) 67.18% Newell O'Brien (Democratic) 32.82% |
| Florida 7 | John Mica | Republican | 1992 | Incumbent re-elected. | √ John Mica (Republican) 62.04% George Stuart (Democratic) 37.93% |
| Florida 8 | Bill McCollum | Republican | 1980 | Incumbent re-elected. | √ Bill McCollum (Republican) 67.47% Al Krulick (Democratic) 32.52% |
| Florida 9 | Michael Bilirakis | Republican | 1982 | Incumbent re-elected. | √ Michael Bilirakis (Republican) 68.66% Jerry Provenzano (Democratic) 31.34% |
| Florida 10 | Bill Young | Republican | 1970 | Incumbent re-elected. | √ Bill Young (Republican) 66.61% Henry Green (Democratic) 33.39% |
| Florida 11 | Sam Gibbons | Democratic | 1962 | Incumbent retired. New member elected. Democratic hold. |
√ Jim Davis (Democratic) 57.91% Mark Sharpe (Republican) 42.09% |
| Florida 12 | Charles Canady | Republican | 1992 | Incumbent re-elected. | √ Charles Canady (Republican) 61.57% Mike Canady (Democratic) 38.43% |
| Florida 13 | Dan Miller | Republican | 1992 | Incumbent re-elected. | √ Dan Miller (Republican) 64.34% Sanford Gordon (Democratic) 35.60% |
| Florida 14 | Porter Goss | Republican | 1988 | Incumbent re-elected. | √ Porter Goss (Republican) 73.49% Jim Nolan (Democratic) 26.51% |
| Florida 15 | Dave Weldon | Republican | 1994 | Incumbent re-elected. | √ Dave Weldon (Republican) 51.42% John Byron (Democratic) 42.90% David Golding (Independent) 5.68% |
| Florida 16 | Mark Foley | Republican | 1994 | Incumbent re-elected. | √ Mark Foley (Republican) 64% Jim Stuber (Democratic) 36% |
| Florida 17 | Carrie Meek | Democratic | 1992 | Incumbent re-elected. | √ Carrie Meek (Democratic) 88.75% Wellington Rolle (Republican) 11.24% |
| Florida 18 | Ileana Ros-Lehtinen | Republican | 1989 (Special) | Incumbent re-elected. | √ Ileana Ros-Lehtinen (Republican) Unopposed |
| Florida 19 | Harry Johnston | Democratic | 1988 | Incumbent retired. New member elected. Democratic hold. |
√ Robert Wexler (Democratic) 65.57% Beverly Kennedy (Republican) 34.42% |
| Florida 20 | Peter Deutsch | Democratic | 1992 | Incumbent re-elected. | √ Peter Deutsch (Democratic) 64.99% Jim Jacobs (Republican) 35.01% |
| Florida 21 | Lincoln Diaz-Balart | Republican | 1992 | Incumbent re-elected. | √ Lincoln Diaz-Balart (Republican) Unopposed |
| Florida 22 | Clay Shaw | Republican | 1980 | Incumbent re-elected. | √ Clay Shaw (Republican) 61.86% Kenneth Cooper (Democratic) 38.14% |
| Florida 23 | Alcee Hastings | Democratic | 1992 | Incumbent re-elected. | √ Alcee Hastings (Democratic) 73.45% Robert Paul Brown (Republican) 26.53% |
Georgia
| District | Incumbent | Party | First elected |
Result | Candidates |
|---|---|---|---|---|---|
| Georgia 1 | Jack Kingston | Republican | 1992 | Incumbent re-elected. | √ Jack Kingston (Republican) 68.21% Rosemary Kaszans (Democratic) 31.79% |
| Georgia 2 | Sanford Bishop | Democratic | 1992 | Incumbent re-elected. | √ Sanford Bishop (Democratic) 53.97% Darrel Ealum (Republican) 46.03% |
| Georgia 3 | Mac Collins | Republican | 1992 | Incumbent re-elected. | √ Mac Collins (Republican) 61.11% Jim Chafin (Democratic) 38.89% |
| Georgia 4 | Cynthia McKinney | Democratic | 1992 | Incumbent re-elected. | √ Cynthia McKinney (Democratic) 57.76% John Mitnick (Republican) 42.24% |
| Georgia 5 | John Lewis | Democratic | 1986 | Incumbent re-elected. | √ John Lewis (Democratic) Unopposed |
| Georgia 6 | Newt Gingrich | Republican | 1978 | Incumbent re-elected. | √ Newt Gingrich (Republican) 57.80% Michael Coles (Democratic) 42.20% |
| Georgia 7 | Bob Barr | Republican | 1994 | Incumbent re-elected. | √ Bob Barr (Republican) 57.80% Charlie Watts (Democratic) 42.20% |
| Georgia 8 | Saxby Chambliss | Republican | 1994 | Incumbent re-elected. | √ Saxby Chambliss (Republican) 52.56% Jim Wiggins (Democratic) 47.44% |
| Georgia 9 | Nathan Deal | Republican | 1992 | Incumbent re-elected. | √ Nathan Deal (Republican) 65.55% Ken Poston (Democratic) 34.45% |
| Georgia 10 | Charlie Norwood | Republican | 1994 | Incumbent re-elected. | √ Charlie Norwood (Republican) 52.34% David Bell (Democratic) 47.65% |
| Georgia 11 | John Linder | Republican | 1992 | Incumbent re-elected. | √ John Linder (Republican) 64.31% Tommy Stephenson (Democratic) 35.69% |
Hawaii
| District | Incumbent | Party | First elected |
Result | Candidates |
|---|---|---|---|---|---|
| Hawaii 1 | Neil Abercrombie | Democratic | 1986, 1990 | Incumbent re-elected. | √ Neil Abercrombie (Democratic) 50.36% Orson Swindle (Republican) 46.49% Mark Duering (Nonpartisan) 2.40% Nicholas Bedworth (Natural Law) 0.75% |
| Hawaii 2 | Patsy Mink | Democratic | 1964, 1990 | Incumbent re-elected. | √ Patsy Mink (Democratic) 60.33% Tom Pico (Republican) 30.80% Nolan Crabbe (Nonpartisan) 4.27% James Keefe (Libertarian) 2.64% Amanda Toulon (Natural Law) 1.97% |
Idaho
| District | Incumbent | Party | First elected |
Result | Candidates |
|---|---|---|---|---|---|
| Idaho 1 | Helen Chenoweth | Republican | 1994 | Incumbent re-elected. | √ Helen Chenoweth (Republican) 49.98% Dan Williams (Democratic) 47.55% Marion Ellis (Natural Law) 2.47% |
| Idaho 2 | Mike Crapo | Republican | 1992 | Incumbent re-elected. | √ Mike Crapo (Republican) 68.77% John Seidl (Democratic) 29.50% John Butler (Natural Law) 1.73% |
Illinois
| District | Incumbent | Party | First elected |
Result | Candidates |
|---|---|---|---|---|---|
| Illinois 1 | Bobby Rush | Democratic | 1992 | Incumbent re-elected. | √ Bobby Rush (Democratic) 85.67% Noel Naughton (Republican) 12.63% Tim Griffin (Libertarian) 1.70% |
| Illinois 2 | Jesse L. Jackson Jr. | Democratic | 1995 | Incumbent re-elected. | √ Jesse L. Jackson Jr. (Democratic) 94.06% Frank Stratman (Libertarian) 5.93% |
| Illinois 3 | Bill Lipinski | Democratic | 1982 | Incumbent re-elected. | √ Bill Lipinski (Democratic) 65.34% Jim Nalepa (Republican) 32.02% George Skaritka (Reform) 1.74% Robert Prazak (Libertarian) 0.91% |
| Illinois 4 | Luis Gutierrez | Democratic | 1992 | Incumbent re-elected. | √ Luis Gutierrez (Democratic) 93.57% William Passmore (Libertarian) 6.43% |
| Illinois 5 | Michael Flanagan | Republican | 1994 | Incumbent lost re-election. New member elected. Democratic gain. |
√ Rod Blagojevich (Democratic) 64.12% Michael Flanagan (Republican) 35.87% |
| Illinois 6 | Henry Hyde | Republican | 1974 | Incumbent re-elected. | √ Henry Hyde (Republican) 64.29% Stephen De La Rosa (Democratic) 33.41% George Meyers (Libertarian) 2.30% |
| Illinois 7 | Cardiss Collins | Democratic | 1973 | Incumbent retired. New member elected. Democratic hold. |
√ Danny K. Davis (Democratic) 82.59% Randy Borow (Republican) 15.04% Chauncey Stroud (Independent) 1.07% Toietta Dixon (Libertarian) 0.87% Charles A. Winter (Natural Law) 0.42% |
| Illinois 8 | Phil Crane | Republican | 1969 | Incumbent re-elected. | √ Phil Crane (Republican) 62.23% Betty Hull (Democratic) 36.08% Daniel Druck (Libertarian) 1.69% |
| Illinois 9 | Sidney Yates | Democratic | 1948, 1964 | Incumbent re-elected. | √ Sidney Yates (Democratic) 63.40% Joe Walsh (Republican) 36.60% |
| Illinois 10 | John Porter | Republican | 1980 | Incumbent re-elected. | √ John Porter (Republican) 69.09% Philip Torf (Democratic) 30.91% |
| Illinois 11 | Jerry Weller | Republican | 1994 | Incumbent re-elected. | √ Jerry Weller (Republican) 51.77% Clem Balanoff (Democratic) 48.23% |
| Illinois 12 | Jerry Costello | Democratic | 1988 | Incumbent re-elected. | √ Jerry Costello (Democratic) 71.59% Shapley Hunter (Republican) 26.58% Geoffrey Nathan (Democratic) 1.82% |
| Illinois 13 | Harris Fawell | Republican | 1984 | Incumbent re-elected. | √ Harris Fawell (Republican) 59.93% Susan Hynes (Democratic) 40.06% |
| Illinois 14 | Dennis Hastert | Republican | 1986 | Incumbent re-elected. | √ Dennis Hastert (Republican) 64.39% Doug Mains (Democratic) 35.60% |
| Illinois 15 | Thomas W. Ewing | Republican | 1991 | Incumbent re-elected. | √ Thomas W. Ewing (Republican) 57.33% Laurel Lunt Prussing (Democratic) 42.67% |
| Illinois 16 | Donald A. Manzullo | Republican | 1992 | Incumbent re-elected. | √ Donald A. Manzullo (Republican) 60.29% Catherine Lee (Democratic) 39.71% |
| Illinois 17 | Lane Evans | Democratic | 1982 | Incumbent re-elected. | √ Lane Evans (Democratic) 51.91% Mark Baker (Republican) 47.25% William Herrmann (Libertarian) 0.83% |
| Illinois 18 | Ray LaHood | Republican | 1994 | Incumbent re-elected. | √ Ray LaHood (Republican) 59.25% Michael D. Curran (Democratic) 40.75% |
| Illinois 19 | Glenn Poshard | Democratic | 1988 | Incumbent re-elected. | √ Glenn Poshard (Democratic) 66.69% Brent Winters (Republican) 31.83% Patricia Riker (Natural Law) 0.95% James Lacher (Libertarian) 0.53% |
| Illinois 20 | Richard Durbin | Democratic | 1982 | Incumbent retired to run for U.S. Senator. New member elected. Republican gain. |
√ John Shimkus (Republican) 50.26% Jay Hoffman (Democratic) 49.74% |
Indiana
| District | Incumbent | Party | First elected |
Result | Candidates |
|---|---|---|---|---|---|
| Indiana 1 | Pete Visclosky | Democratic | 1984 | Incumbent re-elected. | √ Pete Visclosky (Democratic) 69.16% Michael Petyo (Republican) 29.22% Michael Crass (Libertarian) 1.63% |
| Indiana 2 | David McIntosh | Republican | 1994 | Incumbent re-elected. | √ David McIntosh (Republican) 57.83% Marc Carmichael (Democratic) 39.98% Paul E. Zimmerman (Libertarian) 2.19% |
| Indiana 3 | Tim Roemer | Democratic | 1990 | Incumbent re-elected. | √ Tim Roemer (Democratic) 57.92% Joe Zakas (Republican) 40.90% Bernie Taylor (Libertarian) 1.18% |
| Indiana 4 | Mark Souder | Republican | 1994 | Incumbent re-elected. | √ Mark Souder (Republican) 58.37% Gerald Houseman (Democratic) 39.32% Ken Bisson (Libertarian) 2.31% |
| Indiana 5 | Steve Buyer | Republican | 1992 | Incumbent re-elected. | √ Steve Buyer (Republican) 61.86% Douglas Clark (Democratic) 35.71% Tom Lehman (Libertarian) 2.43% |
| Indiana 6 | Dan Burton | Republican | 1982 | Incumbent re-elected. | √ Dan Burton (Republican) 75.02% Carrie Dillard-Trammell (Democratic) 23.04% Fred Peterson (Libertarian) 1.93% |
| Indiana 7 | John Myers | Republican | 1966 | Incumbent retired. New member elected. Republican hold. |
√ Edward Pease (Republican) 61.96% Robert Hellmann (Democratic) 34.65% Barbara Bourland (Libertarian) 3.40% |
| Indiana 8 | John Hostettler | Republican | 1994 | Incumbent re-elected. | √ John Hostettler (Republican) 49.97% Jonathan Weinzapfel (Democratic) 48.30% Paul Hager (Libertarian) 1.73% |
| Indiana 9 | Lee H. Hamilton | Democratic | 1964 | Incumbent re-elected. | √ Lee H. Hamilton (Democratic) 56.47% Jean Leising (Republican) 42.51% Diane Feeney (Libertarian) 1.02% |
| Indiana 10 | Andrew Jacobs, Jr. | Democratic | 1964, 1974 | Incumbent retired. New member elected. Democratic hold. |
√ Julia Carson (Democratic) 52.94% Virginia Murphy Blankenbaker (Republican) 44.83% Kurt St. Angelo (Libertarian) 2.22% |
Iowa
| District | Incumbent | Party | First elected |
Result | Candidates |
|---|---|---|---|---|---|
| Iowa 1 | Jim Leach | Republican | 1976 | Incumbent re-elected. | √ Jim Leach (Republican) 52.84% Bob Rush (Democratic) 45.62% Thomas Isenhour (NP) 0.93% Michael Cuddehe (Natural Law) 0.57% |
| Iowa 2 | Jim Nussle | Republican | 1990 | Incumbent re-elected. | √ Jim Nussle (Republican) 53.42% Donna L. Smith (Democratic) 45.86% Albert Schoeman (Libertarian) 0.38% Peter Lamoureaux (Natural Law) 0.32% |
| Iowa 3 | Jim Ross Lightfoot | Republican | 1984 | Incumbent retired to run for U.S. Senator. New member elected. Democratic gain. |
√ Leonard Boswell (Democratic) 49.35% Mike Mahaffey (Republican) 47.64% Jay Marcus (Natural Law) 1.36% Edward Rusk (WC) 1.08% Dick Kruse (Libertarian) 0.54% |
| Iowa 4 | Greg Ganske | Republican | 1994 | Incumbent re-elected. | √ Greg Ganske (Republican) 52.01% Connie McBurney (Democratic) 46.70% Rogers Badgett (Natural Law) 0.47% Carl Olsen (Libertarian) 0.45% Richard McBride (SWP) 0.27% |
| Iowa 5 | Tom Latham | Republican | 1994 | Incumbent re-elected. | √ Tom Latham (Republican) 65.45% MacDonald Smith (Democratic) 33.61% Michael Dimick (Natural Law) 0.90% |
Kansas
| District | Incumbent | Party | First elected |
Result | Results |
|---|---|---|---|---|---|
| Kansas 1 | Pat Roberts | Republican | 1980 | Incumbent retired to run for U.S. Senator.. New member elected. Republican hold. |
√ Jerry Moran (Republican) 73.48% John Divine (Democratic) 24.49% Bill Earnest (Libertarian) 2.03% |
| Kansas 2 | Sam Brownback | Republican | 1994 | Incumbent retired to run for U.S. Senator. New member elected. Republican hold. |
√ Jim Ryun (Republican) 52.20% John Frieden (Democratic) 45.48% Art Clack (Libertarian) 2.32% |
| Kansas 3 | Jan Meyers | Republican | 1984 | Incumbent retired. New member elected. Republican hold. |
√ Vince Snowbarger (Republican) 49.83% Judy Hancock (Democratic) 45.42% Randy Gardner (Reform) 3.40% Charles Clack (Libertarian) 1.34% |
| Kansas 4 | Todd Tiahrt | Republican | 1994 | Incumbent re-elected. | √ Todd Tiahrt (Republican) 50.11% Randy Rathbun (Democratic) 46.62% Seth Warren (Libertarian) 3.26% |
Kentucky
| District | Incumbent | Party | First elected |
Result | Results |
|---|---|---|---|---|---|
| Kentucky 1 | Ed Whitfield | Republican | 1994 | Incumbent re-elected. | √ Ed Whitfield (Republican) 53.55% Dennis Null (Democratic) 46.45% |
| Kentucky 2 | Ron Lewis | Republican | 1994 | Incumbent re-elected. | √ Ron Lewis (Republican) 58.09% Joe Wright (Democratic) 41.91% |
| Kentucky 3 | Mike Ward | Democratic | 1994 | Incumbent lost re-election. New member elected. Republican gain. |
√ Anne Northup (Republican) 50.26% Mike Ward (Democratic) 49.74% |
| Kentucky 4 | Jim Bunning | Republican | 1986 | Incumbent re-elected. | √ Jim Bunning (Republican) 68.39% Denny Bowman (Democratic) 31.61% |
| Kentucky 5 | Hal Rogers | Republican | 1980 | Incumbent re-elected. | √ Hal Rogers (Republican) (unopposed)• |
| Kentucky 6 | Scotty Baesler | Democratic | 1992 | Incumbent re-elected. | √ Scotty Baesler (Democratic) 55.70% Ernie Fletcher (Republican) 44.30% |
Louisiana
| District | Incumbent | Party | First elected |
Result | Candidates |
|---|---|---|---|---|---|
| Louisiana 1 | Robert Livingston | Republican | 1977 | Incumbent re-elected. | √ Robert Livingston (Republican) (unopposed)• |
| Louisiana 2 | William J. Jefferson | Democratic | 1990 | Incumbent re-elected. | √ William J. Jefferson (Democratic) (unopposed)• |
| Louisiana 3 | Billy Tauzin | Republican | 1980 | Incumbent re-elected. | √ Billy Tauzin (Republican) (unopposed)• |
| Louisiana 4 | Jim McCrery | Republican | 1988 | Incumbent re-elected. | √ Jim McCrery (Republican) 71.38% Paul Chachere (Democratic) 28.62% |
| Louisiana 5 | Cleo Fields | Democratic | 1992 | Incumbent retired. New member elected. Republican gain. |
√ John Cooksey (Republican) 58.28% Francis Thompson (Democratic) 41.72% |
| Louisiana 6 | Richard Baker | Republican | 1986 | Incumbent re-elected. | √ Richard Baker (Republican) 69.30% Steve Myers (Democratic) 30.70% |
| Louisiana 7 | Jimmy Hayes | Republican | 1986 | Incumbent retired to run for U.S. Senator. New member elected. Democratic gain. |
√ Chris John (Democratic) 53.12% Hunter Lundy (Democratic) 46.88% |
Maine
| District | Incumbent | Party | First elected |
Result | Candidates |
|---|---|---|---|---|---|
| Maine 1 | Jim Longley | Republican | 1994 | Incumbent lost re-election. New member elected. Democratic gain. |
√ Tom Allen (Democratic) 55.30% Jim Longley (Republican) 44.68% |
| Maine 2 | John Baldacci | Democratic | 1994 | Incumbent re-elected. | √ John Baldacci (Democratic) 71.92% Paul R. Young (Republican) 24.81% Aldric Saucier (Independent) 3.25% |
Maryland
| District | Incumbent | Party | First elected |
Result | Candidates |
|---|---|---|---|---|---|
| Maryland 1 | Wayne Gilchrest | Republican | 1990 | Incumbent re-elected. | √ Wayne Gilchrest (Republican) 61.55% Steven Eastaugh (Democratic) 38.44% |
| Maryland 2 | Robert Ehrlich | Republican | 1994 | Incumbent re-elected. | √ Robert Ehrlich (Republican) 61.82% Connie Dejuliis (Democratic) 38.17% |
| Maryland 3 | Ben Cardin | Democratic | 1986 | Incumbent re-elected. | √ Ben Cardin (Democratic) 67.31% Patrick McDonough (Republican) 32.69% |
| Maryland 4 | Albert Wynn | Democratic | 1992 | Incumbent re-elected. | √ Albert Wynn (Democratic) 85.19% John Kimble (Republican) 14.81% |
| Maryland 5 | Steny Hoyer | Democratic | 1981 | Incumbent re-elected. | √ Steny Hoyer (Democratic) 56.92% John S. Morgan (Republican) 43.08% |
| Maryland 6 | Roscoe Bartlett | Republican | 1992 | Incumbent re-elected. | √ Roscoe Bartlett (Republican) 56.83% Stephen Crawford (Democratic) 43.16% |
| Maryland 7 | Elijah Cummings | Democratic | 1996 | Incumbent re-elected. | √ Elijah Cummings (Democratic) 83.47% Kenneth Kondner (Republican) 16.53% |
| Maryland 8 | Connie Morella | Republican | 1986 | Incumbent re-elected. | √ Connie Morella (Republican) 61.22% Donald Mooers (Democratic) 38.62% |
Massachusetts
| District | Incumbent | Party | First elected |
Result | Candidates |
|---|---|---|---|---|---|
| Massachusetts 1 | John Olver | Democratic | 1991 | Incumbent re-elected. | √ John Olver (Democratic) 52.72% Jane Swift (Republican) 47.24% |
| Massachusetts 2 | Richard Neal | Democratic | 1988 | Incumbent re-elected. | √ Richard Neal (Democratic) 71.67% Mark Steele (Republican) 21.94% Scott Andrichak (Independent) 4.04% Richard Kaynor (Natural Law) 2.25% |
| Massachusetts 3 | Peter Blute | Republican | 1992 | Incumbent lost re-election. New member elected. Democratic gain. |
√ Jim McGovern (Democratic) 52.94% Peter Blute (Republican) 45.35% Dale Friedgen (Natural Law) 1.32% |
| Massachusetts 4 | Barney Frank | Democratic | 1980 | Incumbent re-elected. | √ Barney Frank (Democratic) 71.64% Jonathan Raymond (Republican) 28.33% |
| Massachusetts 5 | Marty Meehan | Democratic | 1992 | Incumbent re-elected. | √ Marty Meehan (Democratic) Unopposed |
| Massachusetts 6 | Peter Torkildsen | Republican | 1992 | Incumbent lost re-election. New member elected. Democratic gain. |
√ John F. Tierney (Democratic) 48.18% Peter Torkildsen (Republican) 48.05% Martin McNulty (Independent) 1.51% Randal Fritz (Constitution) 0.92% Benjamin Gatchell (Independent) 0.74% Orrin Smith (Natural Law) 0.50% |
| Massachusetts 7 | Ed Markey | Democratic | 1976 | Incumbent re-elected. | √ Ed Markey (Democratic) 69.82% Patricia Long (Republican) 30.13% |
| Massachusetts 8 | Joe Kennedy | Democratic | 1986 | Incumbent re-elected. | √ Joe Kennedy (Democratic) 84.26% Philip Hyde (Republican) 15.63% |
| Massachusetts 9 | Joe Moakley | Democratic | 1972 | Incumbent re-elected. | √ Joe Moakley (Democratic) 72.23% Paul Gryska (Republican) 27.75% |
| Massachusetts 10 | Gerry Studds | Democratic | 1972 | Incumbent retired. New member elected. Democratic hold. |
√ Bill Delahunt (Democratic) 54.32% Edward Teague (Republican) 41.74% Charles Laws (Green) 3.69% |
Michigan
| District | Incumbent | Party | First elected |
Result | Candidates |
|---|---|---|---|---|---|
| Michigan 1 | Bart Stupak | Democratic | 1992 | Incumbent re-elected. | √ Bart Stupak (Democratic) 70.67% Bob Carr (Republican) 27.24% Michael Oleniczak (Libertarian) 1.10% Wendy Conway (Natural Law) 0.96% |
| Michigan 2 | Pete Hoekstra | Republican | 1992 | Incumbent re-elected. | √ Pete Hoekstra (Republican) 65.28% Dan Kruszynski (Democratic) 32.95% Bruce A. Smith (Libertarian) 1.21% Henry Ogden Clark (Natural Law) 0.54% |
| Michigan 3 | Vern Ehlers | Republican | 1993 | Incumbent re-elected. | √ Vern Ehlers (Republican) 68.60% Betsy Flory (Democratic) 29.46% Erwin Haas (Libertarian) 1.21% Eric Anderson (Natural Law) 0.70% |
| Michigan 4 | Dave Camp | Republican | 1990 | Incumbent re-elected. | √ Dave Camp (Republican) 65.49% Lisa Donaldson (Democratic) 32.71% Ben Steele (Libertarian) 0.99% Susan Arnold (Natural Law) 0.79% |
| Michigan 5 | James Barcia | Democratic | 1992 | Incumbent re-elected. | √ James Barcia (Democratic) 69.98% Lawrence Sims (Republican) 28.20% Mark Owen (Libertarian) 1.25% Brian Ellison (Natural Law) 0.55% |
| Michigan 6 | Fred Upton | Republican | 1986 | Incumbent re-elected. | √ Fred Upton (Republican) 67.72% Clarence Annen (Democratic) 30.69% Scott Beavers (Libertarian) 1.56% |
| Michigan 7 | Nick Smith | Republican | 1992 | Incumbent re-elected. | √ Nick Smith (Republican) 55.01% Kim Tunnicliff (Democratic) 42.89% Robert Broda (Libertarian) 1.41% Scott Williamson (Natural Law) 0.67% |
| Michigan 8 | Dick Chrysler | Republican | 1994 | Incumbent lost re-election. New member elected. Democratic gain. |
√ Debbie Stabenow (Democratic) 53.76% Dick Chrysler (Republican) 44.14% Doug MacDonald (Libertarian) 1.45% Patricia Rayfield Allen (Natural Law) 0.64% |
| Michigan 9 | Dale Kildee | Democratic | 1976 | Incumbent re-elected. | √ Dale Kildee (Democratic) 59.19% Patrick Nowak (Republican) 38.81% Malcolm Johnson (Libertarian) 1.50% Terrence Shulman (Natural Law) 0.49% |
| Michigan 10 | David Bonior | Democratic | 1976 | Incumbent re-elected. | √ David Bonior (Democratic) 54.38% Susy Heintz (Republican) 43.57% Scott Scott (Libertarian) 1.53% John Litle (Natural Law) 0.51% |
| Michigan 11 | Joe Knollenberg | Republican | 1992 | Incumbent re-elected. | √ Joe Knollenberg (Republican) 61.15% Morris Frumin (Democratic) 35.90% Dick Gach (Libertarian) 1.83% Stuart Goldberg (Natural Law) 1.10% |
| Michigan 12 | Sander Levin | Democratic | 1982 | Incumbent re-elected. | √ Sander Levin (Democratic) 57.40% John Pappageorge (Republican) 40.54% Albert Titran (Libertarian) 1.33% Gail Petrosof (Natural Law) 0.73% |
| Michigan 13 | Lynn Rivers | Democratic | 1994 | Incumbent re-elected. | √ Lynn Rivers (Democratic) 56.57% Joe Fitzsimmons (Republican) 41.31% James Montgomery (Libertarian) 1.43% Jane Cutter (WW) 0.45% Jim Hartnett (SEP) 0.23% |
| Michigan 14 | John Conyers Jr. | Democratic | 1964 | Incumbent re-elected. | √ John Conyers Jr. (Democratic) 85.86% William Ashe (Republican) 12.06% Scott Boman (Libertarian) 0.93% Richard R. Miller (Natural Law) 0.40% Willie Reid (NPA) 0.39% Helen Halyard (SEP) 0.36% |
| Michigan 15 | Barbara-Rose Collins | Democratic | 1990 | Incumbent lost renomination. New member elected. Democratic hold. |
√ Carolyn Kilpatrick (Democratic) 88.36% Stephen Hume (Republican) 9.84% Raymond Warner (Libertarian) 0.83% Kevin Carey (WW) 0.54% Gregory Smith (Natural Law) 0.40% |
| Michigan 16 | John Dingell | Democratic | 1955 | Incumbent re-elected. | √ John Dingell (Democratic) 62.03% James DeSana (Republican) 35.68% Bruce Cain (Libertarian) 1.43% Noha Hamze (WW) 0.46% David Sole (Natural Law) 0.38% |
Minnesota
| District | Incumbent | Party | First elected |
Result | Results |
|---|---|---|---|---|---|
| Minnesota 1 | Gil Gutknecht | Republican | 1994 | Incumbent re-elected. | √ Gil Gutknecht (Republican) 52.67% Mary Rieder (Democratic) 47.17% |
| Minnesota 2 | David Minge | Democratic | 1992 | Incumbent re-elected. | √ David Minge (Democratic) 54.92% Gary Revier (Republican) 41.09% Stan Bentz (Reform) 3.92% |
| Minnesota 3 | Jim Ramstad | Republican | 1990 | Incumbent re-elected. | √ Jim Ramstad (Republican) 70.10% Stanley Leino (Democratic) 29.75% |
| Minnesota 4 | Bruce Vento | Democratic | 1976 | Incumbent re-elected. | √ Bruce Vento (Democratic) 57.02% Dennis Newinski (Democratic) 36.80% Richard Gibbons (Reform) 3.64% Phil Willkie (GRT) 1.41% Dan Vacek (IGR) 1.05% |
| Minnesota 5 | Martin Sabo | Democratic | 1978 | Incumbent re-elected. | √ Martin Sabo (Democratic) 64.32% Jack Uldrich (Republican) 28.49% Erika Anderson (GRT) 5.32% Jennifer Benton (SWP) 1.74% |
| Minnesota 6 | Bill Luther | Democratic | 1994 | Incumbent re-elected. | √ Bill Luther (Democratic) 55.81% Tad Jude (Republican) 43.99% |
| Minnesota 7 | Collin Peterson | Democratic | 1990 | Incumbent re-elected. | √ Collin Peterson (Democratic) 67.94% Darrell McKigney (Republican) 31.85% |
| Minnesota 8 | Jim Oberstar | Democratic | 1974 | Incumbent re-elected. | √ Jim Oberstar (Democratic) 67.31% Andy Larson (Republican) 25.23% Stan Estes (Republican) 6.04% Larry Fuhol (Republican) 1.34% |
Mississippi
| District | Incumbent | Party | First elected |
Result | Candidates |
|---|---|---|---|---|---|
| Mississippi 1 | Roger Wicker | Republican | 1994 | Incumbent re-elected. | √ Roger Wicker (Republican) 67.62% Henry Boyd (Democratic) 30.60% Andy Rouse (Libertarian) 1.25% Luke Lundemo (Natural Law) 0.53% |
| Mississippi 2 | Bennie Thompson | Democratic | 1993 | Incumbent re-elected. | √ Bennie Thompson (Democratic) 59.62% Danny Covington (Republican) 37.96% Will Chipman (Libertarian) 2.42% |
| Mississippi 3 | Sonny Montgomery | Democratic | 1966 | Incumbent retired. New member elected. Republican gain. |
√ Chip Pickering (Republican) 61.36% John Eaves (Democratic) 36.49% Lamen Clemons (Independent) 1.33% Charles Scarborough (Libertarian) 0.82% |
| Mississippi 4 | Mike Parker | Republican | 1988 | Incumbent re-elected. | √ Mike Parker (Republican) 61.22% Kevin Antoine (Democratic) 36.39% Kenneth Welch (IDP) 1.23% Eileen Mahoney (Natural Law) 0.63% Bill Fausek (Libertarian) 0.52% |
| Mississippi 5 | Gene Taylor | Democratic | 1989 | Incumbent re-elected. | √ Gene Taylor (Democratic) 58.28% Dennis Dollar (Republican) 40.08% Le'Roy Carney (Independent) 1.03% Dan E. Rogers (IDP) 0.27% Jordan Gollub (IDP) 0.24% Philip Mayeux (Natural Law) 0.10% |
Missouri
| District | Incumbent | Party | First elected |
Result | Candidates |
|---|---|---|---|---|---|
| Missouri 1 | William Lacy Clay | Democratic | 1968 | Incumbent re-elected. | √ William Lacy Clay (Democratic) 70.16% Daniel O'Sullivan (Republican) 27.63% Tamara Millay (Libertarian) 2.20% |
| Missouri 2 | James Talent | Republican | 1992 | Incumbent re-elected. | √ James Talent (Republican) 61.32% Joan Kelly Horn (Democratic) 37.08% Anton Stever (Libertarian) 1.01% Judith Clessler (Natural Law) 0.60% |
| Missouri 3 | Richard A. "Dick" Gephardt | Democratic | 1976 | Incumbent re-elected. | √ Richard A. "Dick" Gephardt (Democratic) 58.99% Debbie Wheelehan (Republican) 38.75% Michael Crist (Libertarian) 1.70% James Keersemaker (Natural Law) 0.55% |
| Missouri 4 | Ike Skelton | Democratic | 1976 | Incumbent re-elected. | √ Ike Skelton (Democratic) 63.78% Bill Phelps (Republican) 33.91% Ed Hoag (Libertarian) 2.31% |
| Missouri 5 | Karen McCarthy | Democratic | 1994 | Incumbent re-elected. | √ Karen McCarthy (Democratic) 67.40% Penny Bennett (Republican) 28.88% Kevin Hertel (Libertarian) 1.92% Tom Danaher (Natural Law) 1.79% |
| Missouri 6 | Patsy Danner | Democratic | 1992 | Incumbent re-elected. | √ Patsy Danner (Democratic) 68.62% Jeff Bailey (Republican) 29.26% Karl Wetzel (Libertarian) 2.12% |
| Missouri 7 | Mel Hancock | Republican | 1988 | Incumbent retired. New member elected. Republican hold. |
√ Roy Blunt (Republican) 64.87% Ruth Bamberger (Democratic) 31.65% Mike Harman (Libertarian) 2.61% Sharalyn Harris (Natural Law) 0.87% |
| Missouri 8 | Bill Emerson | Republican | 1980 | Died Independent gain. |
√ Jo Ann Emerson (Independent) 50.47% Emily Firebaugh (Democratic) 37.28% Richard Kline (Republican) 10.53% Greg Tlapek (Libertarian) 1.12% David Zimmer (Natural Law) 0.59% |
| Missouri 9 | Harold Volkmer | Democratic | 1976 | Incumbent lost re-election. New member elected. Republican gain. |
√ Kenny Hulshof (Republican) 49.39% Harold Volkmer (Democratic) 47.03% Mitchell Moore (Libertarian) 2.85% Douglas Rexford (Natural Law) 0.73% |
- Jo Ann Emerson was elected as a Republican in a special to serve the remaining months of the term and was elected as an Independent caucusing with Republicans due to Missouri state law. She later switched to the Republican Party a few days after the start of the new Congress.
Montana
| District | Incumbent | Party | First elected |
Result | Candidates |
|---|---|---|---|---|---|
| Montana at-large | Pat Williams | Democratic | 1978 | Incumbent retired. New member elected. Republican gain. |
√ Rick Hill (Republican) 52.41% Bill Yellowtail (Democratic) 43.15% Jim Brooks (Natural Law) 4.43% |
Nebraska
| District | Incumbent | Party | First elected |
Result | Candidates |
|---|---|---|---|---|---|
| Nebraska 1 | Doug Bereuter | Republican | 1978 | Incumbent re-elected. | √ Doug Bereuter (Republican) 74% Don Eret (Democratic) 26% |
| Nebraska 2 | Jon L. Christensen | Republican | 1994 | Incumbent re-elected. | √ Jon L. Christensen (Republican) 56.82% James Martin Davis (Democratic) 40.14% Patricia Dunn (Natural Law) 1.98% Phillip Torrison (Libertarian) 0.87% |
| Nebraska 3 | Bill Barrett | Republican | 1990 | Incumbent re-elected. | √ Bill Barrett (Republican) 77.39% John Webster (Democratic) 22.53% |
Nevada
| District | Incumbent | Party | First elected |
Result | Candidates |
|---|---|---|---|---|---|
| Nevada 1 | John Ensign | Republican | 1994 | Incumbent re-elected. | √ John Ensign (Republican) 50% Bob Coffin (Democratic) 43.50% Ted Gunderson (IA) 2.65% James Dan (Libertarian) 1.94% Richard Eidson (Natural Law) 1.81% |
| Nevada 2 | Barbara Vucanovich | Republican | 1982 | Incumbent retired. New member elected. Republican hold. |
√ Jim Gibbons (Republican) 58.56% Thomas Wilson (Democratic) 35.26% Dan Hansen (IA) 3.17% Lois Avery (Libertarian) 1.67% Louis Tomburello (Libertarian) 1.35% |
New Hampshire
| District | Incumbent | Party | First elected |
Result | Candidates |
|---|---|---|---|---|---|
| New Hampshire 1 | Bill Zeliff | Republican | 1990 | Incumbent retired to run for Governor of New Hampshire. New member elected. Republican hold. |
√ John Sununu (Republican) 50.03% Joe Keefe (Democratic) 46.61% Gary Flanders (Libertarian) 3.30% |
| New Hampshire 2 | Charlie Bass | Republican | 1994 | Incumbent re-elected. | √ Charlie Bass (Republican) 50.50% Deborah Arnesen (Democratic) 43.46% Carole Lamirande (Independent) 4.42% Roy Kendel (IA) 1.53% |
New Jersey
| District | Incumbent | Party | First elected |
Result | Candidates |
|---|---|---|---|---|---|
| New Jersey 1 | Rob Andrews | Democratic | 1990 | Incumbent re-elected. | √ Rob Andrews (Democratic) 76.12% Mel Suplee (Republican) 21.02% Michael Edmondson (Libertarian) 1.27% Patricia Bily (Natural Law) 0.89% Norman Wahner (CNJ) 0.71% |
| New Jersey 2 | Frank LoBiondo | Republican | 1994 | Incumbent re-elected. | √ Frank LoBiondo (Republican) 60.31% Ruth Katz (Democratic) 38.01% David Headrick (TLL) 0.65% Judith Azaren (Natural Law) 0.53% Andrea Lippi (JPR) 0.49% |
| New Jersey 3 | Jim Saxton | Republican | 1984 | Incumbent re-elected. | √ Jim Saxton (Republican) 64.21% John Leonardi (Democratic) 33.26% Janice Presser (Democratic) 1.24% Agnes James (CNJ) 0.55% Eugene Ashworth (Natural Law) 0.46% Ken Feduniewicz (AF) 0.27% |
| New Jersey 4 | Chris Smith | Republican | 1980 | Incumbent re-elected. | √ Chris Smith (Republican) 63.62% Kevin Meara (Democratic) 33.71% Robert Figueroa (TLL) 1.30% Morgan Strong (CNJ) 0.88% Arnold Kokans (Natural Law) 0.48% |
| New Jersey 5 | Marge Roukema | Republican | 1980 | Incumbent re-elected. | √ Marge Roukema (Republican) 71.29% Bill Auer (Democratic) 24.75% Lorraine La Neve (CNJ) 1.61% Dan Karlan (Libertarian) 0.83% Helen Hamilton (Natural Law) 0.66% Barry Childers (RP) 0.50% Gregory Kresge (USA) 0.35% |
| New Jersey 6 | Frank Pallone | Democratic | 1988 | Incumbent re-elected. | √ Frank Pallone (Democratic) 61.25% Steven Corodemus (Republican) 36.07% Keith Quarles (Libertarian) 1.00% Richard Sorrentino (CNJ) 0.74% Susan Normandin (Natural Law) 0.61% Stefanie Trice (SWP) 0.32% |
| New Jersey 7 | Bob Franks | Republican | 1992 | Incumbent re-elected. | √ Bob Franks (Republican) 55.39% Larry Lerner (Democratic) 41.83% Dorothy De Laura (CNJ) 1.75% Nicholas Gentile (Natural Law) 0.73% Robert G. Robertson (SWP) 0.30% |
| New Jersey 8 | Bill Martini | Republican | 1994 | Incumbent lost re-election. New member elected. Democratic gain. |
√ Bill Pascrell (Democratic) 51.20% Bill Martini (Republican) 47.68% Jeffrey Levine (Natural Law) 0.84% |
| New Jersey 9 | Robert Torricelli | Democratic | 1982 | Incumbent retired to run for U.S. Senator. New member elected. Democratic hold. |
√ Steve Rothman (Democratic) 55.77% Kathleen Donovan (Republican) 42.20% Arthur Rosen (NJI) 1.29% Leon Myerson (Libertarian) 0.73% |
| New Jersey 10 | Don Payne | Democratic | 1988 | Incumbent re-elected. | √ Don Payne (Democratic) 84.16% Vanessa Williams (Republican) 14.62% Harley Tyler (Natural Law) 0.79% Toni Jackson (SWP) 0.43% |
| New Jersey 11 | Rodney Frelinghuysen | Republican | 1994 | Incumbent re-elected. | √ Rodney Frelinghuysen (Republican) 66.27% Chris Evangel (Democratic) 30.86% Ed De Mott (CNJ) 1.12% Austin Lett (Libertarian) 1.03% Victoria Spruiell (Natural Law) 0.72% |
| New Jersey 12 | Dick Zimmer | Republican | 1990 | Incumbent retired to run for U.S. Senator. New member elected. Republican hold. |
√ Mike Pappas (Republican) 50.45% David Del Vecchio (Democratic) 46.65% Virginia Flynn (Libertarian) 1.47% Joseph Mercurio (CNJ) 0.98% Philip Cenicola (Natural Law) 0.45% |
| New Jersey 13 | Bob Menendez | Democratic | 1992 | Incumbent re-elected. | √ Bob Menendez (Democratic) 78.83% Carlos Munoz (Republican) 17.36% Herbert Shaw (PC) 1.46% Mike Buoncristiano (Libertarian) 1.43% William Estrada (SWP) 0.49% Rupert Ravens (Natural Law) 0.43% |
New Mexico
| District | Incumbent | Party | First elected |
Result | Candidates |
|---|---|---|---|---|---|
| New Mexico 1 | Steven Schiff | Republican | 1988 | Incumbent re-elected. | √ Steven Schiff (Republican) 56.60% John Wertheim (Democratic) 37.10% John Uhrich (Green) 3.98% Betty Turrietta-Koury (Independent) 2.31% |
| New Mexico 2 | Joe Skeen | Republican | 1980 | Incumbent re-elected. | √ Joe Skeen (Republican) 55.93% Shirley Baca (Democratic) 44.07% |
| New Mexico 3 | Bill Richardson | Democratic | 1982 | Incumbent re-elected. | √ Bill Richardson (Democratic) 67.25% Bill Redmond (Republican) 30.54% Ed Nagel (Libertarian) 2.21% |
New York
| District | Incumbent | Party | First elected |
Result | Candidates |
|---|---|---|---|---|---|
| New York 1 | Michael Forbes | Republican | 1994 | Incumbent re-elected. | √ Michael Forbes (Republican) 54.72% Nora Bredes (Democratic) 45.28% |
| New York 2 | Rick Lazio | Republican | 1992 | Incumbent re-elected. | √ Rick Lazio (Republican) 64.23% Kenneth Herman (Democratic) 33.19% Alice Ross (RTL) 2.58% |
| New York 3 | Peter King | Republican | 1992 | Incumbent re-elected. | √ Peter King (Republican) 55.30% Dal LaMagna (Democratic) 42.14% John O'Shea (RTL) 1.78% John De Prima (Libertarian) 0.78% |
| New York 4 | Daniel Frisa | Republican | 1994 | Incumbent lost re-election. New member elected. Democratic gain. |
√ Carolyn McCarthy (Democratic) 57.49% Daniel Frisa (Republican) 40.51% Vincent Garbitelli (RTL) 1.47% Robert Berkowitz (Libertarian) 0.52% |
| New York 5 | Gary Ackerman | Democratic | 1983 | Incumbent re-elected. | √ Gary Ackerman (Democratic) 63.66% Grant Lally (Republican) 35.01% Andrew Duff (RTL) 1.33% |
| New York 6 | Floyd Flake | Democratic | 1986 | Incumbent re-elected. | √ Floyd Flake (Democratic) 84.85% Jorawar Misir (Republican) 15.14% |
| New York 7 | Thomas Manton | Democratic | 1984 | Incumbent re-elected. | √ Thomas Manton (Democratic) 71.07% Rose Birtley (Republican) 28.93% |
| New York 8 | Jerrold Nadler | Democratic | 1992 | Incumbent re-elected. | √ Jerrold Nadler (Democratic) 82.28% Michael Benjamin (Republican) 16.23% George Galip (Con) 1.48% |
| New York 9 | Charles Schumer | Democratic | 1980 | Incumbent re-elected. | √ Charles Schumer (Democratic) 74.79% Robert Verga (Republican) 21.29% Michael Mossa (Con) 3.92% |
| New York 10 | Ed Towns | Democratic | 1982 | Incumbent re-elected. | √ Ed Towns (Democratic) 91.27% Amelia Smith-Parker (Republican) 7.91% Julian Hill (RTL) 0.82% |
| New York 11 | Major Owens | Democratic | 1982 | Incumbent re-elected. | √ Major Owens (Democratic) 91.95% Claudette Hayle (Republican) 8.04% |
| New York 12 | Nydia Velazquez | Democratic | 1992 | Incumbent re-elected. | √ Nydia Velazquez (Democratic) 84.61% Miguel Prado (Republican) 13.64% Eleanor Garcia (SWP) 1.75% |
| New York 13 | Susan Molinari | Republican | 1990 | Incumbent re-elected. | √ Susan Molinari (Republican) 61.56% Tyrone Butler (Democratic) 34.71% Kathleen Marciano (RTL) 2.21% Anita Lerman (IDP) 1.52% |
| New York 14 | Carolyn Maloney | Democratic | 1992 | Incumbent re-elected. | √ Carolyn Maloney (Democratic) 72.42% Jeffrey Livingston (Republican) 23.72% Thomas Leighton (Green) 1.95% Joseph Lavezzo (Con) 1.22% Delco Cornett (RTL) 0.68% |
| New York 15 | Charles B. Rangel | Democratic | 1970 | Incumbent re-elected. | √ Charles B. Rangel (Democratic) 91.31% Edward Adams (Republican) 4.77% Ruben Vargas (Con) 3.12% Jose Suero (RTL) 0.79% |
| New York 16 | Jose Serrano | Democratic | 1990 | Incumbent re-elected. | √ Jose Serrano (Democratic) 96.31% Rodney Torres (Republican) 2.90% Owen Camp (Con) 0.79% |
| New York 17 | Eliot Engel | Democratic | 1988 | Incumbent re-elected. | √ Eliot Engel (Democratic) 84.98% Denis McCarthy (Republican) 13.33% Dennis Coleman (IDP) 1.68% |
| New York 18 | Nita Lowey | Democratic | 1988 | Incumbent re-elected. | √ Nita Lowey (Democratic) 63.64% Kerry Katsorhis (Republican) 32.03% Concetta Ferrara (IDP) 2.31% Florence O'Grady (RTL) 2.02% |
| New York 19 | Sue Kelly | Republican | 1994 | Incumbent re-elected. | √ Sue Kelly (Republican) 46.30% Richard Klein (Democratic) 39.40% Joseph DioGuardi (Con) 12.43% William Haase (IDP) 1.86% |
| New York 20 | Benjamin Gilman | Republican | 1972 | Incumbent re-elected. | √ Benjamin Gilman (Republican) 57.07% Yash Aggarwal (Democratic) 37.63% Robert Garrison (RTL) 2.96% Ira Goodman (IDP) 2.34% |
| New York 21 | Mike McNulty | Democratic | 1988 | Incumbent re-elected. | √ Mike McNulty (Democratic) 66.10% Nancy Norman (Republican) 26.89% Lee Wasserman (Libertarian) 7.00% |
| New York 22 | Gerald Solomon | Republican | 1978 | Incumbent re-elected. | √ Gerald Solomon (Republican) 60.48% Steve James (Democratic) 39.52% |
| New York 23 | Sherwood Boehlert | Republican | 1982 | Incumbent re-elected. | √ Sherwood Boehlert (Republican) 64.34% Bruce Hapanowicz (Democratic) 26.04% Thomas Loughlin (IDP) 5.59% William Tapley (RTL) 4.02% |
| New York 24 | John McHugh | Republican | 1992 | Incumbent re-elected. | √ John McHugh (Republican) 71.12% Donald Ravenscroft (Democratic) 25.01% William Beaumont (Democratic) 3.86% |
| New York 25 | Jim Walsh | Republican | 1988 | Incumbent re-elected. | √ Jim Walsh (Republican) 55.11% Marty Mack (Democratic) 44.89% |
| New York 26 | Maurice Hinchey | Democratic | 1992 | Incumbent re-elected. | √ Maurice Hinchey (Democratic) 55.21% Sue Wittig (Republican) 42.30% Douglas Drazen (IDP) 2.48% |
| New York 27 | Bill Paxon | Republican | 1988 | Incumbent re-elected. | √ Bill Paxon (Republican) 59.88% Thomas Fricano (Democratic) 40.12% |
| New York 28 | Louise Slaughter | Democratic | 1986 | Incumbent re-elected. | √ Louise Slaughter (Democratic) 57.25% Geoff Rosenberger (Republican) 42.75% |
| New York 29 | John LaFalce | Democratic | 1974 | Incumbent re-elected. | √ John LaFalce (Democratic) 61.99% David Callard (Republican) 38.01% |
| New York 30 | Jack Quinn | Republican | 1992 | Incumbent re-elected. | √ Jack Quinn (Republican) 54.82% Francis Pordum (Democratic) 45.18% |
| New York 31 | Amo Houghton | Republican | 1986 | Incumbent re-elected. | √ Amo Houghton (Republican) 71.56% Bruce Mac Bain (Democratic) 25.35% Le Roy Wilson (RTL) 3.09% |
North Carolina
| District | Incumbent | Party | First elected |
Result | Candidates |
|---|---|---|---|---|---|
| North Carolina 1 | Eva Clayton | Democratic | 1992 | Incumbent re-elected. | √ Eva Clayton (Democratic) 65.90% Ted Tyler (Republican) 33.12% Todd Murphrey (Libertarian) 0.65% Joseph Boxerman (Natural Law) 0.32% |
| North Carolina 2 | David Funderburk | Republican | 1994 | Incumbent lost re-election. New member elected. Democratic gain. |
√ Bob Etheridge (Democratic) 52.54% David Funderburk (Republican) 45.68% Mark D. Jackson (Libertarian) 1.34% Robert Argy (Natural Law) 0.44% |
| North Carolina 3 | Walter Jones Jr. | Republican | 1994 | Incumbent re-elected. | √ Walter Jones Jr. (Republican) 62.66% George Parrott (Democratic) 36.53% Jon Williams (Natural Law) 0.81% |
| North Carolina 4 | Fred Heineman | Republican | 1994 | Incumbent lost re-election. New member elected. Democratic gain. |
√ David Price (Democratic) 54.39% Fred Heineman (Republican) 43.76% David Allen Walker (Libertarian) 1.43% Russell Wollman (Natural Law) 0.42% |
| North Carolina 5 | Richard Burr | Republican | 1994 | Incumbent re-elected. | √ Richard Burr (Republican) 62.08% Neil Cashion (Democratic) 35.44% Barbara Howe (Libertarian) 2.00% Craig Berg (Natural Law) 0.48% |
| North Carolina 6 | Howard Coble | Republican | 1984 | Incumbent re-elected. | √ Howard Coble (Republican) 72.43% Mark Costley (Democratic) 25.39% Gary Goodson (Libertarian) 1.18% |
| North Carolina 7 | Charlie Rose | Democratic | 1972 | Incumbent retired. New member elected. Democratic hold. |
√ Mike McIntyre (Democratic) 52.88% Bill Caster (Republican) 45.82% Chris Nubel (Libertarian) 0.95% Garrison Frantz (Natural Law) 0.34% |
| North Carolina 8 | Bill Hefner | Democratic | 1974 | Incumbent re-elected. | √ Bill Hefner (Democratic) 55.18% Curtis Blackwood (Republican) 43.70% Thomas Carlisle (Natural Law) 1.12% |
| North Carolina 9 | Sue Myrick | Republican | 1994 | Incumbent re-elected. | √ Sue Myrick (Republican) 62.95% Mike Daisley (Democratic) 35.40% David Knight (Libertarian) 0.97% Jeannine Austin (Natural Law) 0.64% |
| North Carolina 10 | Cass Ballenger | Republican | 1986 | Incumbent re-elected. | √ Cass Ballenger (Republican) 69.98% Ben Neill (Democratic) 28.73% Richard Kahn (Natural Law) 1.28% |
| North Carolina 11 | Charles Taylor | Republican | 1990 | Re-elected | √ Charles Taylor (Republican) 58.26% James Mark Ferguson (Democratic) 40.02% Phil McCanless (Libertarian) 1.01% Milton Burrill (Natural Law) 0.70% |
| North Carolina 12 | Mel Watt | Democratic | 1992 | Incumbent re-elected. | √ Mel Watt (Democratic) 71.49% Joe Martino (Republican) 26.71% Roger Kohn (Libertarian) 1.07% Walter Lewis (Natural Law) 0.73% |
North Dakota
| District | Incumbent | Party | First elected |
Result | Candidates |
|---|---|---|---|---|---|
| North Dakota at-large | Earl Pomeroy | Democratic-NPL | 1992 | Incumbent re-elected. | √ Earl Pomeroy (D-NPL) 55.07% Kevin Cramer (Republican) 43.22% Kenneth Loughead (Independent) 1.71% |
Ohio
| District | Incumbent | Party | First elected |
Result | Candidates |
|---|---|---|---|---|---|
| Ohio 1 | Steve Chabot | Republican | 1994 | Incumbent re-elected. | √ Steve Chabot (Republican) 54.17% Mark Longabaugh (Democratic) 43.36% John Halley (Natural Law) 2.46% |
| Ohio 2 | Robert J. Portman | Republican | 1993 | Incumbent re-elected. | √ Robert J. Portman (Republican) 72.01% Thomas R. Chandler (Democratic) 22.36% Kathleen McKnight (Natural Law) 5.36% |
| Ohio 3 | Tony P. Hall | Democratic | 1978 | Incumbent re-elected. | √ Tony P. Hall (Democratic) 63.64% David Westbrock (Republican) 33.33% Dorothy Mackey (Natural Law) 2.24% |
| Ohio 4 | Michael G. Oxley | Republican | 1981 | Incumbent re-elected. | √ Michael G. Oxley (Republican) 64.81% Paul McClain (Democratic) 30.34% Michael McCaffery (Natural Law) 4.85% |
| Ohio 5 | Paul E. Gillmor | Republican | 1988 | Incumbent re-elected. | √ Paul E. Gillmor (Republican) 61.13% Annie Saunders (Democratic) 34.06% David Schaffer (Natural Law) 4.81% |
| Ohio 6 | Frank Cremeans | Republican | 1994 | Incumbent lost re-election. New member elected. Democratic gain. |
√ Ted Strickland (Democratic) 51.32% Frank Cremeans (Republican) 48.67% |
| Ohio 7 | David L. Hobson | Republican | 1990 | Incumbent re-elected. | √ David L. Hobson (Republican) 67.85% Richard Blain (Democratic) 26.36% Dawn Johnson (Natural Law) 5.78% |
| Ohio 8 | John A. Boehner | Republican | 1990 | Incumbent re-elected. | √ John A. Boehner (Republican) 70.28% Jeffrey Kitchen (Democratic) 26.07% William Baker (Natural Law) 3.65% |
| Ohio 9 | Marcia C. Kaptur | Democratic | 1982 | Incumbent re-elected. | √ Marcia C. Kaptur (Democratic) 81% Randy Whitman (Republican) 20.80% Elizabeth Slotnick (Natural Law) 2.11% |
| Ohio 10 | Martin Hoke | Republican | 1992 | Incumbent lost re-election. New member elected. Democratic gain. |
√ Dennis J. Kucinich (Democratic) 49.06% Martin Hoke (Republican) 46.32% Robert Iverson (Natural Law) 4.61% |
| Ohio 11 | Louis Stokes | Democratic | 1968 | Incumbent re-elected. | √ Louis Stokes (Democratic) 81.22% James Sykora (Republican) 15.25% Sonja Glavina (Natural Law) 3.52% |
| Ohio 12 | John Kasich | Republican | 1982 | Incumbent re-elected. | √ John Kasich (Republican) 63.88% Cynthia Ruccia (Democratic) 33.17% Barbara Edelman (Natural Law) 2.95% |
| Ohio 13 | Sherrod Brown | Democratic | 1992 | Incumbent re-elected. | √ Sherrod Brown (Democratic) 60.49% Kenneth Blair (Republican) 35.92% David Kluter (Natural Law) 3.59% |
| Ohio 14 | Tom Sawyer | Democratic | 1986 | Incumbent re-elected. | √ Tom Sawyer (Democratic) 54.34% Joyce George (Republican) 41.72% Terry Wilkinson (Natural Law) 3.93% |
| Ohio 15 | Deborah D. Pryce | Republican | 1992 | Incumbent re-elected. | √ Deborah D. Pryce (Republican) 70.80% Cliff Arnebeck (Democratic) 29.20% |
| Ohio 16 | Ralph S. Regula | Republican | 1972 | Incumbent re-elected. | √ Ralph S. Regula (Republican) 68.72% Thomas Burkhart (Democratic) 28.00% Brad Graef (Natural Law) 3.28% |
| Ohio 17 | James Traficant | Democratic | 1984 | Incumbent re-elected. | √ James Traficant (Democratic) 90.96% James Cahaney (Natural Law) 9.04% |
| Ohio 18 | Robert W. Ney | Republican | 1994 | Incumbent re-elected. | √ Robert W. Ney (Republican) 50.19% Rob Burch (Democratic) 46.33% Margaret Chitti (Natural Law) 3.48% |
| Ohio 19 | Steven C. LaTourette | Republican | 1994 | Incumbent re-elected. | √ Steven C. LaTourette (Republican) 54.70% Thomas Coyne (Democratic) 40.98% Thomas A. Martin (Natural Law) 4.32% |
Oklahoma
| District | Incumbent | Party | First elected |
Result | Candidates |
|---|---|---|---|---|---|
| Oklahoma 1 | Steve Largent | Republican | 1994 | Incumbent re-elected. | √ Steve Largent (Republican) 68.16% Randolph Amen (Democratic) 27.56% Karla Condray (Independent) 4.28% |
| Oklahoma 2 | Tom Coburn | Republican | 1994 | Incumbent re-elected. | √ Tom Coburn (Republican) 55.47% Glen Johnson (Democratic) 44.53% |
| Oklahoma 3 | Bill Brewster | Democratic | 1990 | Incumbent retired. New member elected. Republican gain. |
√ Wes Watkins (Republican) 51.45% Darryl Roberts (Democratic) 45.24% Scott Demaree (Independent) 3.31% |
| Oklahoma 4 | J. C. Watts | Republican | 1994 | Incumbent re-elected. | √ J. C. Watts (Republican) 57.68% Ed Crocker (Democratic) 39.89% Robert T. Murphy (Independent) 2.43% |
| Oklahoma 5 | Ernest Istook | Republican | 1992 | Incumbent re-elected. | √ Ernest Istook (Republican) 69.72% James Forsythe (Democratic) 27.07% Ava Kennedy (Independent) 3.21% |
| Oklahoma 6 | Frank Lucas | Republican | 1994 | Incumbent re-elected. | √ Frank Lucas (Republican) 63.88% Paul Barby (Democratic) 36.12% |
Oregon
| District | Incumbent | Party | First elected |
Result | Candidates |
|---|---|---|---|---|---|
| Oregon 1 | Elizabeth Furse | Democratic | 1992 | Incumbent re-elected. | √ Elizabeth Furse (Democratic) 51.90% Bill Witt (Republican) 45.28% Richard Johnson (Libertarian) 2.26% David Princ (Socialist) 0.41% |
| Oregon 2 | Wes Cooley | Republican | 1994 | Incumbent retired. New member elected. Republican hold. |
√ Bob Smith (Republican) 61.66% Mike Dugan (Democratic) 36.53% Frank Wise (Libertarian) 1.72% |
| Oregon 3 | Earl Blumenauer | Democratic | 1996 | Incumbent re-elected. | √ Earl Blumenauer (Democratic) 66.93% Scott Bruun (Republican) 26.32% Joe Keating (Green) 3.74% Bruce Knight (Libertarian) 1.80% Victoria Guillebeau (Socialist) 0.99% |
| Oregon 4 | Peter DeFazio | Democratic | 1986 | Incumbent re-elected. | √ Peter DeFazio (Democratic) 65.69% John Newkirk (Republican) 28.40% Tonie Nathan (Libertarian) 1.82% Bill Bonville (Reform) 1.47% David Duemler (Socialist) 0.51% Allan Opus (Green) 0.48% |
| Oregon 5 | Jim Bunn | Republican | 1994 | Incumbent lost re-election. New member elected. Democratic gain. |
√ Darlene Hooley (Democratic) 51.17% Jim Bunn (Republican) 46.00% Lawrence Duquesne (Libertarian) 1.90% Trey Smith (Socialist) 0.78% |
Pennsylvania
| District | Incumbent | Party | First elected |
Result | Candidates |
|---|---|---|---|---|---|
| Pennsylvania 1 | Thomas Foglietta | Democratic | 1980 | Incumbent re-elected. | √ Thomas Foglietta (Democratic) 87.50% James Cella (Republican) 12.49% |
| Pennsylvania 2 | Chaka Fattah | Democratic | 1994 | Incumbent re-elected. | √ Chaka Fattah (Democratic) 87.99% Larry Murphy (Republican) 12.01% |
| Pennsylvania 3 | Robert Borski | Democratic | 1982 | Incumbent re-elected. | √ Robert Borski (Democratic) 68.90% Joseph McColgan (Republican) 31.10% |
| Pennsylvania 4 | Ron Klink | Democratic | 1992 | Incumbent re-elected. | √ Ron Klink (Democratic) 64.20% Paul Adametz (Republican) 35.76% |
| Pennsylvania 5 | Bill Clinger | Republican | 1978 | Incumbent retired. New member elected. Republican hold. |
√ John E. Peterson (Republican) 60.26% Ruth Rudy (Democratic) 39.70% |
| Pennsylvania 6 | Tim Holden | Democratic | 1992 | Incumbent re-elected. | √ Tim Holden (Democratic) 58.55% Christian Leinbach (Republican) 40.70% Thomas List (Natural Law) 0.75% |
| Pennsylvania 7 | Curt Weldon | Republican | 1986 | Incumbent re-elected. | √ Curt Weldon (Republican) 66.93% John Innelli (Democratic) 32.38% John Pronchik (Natural Law) 0.68% |
| Pennsylvania 8 | Jim Greenwood | Republican | 1992 | Incumbent re-elected. | √ Jim Greenwood (Republican) 59.10% John Murray (Democratic) 35.28% Richard Piotrowski (Libertarian) 3.09% David Booth (CST) 2.52% |
| Pennsylvania 9 | Bud Shuster | Republican | 1972 | Incumbent re-elected. | √ Bud Shuster (Republican) 73.70% Monte Kemmler (Democratic) 26.27% |
| Pennsylvania 10 | Joe McDade | Republican | 1962 | Incumbent re-elected. | √ Joe McDade (Republican) 59.78% Joe Cullen (Democratic) 36.22% Thomas McLaughlin (REF) 3.98% |
| Pennsylvania 11 | Paul Kanjorski | Democratic | 1984 | Incumbent re-elected. | √ Paul Kanjorski (Democratic) 68.00% Stephen Urban (Republican) 31.99% |
| Pennsylvania 12 | John Murtha | Democratic | 1974 | Incumbent re-elected. | √ John Murtha (Democratic) 69.99% Bill Choby (Republican) 30.00% |
| Pennsylvania 13 | Jon D. Fox | Republican | 1994 | Incumbent re-elected. | √ Jon D. Fox (Republican) 48.91% Joe Hoeffel (Democratic) 48.87% Thomas Burke (Libertarian) 2.00% |
| Pennsylvania 14 | William Coyne | Democratic | 1980 | Incumbent re-elected. | √ William Coyne (Democratic) 60.68% Bill Ravotti (Republican) 38.96% Paul Scherrer (SEP) 0.35% |
| Pennsylvania 15 | Paul McHale | Democratic | 1992 | Incumbent re-elected. | √ Paul McHale (Democratic) 54.81% Bob Kilbanks (Republican) 41.33% Nicholas Sabatine (Reform) 3.46% Philip Faust (Natural Law) 0.40% |
| Pennsylvania 16 | Robert Walker | Republican | 1976 | Incumbent retired. New member elected. Republican hold. |
√ Joe Pitts (Republican) 59.40% James Blaine (Democratic) 37.50% Robert Yorczyk (Reform) 3.09% |
| Pennsylvania 17 | George Gekas | Republican | 1982 | Incumbent re-elected. | √ George Gekas (Republican) 72.23% Paul Kettl (Democratic) 27.76% |
| Pennsylvania 18 | Mike Doyle | Democratic | 1994 | Incumbent re-elected. | √ Mike Doyle (Democratic) 56.01% David Fawcett (Republican) 40.39% Richard Caligiuri (Independent) 3.19% Ralph Emmerich (Natural Law) 0.41% |
| Pennsylvania 19 | Bill Goodling | Republican | 1974 | Incumbent re-elected. | √ Bill Goodling (Republican) 62.55% Scott Chronister (Democratic) 35.86% Francis Worley (Democratic) 1.53% |
| Pennsylvania 20 | Frank Mascara | Democratic | 1994 | Incumbent re-elected. | √ Frank Mascara (Democratic) 53.89% Mike McCormick (Republican) 46.10% |
| Pennsylvania 21 | Phil English | Republican | 1994 | Incumbent re-elected. | √ Phil English (Republican) 50.68% Ronald DiNicola (Democratic) 49.32% |
Rhode Island
| District | Incumbent | Party | First elected |
Result | Candidates |
|---|---|---|---|---|---|
| Rhode Island 1 | Patrick Kennedy | Democratic | 1994 | Incumbent re-elected. | √ Patrick Kennedy (Democratic) 69.42% Giovanni Cicione (Republican) 28.04% Michael Rollins (Independent) 0.99% Graham Schwass (Green) 0.80% Gregory Raposa (Independent) 0.74% |
| Rhode Island 2 | Jack Reed | Democratic | 1990 | Incumbent retired to run for U.S. Senator. New member elected. Democratic hold. |
√ Robert Weygand (Democratic) 64.47% Richard Wild (Republican) 31.72% Thomas Ricci (Independent) 1.70% Gail Casman (Independent) 1.19% Jack Potter (Independent) 0.92% |
South Carolina
| District | Incumbent | Party | First elected |
Result | Candidates |
|---|---|---|---|---|---|
| South Carolina 1 | Mark Sanford | Republican | 1994 | Incumbent re-elected. | √ Mark Sanford (Republican) 96.36% Joseph Innella (Natural Law) 3.55% |
| South Carolina 2 | Floyd Spence | Republican | 1970 | Incumbent re-elected. | √ Floyd Spence (Republican) 89.76% Maurice Raiford (Natural Law) 10.05% |
| South Carolina 3 | Lindsey Graham | Republican | 1994 | Incumbent re-elected. | √ Lindsey Graham (Republican) 60.29% Debbie Dorn (Democratic) 38.73% Linda Pennington (Natural Law) 0.97% |
| South Carolina 4 | Bob Inglis | Republican | 1992 | Incumbent re-elected. | √ Bob Inglis (Republican) 70.92% Darrell Curry (Democratic) 27.78% Faye Walters (Natural Law) 1.28% |
| South Carolina 5 | John Spratt | Democratic | 1982 | Incumbent re-elected. | √ John Spratt (Democratic) 54.08% Larry Bigham (Republican) 45.26% P.G. Joshi (Natural Law) 0.64% |
| South Carolina 6 | Jim Clyburn | Democratic | 1992 | Incumbent re-elected. | √ Jim Clyburn (Democratic) 69.41% Gary McLeod (Republican) 30.03% Savita Joshi (Natural Law) 0.55% |
South Dakota
| District | Incumbent | Party | First elected |
Result | Candidates |
|---|---|---|---|---|---|
| South Dakota at-large | Tim Johnson | Democratic | 1986 | Incumbent retired to run for U.S. Senator. New member elected. Republican gain. |
√ John Thune (Republican) 57.67% Rick Weiland (Democratic) 36.99% Stacey Nelson (Independent) 3.22% Kurt Evans (Independent) 2.12% |
Tennessee
| District | Incumbent | Party | First elected |
Result | Candidates |
|---|---|---|---|---|---|
| Tennessee 1 | Jimmy Quillen | Republican | 1962 | Incumbent retired. New member elected. Republican hold. |
√ Bill Jenkins (Republican) 64.76% Kay Smith (Democratic) 32.28% Dave Davis (Independent) 1.07% James B. Taylor (Independent) 0.60% Bill Bull Durham (Independent) 0.49% John Curtis (Independent) 0.34% Mike Fugate (Independent) 0.24% Paul Schmidt (Independent) 0.20% |
| Tennessee 2 | Jimmy Duncan Jr. | Republican | 1988 | Incumbent re-elected. | √ Jimmy Duncan Jr. (Republican) 70.68% Stephen Smith (Democratic) 28.57% Chris Dimit (Independent) 0.61% George Njezic (Independent) 0.14% |
| Tennessee 3 | Zach Wamp | Republican | 1994 | Incumbent re-elected. | √ Zach Wamp (Republican) 56.30% Chuck Jolly (Democratic) 42.55% William Cole (Independent) 0.50% Walt Ward (Independent) 0.36% Thomas Morrell (Independent) 0.15% Dick Sims (Independent) 0.14% |
| Tennessee 4 | Van Hilleary | Republican | 1994 | Incumbent re-elected. | √ Van Hilleary (Republican) 55.93% Mark Stewart (Democratic) 39.79% Patrick Lyons (Independent) 3.97% Preston Spaulding (Independent) 0.30% |
| Tennessee 5 | Bob Clement | Democratic | 1988 | Incumbent re-elected. | √ Bob Clement (Democratic) 72.38% Steven Edmondson (Republican) 23.84% Mike Childers (Independent) 3.78% |
| Tennessee 6 | Bart Gordon | Democratic | 1984 | Incumbent re-elected. | √ Bart Gordon (Democratic) 54.42% Steve Gill (Republican) 41.57% Jim Coffer (Independent) 4.01% |
| Tennessee 7 | Ed Bryant | Republican | 1994 | Incumbent re-elected. | √ Ed Bryant (Republican) 64.12% Don Trotter (Democratic) 34.55% Steven Romer (Independent) 1.32% |
| Tennessee 8 | John Tanner | Democratic | 1988 | Incumbent re-elected. | √ John Tanner (Democratic) 67.26% Tom Watson (Republican) 29.92% Donna Malone (Independent) 2.62% |
| Tennessee 9 | Harold Ford, Sr. | Democratic | 1974 | Incumbent retired. New member elected. Democratic hold. |
√ Harold Ford Jr. (Democratic) 61.10% Rod DeBerry (Republican) 37.26% Silky Sullivan (Independent) 0.50% |
Texas
| District | Incumbent | Party | First elected |
Result | Candidates |
|---|---|---|---|---|---|
| Texas 1 | Jim Chapman | Democratic | 1984 | Incumbent retired to run for U.S. Senator. New member elected. Democratic hold. |
√ Max Sandlin (Democratic) 51.56% Ed Merritt (Republican) 46.75% Margaret Palms (Republican) 1.69% |
| Texas 2 | Charles Wilson | Democratic | 1972 | Incumbent retired. New member elected. Democratic hold. |
√ Jim Turner (Democratic) 52.24% Brian Babin (Republican) 45.61% Henry McCullough (Independent) 1.21% David Constant (Libertarian) 0.63% Gary Hardy (Natural Law) 0.30% |
| Texas 3 | Sam Johnson | Republican | 1991 | Incumbent re-elected. | √ Sam Johnson (Republican) 72.98% Lee Cole (Republican) 24.43% John E. Davis (Libertarian) 2.59% |
| Texas 4 | Ralph Hall | Democratic | 1980 | Incumbent re-elected. | √ Ralph Hall (Democratic) 63.77% Jerry Hall (Republican) 34.30% Steven Rothacker (Libertarian) 1.53% Enos Denham (Natural Law) 0.39% |
| Texas 5 | John Bryant | Democratic | 1982 | Incumbent retired to run for U.S. Senator. New member elected. Republican gain. |
√ Pete Sessions (Republican) 53.07% John Pouland (Democratic) 46.93% |
| Texas 6 | Joe Barton | Republican | 1984 | Incumbent re-elected. | √ Joe Barton (Republican) 77.12% Skeet Richardson (Independent) 12.81% Catherine Anderson (Libertarian) 6.93% Doug Williams (US) 3.14% |
| Texas 7 | Bill Archer | Republican | 1970 | Incumbent re-elected. | √ Bill Archer (Republican) 81.37% Al Siegmund (Democratic) 15.09% Gene Hsiao (Independent) 2.08% Randy Sims (Independent) 1.46% |
| Texas 8 | Jack Fields | Republican | 1980 | Incumbent retired. New member elected. Republican hold. |
√ Kevin Brady (Republican) 59.11% Gene Fontenot (Republican) 40.89% |
| Texas 9 | Steve Stockman | Republican | 1994 | Incumbent lost re-election. New member elected. Democratic gain. |
√ Nick Lampson (Democratic) 52.83% Steve Stockman (Republican) 47.16% |
| Texas 10 | Lloyd Doggett | Democratic | 1994 | Incumbent re-elected. | √ Lloyd Doggett (Democratic) 56.20% Teresa Doggett (Republican) 41.36% Gary Johnson (Libertarian) 1.68% Steve Klayman (Natural Law) 0.75% |
| Texas 11 | Chet Edwards | Democratic | 1990 | Incumbent re-elected. | √ Chet Edwards (Democratic) 56.83% Jay Mathis (Republican) 42.37% Ken Hardin (Natural Law) 0.79% |
| Texas 12 | Pete Geren | Democratic | 1989 | Incumbent retired. New member elected. Republican gain. |
√ Kay Granger (Republican) 57.78% Hugh Parmer (Democratic) 41.04% Heather Proffer (Natural Law) 1.17% |
| Texas 13 | Mac Thornberry | Republican | 1994 | Incumbent re-elected. | √ Mac Thornberry (Republican) 66.87% Samuel Silverman (Democratic) 32.29% Don Harkey (Natural Law) 0.84% |
| Texas 14 | Greg Laughlin | Republican | 1988 | Incumbent lost renomination. New member elected. Republican hold. |
√ Ron Paul (Republican) 51.08% Lefty Morris (Democratic) 47.62% Ed Fasanella (Natural Law) 1.30% |
| Texas 15 | Kika de la Garza | Democratic | 1964 | Incumbent retired. New member elected. Democratic hold. |
√ Ruben Hinojosa (Democratic) 62.30% Tom Haughey (Republican) 36.74% Rob Wofford (Natural Law) 0.96% |
| Texas 16 | Ronald Coleman | Democratic | 1982 | Incumbent retired. New member elected. Democratic hold. |
√ Silvestre Reyes (Democratic) 70.63% Rick Ledesma (Republican) 27.60% Carl Proffer (Natural Law) 1.76% |
| Texas 17 | Charles Stenholm | Democratic | 1978 | Incumbent re-elected. | √ Charles Stenholm (Democratic) 51.65% Rudy Izzard (Republican) 47.37% Richard Caro (Natural Law) 0.98% |
| Texas 18 | Sheila Jackson Lee | Democratic | 1994 | Incumbent re-elected. | √ Sheila Jackson Lee (Democratic) 77.07% Larry White (Republican) 10.14% Jerry Burley (Republican) 5.72% George A. Young (Republican) 3.87% Mike Lamson (Democratic) 3.20% |
| Texas 19 | Larry Combest | Republican | 1984 | Incumbent re-elected. | √ Larry Combest (Republican) 80.37% John Sawyer (Democratic) 19.63% |
| Texas 20 | Henry Gonzalez | Democratic | 1961 | Incumbent re-elected. | √ Henry Gonzalez (Democratic) 63.72% James Walker (Republican) 34.40% Alex De Pena (Libertarian) 1.56% Lyndon Felps (Natural Law) 0.32% |
| Texas 21 | Lamar S. Smith | Republican | 1986 | Incumbent re-elected. | √ Lamar S. Smith (Republican) 76.43% Gordon Wharton (Democratic) 22.40% Randy Rutenbeck (Natural Law) 1.16% |
| Texas 22 | Tom DeLay | Republican | 1984 | Incumbent re-elected. | √ Tom DeLay (Republican) 68.11% Scott Cunningham (Democratic) 31.89% |
| Texas 23 | Henry Bonilla | Republican | 1992 | Incumbent re-elected. | √ Henry Bonilla (Republican) 61.85% Charlie Jones (Democratic) 36.37% Linda Caswell (Natural Law) 1.78% |
| Texas 24 | Martin Frost | Democratic | 1978 | Incumbent re-elected. | √ Martin Frost (Democratic) 55.75% Ed Harrison (Republican) 39.07% Marion Jacob (Democratic) 3.33% Dale Mouton (Independent) 1.84% |
| Texas 25 | Ken Bentsen | Democratic | 1994 | Incumbent re-elected. | √ Ken Bentsen (Democratic) 57.32% Dolly Madison McKenna (Republican) 42.68% |
| Texas 26 | Dick Armey | Republican | 1984 | Incumbent re-elected. | √ Dick Armey (Republican) 73.63% Jerry Frankel (Democratic) 26.37% |
| Texas 27 | Solomon Ortiz | Democratic | 1982 | Incumbent re-elected. | √ Solomon Ortiz (Democratic) 64.64% Joe Gardner (Republican) 33.84% Kevin Richardson (Natural Law) 1.52% |
| Texas 28 | Frank Tejeda | Democratic | 1992 | Incumbent re-elected. | √ Frank Tejeda (Democratic) 75.37% Mark Cude (Republican) 23.40% Clifford Finley (Natural Law) 1.23% |
| Texas 29 | Gene Green | Democratic | 1992 | Incumbent re-elected. | √ Gene Green (Democratic) 67.51% Jack Rodriguez (Republican) 31.03% Jack Klinger (US) 1.46% |
| Texas 30 | Eddie Bernice Johnson | Democratic | 1992 | Incumbent re-elected. | √ Eddie Bernice Johnson (Democratic) 54.59% John Hendry (Republican) 18.28% James Sweatt (Republican) 8.76% Marvin Crenshaw (Republican) 6.87% Lisa Kitterman (Republican) 6.86% Lisa Hembry (Independent) 3.10% Ada Granado (Independent) 1.13% Stevan Hammond (Independent) 0.41% |
Utah
| District | Incumbent | Party | First elected |
Result | Candidates |
|---|---|---|---|---|---|
| Utah 1 | James V. Hansen | Republican | 1980 | Incumbent re-elected. | √ James V. Hansen (Republican) 68.31% Gregory Sanders (Democratic) 29.97% Randall Tolpinrud (Natural Law) 1.72% |
| Utah 2 | Enid Greene Waldholtz | Republican | 1994 | Incumbent retired. New member elected. Republican hold. |
√ Merrill Cook (Republican) 54.99% Ross Anderson (Democratic) 42.44% Arly Pederson (Independent) 1.30% Catherine Carter (Natural Law) 1.26% |
| Utah 3 | Bill Orton | Democratic | 1990 | Incumbent lost re-election. New member elected. Republican gain. |
√ Chris Cannon (Republican) 51.14% Bill Orton (Democratic) 47.26% Amy Lassen (Libertarian) 1.13% Gerald Slothower (UN) 0.34% John Langford (SWP) 0.13% |
Vermont
| District | Incumbent | Party | First elected |
Result | Candidates |
|---|---|---|---|---|---|
| Vermont at-large | Bernie Sanders | Independent | 1990 | Incumbent re-elected. | √ Bernie Sanders (Independent) 55.23% Susan Sweetser (Republican) 32.59% Jack Long (Democratic) 9.36% Thomas Morse (Libertarian) 1.06% Peter Diamondstone (LU) 0.77% Robert Melamede (G-VT) 0.53% Norio Kushi (Natural Law) 0.32% |
Virginia
| District | Incumbent | Party | First elected |
Result | Candidates |
|---|---|---|---|---|---|
| Virginia 1 | Herb Bateman | Republican | 1982 | Incumbent re-elected. | √ Herb Bateman (Republican) Unopposed |
| Virginia 2 | Owen B. Pickett | Democratic | 1986 | Incumbent re-elected. | √ Owen B. Pickett (Democratic) 64.77% John Tate (Independent) 35.11% |
| Virginia 3 | Bobby Scott | Democratic | 1992 | Incumbent re-elected. | √ Bobby Scott (Democratic) 82.12% Elsie Holland (Republican) 17.85% |
| Virginia 4 | Norman Sisisky | Democratic | 1982 | Incumbent re-elected. | √ Norman Sisisky (Democratic) 78.61% Tony Zevgolis (Republican) 21.37% |
| Virginia 5 | Lewis Payne | Democratic | 1988 | Incumbent retired. New member elected. Democratic hold. |
√ Virgil Goode (Democratic) 60.79% George Landrith (Republican) 35.81% Tex Wood (VR) 3.35% |
| Virginia 6 | Bob Goodlatte | Republican | 1992 | Incumbent re-elected. | √ Bob Goodlatte (Republican) 67.00% Jeffrey Grey (Democratic) 30.84% Jay Rutledge (Independent) 2.12% |
| Virginia 7 | Thomas J. Bliley, Jr. | Republican | 1980 | Incumbent re-elected. | √ Thomas J. Bliley, Jr. (Republican) 75.10% Roderic Slayton (Democratic) 20.28% Bradley Evans (Independent) 4.56% |
| Virginia 8 | Jim Moran | Democratic | 1990 | Incumbent re-elected. | √ Jim Moran (Democratic) 66.40% John Otey (Republican) 28.14% Ward Edmonds (VR) 2.72% Sarina Grosswald (Independent) 2.28% Charles Severance (Independent) 0.32% |
| Virginia 9 | Rick Boucher | Democratic | 1982 | Incumbent re-elected. | √ Rick Boucher (Democratic) 65.00% Patrick Muldoon (Republican) 30.70% Tom Roberts (VR) 4.27% |
| Virginia 10 | Frank Wolf | Republican | 1980 | Incumbent re-elected. | √ Frank Wolf (Republican) 72.02% Bob Weinberg (Democratic) 25.17% Gary Reams (Independent) 2.76% |
| Virginia 11 | Thomas M. Davis | Republican | 1994 | Incumbent re-elected. | √ Thomas M. Davis (Republican) 64.10% Tom Horton (Independent) 34.51% Levi Levy (Independent) 1.31% |
| Note: VR=Virginia Reform Party | |||||
Washington
| District | Incumbent | Party | First elected |
Result | Candidates |
|---|---|---|---|---|---|
| Washington 1 | Rick White | Republican | 1994 | Incumbent re-elected. | √ Rick White (Republican) 53.74% Jeff Coopersmith (Democratic) 46.26% |
| Washington 2 | Jack Metcalf | Republican | 1994 | Incumbent re-elected. | √ Jack Metcalf (Republican) 48.51% Kevin Quigley (Democratic) 47.76% Karen Leibrant (Natural Law) 3.72% |
| Washington 3 | Linda Smith | Republican | 1994 | Incumbent re-elected. | √ Linda Smith (Republican) 50.18% Brian Baird (Democratic) 49.82% |
| Washington 4 | Doc Hastings | Republican | 1994 | Incumbent re-elected. | √ Doc Hastings (Republican) 52.96% Rick Locke (Democratic) 47.04% |
| Washington 5 | George Nethercutt | Republican | 1994 | Incumbent re-elected. | √ George Nethercutt (Republican) 55.58% Judy Olson (Democratic) 44.41% |
| Washington 6 | Norm Dicks | Democratic | 1976 | Incumbent re-elected. | √ Norm Dicks (Democratic) 65.90% Bill Tinsley (Republican) 30.24% Ted Haley (Independent) 2.36% Michael Huddleston (Natural Law) 1.50% |
| Washington 7 | Jim McDermott | Democratic | 1988 | Incumbent re-elected. | √ Jim McDermott (Democratic) 80.96% Frank Kleschen (Republican) 19.04% |
| Washington 8 | Jennifer Dunn | Republican | 1992 | Incumbent re-elected. | √ Jennifer Dunn (Republican) 65.39% Dave Little (Democratic) 34.61% |
| Washington 9 | Randy Tate | Republican | 1994 | Incumbent lost re-election. New member elected. Democratic gain. |
√ Adam Smith (Democratic) 50.14% Randy Tate (Republican) 47.27% David Gruenstein (Natural Law) 2.59% |
West Virginia
| District | Incumbent | Party | First elected |
Result | Candidates |
|---|---|---|---|---|---|
| West Virginia 1 | Alan Mollohan | Democratic | 1982 | Incumbent re-elected. | √ Alan Mollohan (Democratic) Unopposed |
| West Virginia 2 | Bob Wise | Democratic | 1982 | Incumbent re-elected. | √ Bob Wise (Democratic) 68.89% Greg Morris (Republican) 31.11% |
| West Virginia 3 | Nick Rahall | Democratic | 1976 | Incumbent re-elected. | √ Nick Rahall (Democratic) Unopposed |
Wisconsin
| District | Incumbent | Party | First elected |
Result | Candidates |
|---|---|---|---|---|---|
| Wisconsin 1 | Mark Neumann | Republican | 1994 | Incumbent re-elected. | √ Mark Neumann (Republican) 51% Lydia Spottswood (Democratic) 49% |
| Wisconsin 2 | Scott Klug | Republican | 1990 | Incumbent re-elected. | √ Scott Klug (Republican) 57% Paul Soglin (Democratic) 41% Ben Masel (Libertarian) 2% |
| Wisconsin 3 | Steve Gunderson | Republican | 1980 | Incumbent retired. New member elected. Democratic gain. |
√ Ron Kind (Democratic) 52% James Harsdorf (Republican) 48% |
| Wisconsin 4 | Jerry Kleczka | Democratic | 1984 | Incumbent re-elected. | √ Jerry Kleczka (Democratic) 58% Thomas G. Reynolds (Republican) 42% |
| Wisconsin 5 | Tom Barrett | Democratic | 1992 | Incumbent re-elected. | √ Tom Barrett (Democratic) 73% Paul Melotik (Republican) 25% James Soderna (Taxpayers) 2% |
| Wisconsin 6 | Tom Petri | Republican | 1979 | Incumbent re-elected. | √ Tom Petri (Republican) 73% Al Lindskoog (Democratic) 24% James Dean (Taxpayers) 2% Timothy Farness (Independent) 1% |
| Wisconsin 7 | Dave Obey | Democratic | 1969 | Incumbent re-elected. | √ Dave Obey (Democratic) 57% Scott West (Republican) 43% |
| Wisconsin 8 | Toby Roth | Republican | 1978 | Incumbent retired. New member elected. Democratic gain. |
√ Jay W. Johnson (Democratic) 52% David Prosser, Jr. (Republican) 48% |
| Wisconsin 9 | James Sensenbrenner | Republican | 1979 | Incumbent re-elected. | √ James Sensenbrenner (Republican) 75% Floyd Brenholt (Democratic) 25% |
Wyoming
| District | Incumbent | Party | First elected |
Result | Candidates |
|---|---|---|---|---|---|
| Wyoming at-large | Barbara Cubin | Republican | 1994 | Incumbent re-elected. | √ Barbara Cubin (Republican) 55.24% Pete Maxfield (Democratic) 40.82% Dave Dawson (Libertarian) 3.93% |