2017–18 South Pacific cyclone season
| 2017–18 South Pacific cyclone season | |
|---|---|
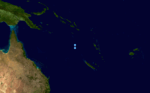
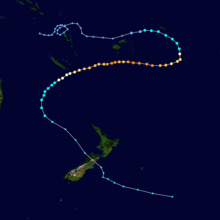
 Season summary map | |
| Seasonal boundaries | |
| First system formed | December 16, 2017 |
| Last system dissipated | April 20, 2018 |
| Strongest storm | |
| Name | Gita |
| • Maximum winds |
205 km/h (125 mph) (10-minute sustained) |
| • Lowest pressure | 927 hPa (mbar) |
| Seasonal statistics | |
| Total disturbances | 14, 1 unofficial |
| Total depressions | 10, 1 unofficial |
| Tropical cyclones | 6, 1 unofficial |
| Severe tropical cyclones | 3 |
| Total fatalities | 11 total |
| Total damage | $285 million (2017 USD) |
| Related articles | |
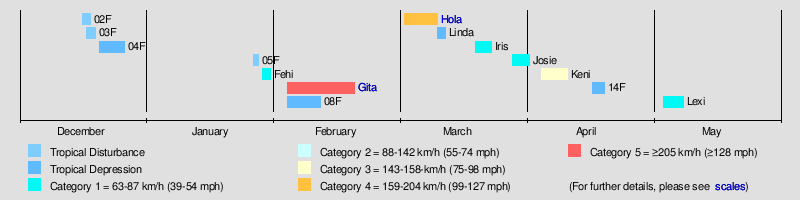
The 2017–18 South Pacific cyclone season was a slightly below-average season that produced a 6 tropical cyclones, 3 of which became severe tropical cyclones. The season officially began on November 1, 2017 and ended on April 30, 2018; however, a tropical cyclone could form at any time between July 1, 2017 and June 30, 2018 and would count towards the season total. During the season, tropical cyclones were officially monitored by the Regional Specialized Meteorological Center (RSMC) in Nadi, Fiji and the Tropical Cyclone Warning Centers in Brisbane, Australia and Wellington, New Zealand. The United States Armed Forces through the Joint Typhoon Warning Center (JTWC) also monitored the basin and issued unofficial warnings for American interests. RSMC Nadi attaches a number and an F suffix to tropical disturbances that form in or move into the basin while the JTWC designates significant tropical cyclones with a number and a P suffix. RSMC Nadi, TCWC Wellington and TCWC Brisbane all use the Australian Tropical Cyclone Intensity Scale and estimate windspeeds over a period of ten minutes, while the JTWC estimates sustained winds over a 1-minute period, which are subsequently compared to the Saffir–Simpson hurricane wind scale (SSHWS).
Seasonal forecasts
| Source/Record | Tropical Cyclone |
Severe Tropical Cyclone |
Ref |
|---|---|---|---|
| Record high: | 1997–98: 16 | 1982–83: 10 | [1] |
| Record low: | 2011–12: 3 | 2008–09: 0 | [1][2] |
| Average (1969-70 - 2016-17): | 7.1 | — | [2] |
| NIWA October | 8-10 | 3-4 | [3] |
| Fiji Meteorological Service | 4-6 | 1-3 | [2] |
| Region | Chance of above average |
Average number |
Actual activity |
| Western South Pacific | 48% | 7 | 5 |
| Eastern South Pacific | 55% | 4 | 0 |
| Source:BOM's South Pacific Tropical Cyclone Season Outlook.[4] | |||
Ahead of the cyclone season, the Fiji Meteorological Service (FMS), Australian Bureau of Meteorology (BoM), New Zealand's MetService and National Institute of Water and Atmospheric Research (NIWA) and various other Pacific Meteorological services, all contributed towards the Island Climate Update tropical cyclone outlook that was released during October 2016.[3] The outlook took into account the ENSO neutral conditions that had been observed across the Pacific and analogue seasons that had ENSO neutral and weak La Nina conditions occurring during the season.[3] The outlook called for a near average number of tropical cyclones for the 2017–18 season, with eight to ten named tropical cyclones, to occur between 135°E and 120°W compared to an average of about 10.[3] At least three of the tropical cyclones were expected to become Category 3 severe tropical cyclones, while two could become Category 4 severe tropical cyclones; they also noted that a Category 5 severe tropical cyclone was not likely to occur during the season.[3]
In addition to contributing towards the Island Climate Update outlook, the FMS and the BoM issued their own seasonal forecasts for the South Pacific region.[2][4] The BoM issued two seasonal forecasts for the Southern Pacific Ocean, for their self-defined eastern and western regions of the South Pacific Ocean.[4] They predicted that the Western region between 142.5°E and 165°E, had a 48% chance of seeing activity above its average of 7 tropical cyclones. The BoM also predicted that the Eastern Region between 165°E and 120°W, had a 55% chance of seeing activity above its average of 4 tropical cyclones.[4] Within their outlook the FMS predicted that between four and six tropical cyclones, would occur within the basin compared to an average of around 7.1 cyclones.[2] At least one of the tropical cyclones was expected to intensify into a Category 3 or higher severe tropical cyclone.[2] They also predicted that the main area for tropical cyclogenesis would be within the Coral Sea, to the west of the International Dateline.[2]
Both the Island Climate Update and the FMS tropical cyclone outlooks assessed the risk of a tropical cyclone affecting a certain island or territory.[2][3] The Island Climate Update Outlook predicted that New Caledonia, Tonga, New Zealand and Papua New Guinea had an above average chance of being impacted by a tropical cyclone or the.[3] They also predicted that the Solomon Islands, Fiji and Vanuatu had a near normal to normal risk of being impacted by one or more tropical cyclones.[3] The Southern Cook Islands, American Samoa, Samoa, Niue, Tokelau, Tuvalu, as well as Wallis and Futuna were thought to have a below average chance of being impacted. It was also considered unlikely that the Northern Cook Islands, French Polynesia, Kiribati and the Pitcairn Islands would be affected by a tropical cyclone.[3] The FMS's outlook predicted that Vanuatu, New Caledonia, Fiji as well as Wallis and Futuna had a normal chance of being impacted by a tropical cyclone.[2] The outlook also predicted that the Solomon Islands, Tokelau, Samoa, Tonga, Niue, Cook Islands and French Polynesia had a reduced chance of being affected by a tropical cyclone.[2] It was thought that there was a normal risk of Vanuatu, New Caledonia, Fiji and Samoa being impacted by at least one severe tropical cyclone, while other areas such as the Solomon Islands, Tokelau, Samoa, Tonga, Niue and French Polynesia, had a reduced chance of being impacted by a severe tropical cyclone.[2]
Seasonal summary
Systems
Tropical Disturbance 02F
| Tropical disturbance (Australian scale) | |
  | |
| Duration | December 16 – December 18 |
|---|---|
| Peak intensity | Winds not specified 1003 hPa (mbar) |
Tropical Disturbance 03F
| Tropical disturbance (Australian scale) | |
 | |
| Duration | December 17 – December 19 |
|---|---|
| Peak intensity | Winds not specified 1000 hPa (mbar) |
Tropical Depression 04F
| Tropical depression (Australian scale) | |
  | |
| Duration | December 20 – December 26 |
|---|---|
| Peak intensity | Winds not specified 998 hPa (mbar) |
Tropical Disturbance 05F
| Tropical disturbance (Australian scale) | |
 | |
| Duration | January 26 – January 27 |
|---|---|
| Peak intensity | Winds not specified 996 hPa (mbar) |
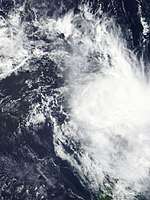
Tropical Cyclone Fehi
| Category 1 tropical cyclone (Australian scale) | |
| Tropical storm (SSHWS) | |
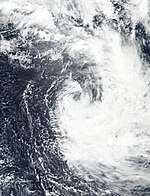  | |
| Duration | January 28 (Entered basin) – January 30 |
|---|---|
| Peak intensity | 85 km/h (50 mph) (10-min) 986 hPa (mbar) |
As a tropical cyclone, Fehi caused extensive damage in western New Zealand. Strong winds and heavy rain damaged hundreds of structures, with more than 100 later condemned. Waist-deep water flooded homes in Charleston and Westport. Pounding surf eroded beaches, exposing an old garbage dump at Cobden Beach which left thousands of garbage bags strewn about. Damage amounted to at least NZ$6.7 million (US$4.9 million).[5]
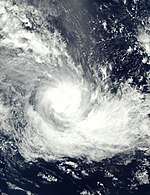
Severe Tropical Cyclone Gita
| Category 5 severe tropical cyclone (Australian scale) | |
| Category 4 tropical cyclone (SSHWS) | |
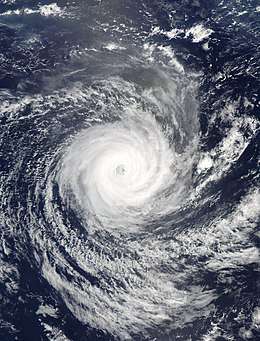  | |
| Duration | February 3 – February 19 |
|---|---|
| Peak intensity | 205 km/h (125 mph) (10-min) 927 hPa (mbar) |
Cyclone Gita affected multiple island nations and territories. Tonga was the hardest-hit, with severe damage occurring on the islands of Tongatapu and ʻEua; two fatalities and forty-one injuries occurred in the kingdom. At least 171 homes were destroyed and more than 1,100 suffered damage. Violent winds destroyed homes and left the two islands largely without power.Damage amounted 160 Million USD(300 Million Pa'anga)becoming the costliest storm in Tonga's History surpassing the previous record holder which was Cyclone Waka in 2002 with 50 Million USD(100 Million Pa'anga. Torrential rains and damaging winds caused widespread disruptions in Samoa and American Samoa, prompting emergency declarations in both. Outlying islands in the Fijian Lau Islands were significantly affected, particularly Ono-i-Lau and Vatoa. Wallis and Futuna, Niue, and Vanuatu were also affected, but impacts in those areas were relatively minor.
Tropical Depression 08F
| Tropical depression (Australian scale) | |
  | |
| Duration | February 3 – February 11 |
|---|---|
| Peak intensity | Winds not specified 994 hPa (mbar) |
Severe Tropical Cyclone Hola
| Category 4 severe tropical cyclone (Australian scale) | |
| Category 3 tropical cyclone (SSHWS) | |
  | |
| Duration | March 3 – March 11 |
|---|---|
| Peak intensity | 165 km/h (105 mph) (10-min) 952 hPa (mbar) |
Tropical Depression 10F (Linda)
| Tropical depression (Australian scale) | |
| Tropical storm (SSHWS) | |
  | |
| Duration | March 11 – March 13 (Exited basin) |
|---|---|
| Peak intensity | 75 km/h (45 mph) (1-min) 998 hPa (mbar) |
On March 11, the FMS reported that Tropical Disturbance 10F, had developed about 85 km (55 mi) to the southwest of Rennell and Bellona Province of the Solomon Islands.[6] The system was poorly organised with deep atmospheric convection, displaced to the east of the system's consolidating low-level circulation center. The disturbance was subsequently classified as Tropical Low 21U by the BoM during March 12, as it moved southwards within an area of low vertical wind shear and warm sea surface temperatures.[7][8] The JTWC initiated advisories on the system later that day and classified the storm as Tropical Cyclone 13P, after the system had rapidly consolidated, with bands of atmospheric convection wrapping into the low-level circulation center.
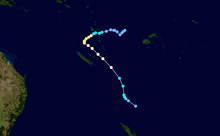
Tropical Cyclone Iris
| Category 1 tropical cyclone (Australian scale) | |
  | |
| Duration | March 20 – March 24 (Exited basin) |
|---|---|
| Peak intensity | 75 km/h (45 mph) (10-min) 993 hPa (mbar) |
On March 24, Tropical Depression 11F strengthened into Tropical Cyclone Iris. Later on the same day, Iris exited the basin and entered the Australian region basin.
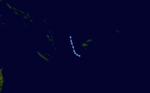
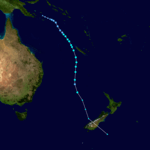
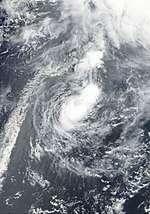
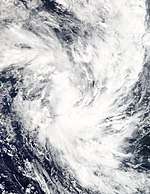
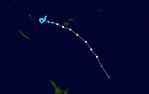
Tropical Cyclone Josie
| Category 1 tropical cyclone (Australian scale) | |
| Tropical storm (SSHWS) | |
  | |
| Duration | March 29 – April 2 |
|---|---|
| Peak intensity | 75 km/h (45 mph) (10-min) 993 hPa (mbar) |
Despite not making landfall, Tropical Cyclone Josie caused heavy rainfall and sustained gale-force winds in southern Fiji.[9] Severe flooding occurred in the city of Nadi,[10] and at least five people were washed away by floodwaters, of which four are confirmed dead and one is still missing.[9]
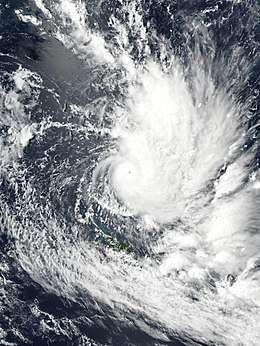
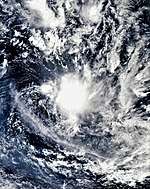
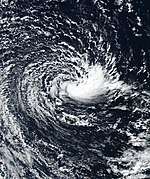
Severe Tropical Cyclone Keni
| Category 3 severe tropical cyclone (Australian scale) | |
| Category 2 tropical cyclone (SSHWS) | |
  | |
| Duration | April 5 – April 11 |
|---|---|
| Peak intensity | 140 km/h (85 mph) (10-min) 970 hPa (mbar) |
Tropical Depression 14F
| Tropical depression (Australian scale) | |
  | |
| Duration | April 17 – April 20 |
|---|---|
| Peak intensity | Winds not specified 1000 hPa (mbar) |
Other systems
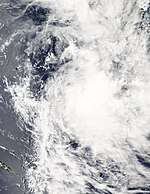
On January 28, the JTWC issued a tropical cyclone formation alert on a tropical disturbance, which was located near the French Polynesian island of Rapa Iti.[11] The system had a well defined low-level circulation, and was located within an area of warm sea surface temperatures and marginal vertical wind shear.[11] The system subsequently peaked with 1-minute sustained wind speeds of 65 km/h (40 mph), which made it equivalent to a tropical storm.[12] The alert was subsequently cancelled during the next day, after the system's low level circulation center became ragged, while atmospheric convection was displaced to the east of the circulation center.[13]
On May 4, 2018, a system identified as a subtropical cyclone formed east of 120°W, just a few hundred miles off the coast of Chile, with researchers unofficially naming the storm Lexi.[14] The cyclone formed in an area without a Regional Specialized Meteorological Center, so it was not officially classified.[15] On May 9, the satellite services division of the NOAA classified the system as a weak subtropical storm, despite occurring in cooler (below 20°C) sea surface temperatures.[16]
Storm names
Within the Southern Pacific a tropical depression is judged to have reached tropical cyclone intensity should it reach winds of 65 km/h, (40 mph) and it is evident that gales are occurring at least halfway around the center. Tropical depressions intensifying into a tropical cyclone between the Equator and 25°S and between 160°E - 120°W named by the RSMC Nadi. However should a tropical depression intensify to the south of 25°S between 160°E and 120°W it would be named in conjunction with RSMC Nadi by TCWC Wellington. Should a tropical cyclone move out of the basin and into the Australian region it would retain its original name. The next 10 names on the naming list as of the start of the season are listed here below.[17] A total of six names were used during the season.
|
Season effects
This table lists all the storms that developed in the South Pacific to the east of longitude 160°E during the 2017–18 season. It includes their intensity on the Australian tropical cyclone intensity scale, duration, name, landfalls, deaths, and damages. All data is taken from RSMC Nadi and/or TCWC Wellington, and all of the damage figures are in 2017 USD.
| Name | Dates active | Peak classification | Sustained wind speeds |
Pressure | Areas affected | Damage (USD) |
Deaths | Refs |
|---|---|---|---|---|---|---|---|---|
| 02F | December 16 – 18 | Tropical disturbance | Not Specified | 1003 hPa (29.62 inHg) | None | None | None | |
| 03F | December 17 – 19 | Tropical disturbance | Not Specified | 1000 hPa (29.53 inHg) | None | None | None | |
| 04F | December 20 – 26 | Tropical depression | Not Specified | 998 hPa (29.47 inHg) | Fiji | None | None | |
| 05F | January 26 – 27 | Tropical disturbance | Not Specified | 996 hPa (29.41 inHg) | New Caledonia | None | None | |
| Fehi | January 28 – 30 | Category 1 tropical cyclone | 85 km/h (50 mph) | 986 hPa (29.12 inHg) | New Caledonia, New Zealand | $50 million | None | [18] |
| Gita | February 3 – 19 | Category 5 severe tropical cyclone | 205 km/h (125 mph) | 927 hPa (27.37 inHg) | Fiji, Wallis and Futuna, Samoan Islands, Niue, Tonga, New Caledonia, New Zealand | $225 million | 2 | [18] |
| 08F | February 3 – 11 | Tropical depression | Not Specified | 994 hPa (29.35 inHg) | Fiji | None | None | |
| Hola | March 3 – 11 | Category 4 severe tropical cyclone | 165 km/h (105 mph) | 952 hPa (28.11 inHg) | Fiji, Vanuatu, New Caledonia, New Zealand | Unknown | 3 | [19][20] |
| 10F | March 11 – 12 | Tropical depression | Not Specified | 998 hPa (29.47 inHg) | None | None | None | |
| Iris | March 20 – 24 | Category 1 tropical cyclone | 75 km/h (45 mph) | 993 hPa (29.32 inHg) | Solomon Islands | None | None | |
| Josie | March 29 – April 2 | Category 1 tropical cyclone | 75 km/h (45 mph) | 993 hPa (29.32 inHg) | Vanuatu, Fiji, Tonga | $5 million | 6 | [18] |
| Keni | April 5 – 11 | Category 3 severe tropical cyclone | 140 km/h (85 mph) | 970 hPa (28.64 inHg) | Vanuatu, Fiji, Tonga | $5 million | None | [18] |
| 14F | April 17 – 20 | Tropical depression | Not Specified | 1000 hPa (29.53 inHg) | Rotuma | Unknown | Unknown | |
| Season aggregates | ||||||||
| 13 systems | November 28 – April 20 | 205 km/h (125 mph) | 927 hPa (27.37 inHg) | $285 million | 11 | |||
See also
- Tropical cyclones in 2018
- List of Southern Hemisphere cyclone seasons
- Atlantic hurricane seasons: 2017, 2018
- Pacific hurricane seasons: 2017, 2018
- Pacific typhoon seasons: 2017, 2018
- North Indian Ocean cyclone seasons: 2017, 2018
- 2017–18 South-West Indian Ocean cyclone season
- 2017–18 Australian region cyclone season
- 2014–15 South Pacific cyclone season
- Subtropical Cyclone Katie
References
- 1 2 Climate Services Division (October 26, 2010). Tropical Cyclone Guidance for Season 2010/11 for the Fiji and the Southwest Pacific (PDF) (Report). Fiji Meteorological Service. Archived from the original (PDF) on February 27, 2012. Retrieved October 17, 2016.
- 1 2 3 4 5 6 7 8 9 10 11 "2017–18 Tropical Cyclone Season Outlook in the Regional Specialised Meteorological Centre Nadi – Tropical Cyclone Centre (RSMC Nadi – TCC) Area of Responsibility (AOR)" (PDF). Fiji Meteorological Service. October 11, 2017. Archived (PDF) from the original on 2017-10-11. Retrieved October 11, 2017.
- 1 2 3 4 5 6 7 8 9 "Southwest Pacific Tropical Cyclone Outlook - October 2017". National Institute of Water and Atmospheric Research. October 10, 2017. Archived from the original on 2017-10-11. Retrieved October 10, 2017.
- 1 2 3 4 National Climate Centre (October 9, 2017). "South Pacific Tropical Cyclone Outlook for 2017 to 2018". Australian Bureau of Meteorology. Archived from the original on 2017-10-11. Retrieved October 11, 2017.
- ↑ Julian Lee (February 6, 2018). "West Coast's ex-cyclone Fehi bill already at $6.7 million". Stuff.co.nz. Retrieved February 6, 2018.
- ↑ "{title}". Archived from the original on 2018-03-18. Retrieved 2018-03-18.
- ↑ "{title}". Archived from the original on 2018-03-12. Retrieved 2018-03-12.
- ↑ "{title}". Archived from the original on 2018-03-12. Retrieved 2018-03-12.
- 1 2 "Tropical Cyclone Josie kills 4 in Fiji". Newshub. Retrieved 2018-04-01.
- ↑ "Tropical Cyclone Josie puts Fiji tourist town under water". www.9news.com.au. Retrieved 2018-04-01.
- 1 2 "Tropical Cyclone Formation Alert January 28, 2018 18z". United States Joint Typhoon Warning Center. January 28, 2018. Archived from the original on 2018-01-28. Retrieved January 29, 2018.
- ↑ https://web.archive.org/web/20180213011619/http://ftp.emc.ncep.noaa.gov/wd20vxt/hwrf-init/decks/bsh942018.dat
- ↑ "Tropical Cyclone Formation Alert Cancellation January 29, 2018 18z". United States Joint Typhoon Warning Center. January 29, 2018. Archived from the original on 2018-01-28. Retrieved January 29, 2018.
- ↑ Steve Young (5 July 2018). "Monthly Global Tropical Cyclone Tracks - May 2018". Australia Severe Weather. Retrieved 3 September 2018.
- ↑ "Subtropical Cyclone". May 7, 2018.
- ↑ "Rare Subtropical Storm off the Coast of Chile". May 9, 2018.
- ↑ RA V Tropical Cyclone Committee (November 18, 2016). Tropical Cyclone Operational Plan for the South-East Indian Ocean and the Southern Pacific Ocean 2016 (PDF) (Report). World Meteorological Organization. pp. I–4 , – II–9 (9–21). Archived (PDF) from the original on November 20, 2016. Retrieved November 20, 2016.
- 1 2 3 4 "Global Catastrophe Recap April 2018" (PDF). thoughtleadership.aonbenfield.com. Aon Benfield. Retrieved 17 May 2018.
- ↑ "Cyclone Hola Kills 1, Injures 2 In Vanuatu". Urdupoint. 9 March 2018.
- ↑ "Two More Tc Hola Deaths Confirmed". 14 March 2018.
External links
| Wikimedia Commons has media related to 2017-18 South Pacific cyclone season. |
- World Meteorological Organization
- Australian Bureau of Meteorology
- Fiji Meteorological Service
- New Zealand MetService
- Joint Typhoon Warning Center
Tropical cyclones of the 2017–18 South Pacific cyclone season | ||
|---|---|---|
| ||
| ||