Ports in India


.jpg)
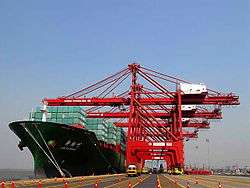
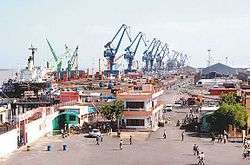
India has a coastline spanning 7516.6 kilometres, forming one of the biggest peninsulas in the world. According to the Ministry of Shipping, around 95 per cent of India's trading by volume and 70 per cent by value is done through maritime transport. It is serviced by 12 major ports, 200 notified minor and intermediate ports. The total 200 non-major ports are in the following States:- Maharashtra (48); Gujarat (42); Tamil Nadu (15); Karnataka (10); Kerala (17); Andhra Pradesh (12); Odisha (13); Goa (5); West Bengal (1); Daman and Diu (2); Lakshadweep (10); Pondicherry (2); and Andaman & Nicobar (23).[1]
Government of India (GoI) plans to modernise these ports and has approved a project called Sagarmala.[2] The ports and shipping industry in India play a vital role in sustaining growth in the country’s trade and commerce. The Indian Government has allowed Foreign Direct Investment (FDI) of up to 100 per cent under the automatic route for port and harbour construction and maintenance projects. The government has also initiated National Maritime Development Programme (NMDP), an initiative to develop the maritime sector with a planned outlay of US$11.8 billion.
Classification of ports
Indian government has a federal structure, and according to its constitution, maritime transport is to be administered by both the Central and the State governments. While the central government's shipping ministry administers the major ports, the minor and intermediate ports are administered by the relevant departments or ministries in the nine coastal states Andhra Pradesh, Odisha, West Bengal, Tamil Nadu, Kerala, Karnataka, Goa, Maharashtra and Gujarat. Several of these 187 minor and intermediate ports have been identified by the respective governments to be developed, in a phased manner, a good proportion of them involving public–private partnership.
Shipping
Major ports handled over 74% of all cargo traffic in 2007. All except Ennore Port are government administered, but private sector participation in ports has increased. There are also 7 shipyards under the control of the central government of India, 2 shipyards controlled by state governments, and 19 privately owned shipyards.
As of 2000, there were 102 shipping companies operating in India, of which five were privately owned and based in India and one was owned by Shipping Corporation of India. There were 639 government-owned ships, including 91 oil tankers, 79 dry cargo bulk carriers, and 10 cellular container vessels. Indian-flagged vessels carried about 15 percent of overseas cargo at Indian ports for financial year 2003.
Cargo handled
The following table gives the detailed data about the major ports of India[3] (Source: Indian Ports Association):
| Name | Cargo Handled (FY2013-14) |
Vessel Traffic (FY2013-14) |
Container Traffic | |||
|---|---|---|---|---|---|---|
| million tonnes | % Increase (over previous FY) |
% Increase (over previous FY) |
'000 TEUs | % Increase (over previous FY) | ||
| Kandla | 87.00 | -7.06% ↓ | 2,734 | 0.74% ↑ | 29 | -75.42% ↓ |
| Paradip | 68.00 | 20.25% ↑ | 1,279 | -4.96% ↓ | 9 | -30.77% ↓ |
| JNPT | 62.37 | -3.32% ↓ | 2,588 | -11.25% ↓ | 4,161 | -2.30% ↓ |
| Mumbai | 59.19 | 1.98% ↑ | 1,949 | -5.25% ↓ | 41 | -14.58% ↓ |
| Visakhapatnam | 58.50 | -0.91% ↓ | 2,066 | -16.36% ↓ | 263 | 6.48% ↑ |
| Chennai | 51.11 | -4.30% ↓ | 1,928 | -5.63% ↓ | 1,468 | -4.68% ↓ |
| Kolkata | 41.39 | 3.65% ↑ | 3,155 | -0.91% ↓ | 563 | -6.17% ↓ |
| Mangalore | 39.37 | 6.29% ↑ | 1,096 | -5.11% ↓ | 50 | 4.17% ↑ |
| Tuticorin | 28.64 | 1.35% ↑ | 1,292 | -13.40% ↓ | 508 | 6.72% ↑ |
| Ennore (Kamarajar Port) | 27.34 | -52.85% ↓ | 475 | 23.38% ↑ | -- | -- |
| Krishnapatnam Port[4] | 36.11 | ↑ | 1060 | ↑ | -- | -- |
| Kochi | 20.89 | 5.25% ↑ | 1,367 | -1.09% ↓ | 351 | -- |
| Mormugao | 11.74 | -33.65% ↓ | 473 | 39.75% ↑ | 22 | 10.00% ↑ |
| All Indian Ports | 555.50 | 1.78% ↑ | 20,402 | -6.95% ↓ | 7,465 | -3.10% ↓ |
| Name | Cargo Handled (FY2014-15) |
Vessel Traffic (FY2014-15) |
Container Traffic | |||
|---|---|---|---|---|---|---|
| million tonnes | % Increase (over previous FY) |
% Increase (over previous FY) |
'000 TEUs | % Increase (over previous FY) | ||
| Kandla | 92.50 | 6.31% ↑ | 2,734 | 0.74% ↑ | 29 | -75.42% ↓ |
| Paradip | 71.01 | 4.42% ↑ | 1,279 | -4.96% ↓ | 9 | -30.77% ↓ |
| JNPT | 63.80 | 2.36% ↑ | 2,588 | -11.25% ↓ | 4,161 | -2.30% ↓ |
| Mumbai | 61.66 | 4.18% ↑ | 1,949 | -5.25% ↓ | 41 | -14.58% ↓ |
| Visakhapatnam | 58.00 | -0.85% ↓ | 2,066 | -16.36% ↓ | 263 | 6.48% ↑ |
| Chennai | 52.54 | 2.81% ↑ | 1,928 | -5.63% ↓ | 1,468 | -4.68% ↓ |
| Kolkata | 46.29 | 11.86% ↑ | 3,155 | -0.91% ↓ | 563 | -6.17% ↓ |
| Krishnapatnam Port | 40.72[5] | 60% ↑ | 961[4] | ↑ | 92 | ↑ |
| Mangalore | 36.57 | -7.11% ↓ | 1,096 | -5.11% ↓ | 50 | 4.17% ↑ |
| Tuticorin | 32.41 | 13.17% ↑ | 1,292 | -13.40% ↓ | 508 | 6.72% ↑ |
| Ennore (Kamarajar Port) | 30.25 | 10.66% ↑ | 475 | 23.38% ↑ | -- | -- |
| Kochi | 21.60 | 3.39% ↑ | 1,367 | -1.09% ↓ | 351 | 4.78% ↑ |
| Mormugao | 14.71 | 25.32% ↑ | 473 | 39.75% ↑ | 22 | 10.00% ↑ |
| All Ports | 581.34 | 4.65% ↑ | 20,402 | -6.95% ↓ | 7,465 | -3.10% ↓ |
| Name | Cargo Handled (FY2016-17) |
Cargo Handled (FY2015-16) |
% Increase (over previous FY) |
|---|---|---|---|
| Kandla | 105.44 | 100.05 | 5.39% ↑ |
| Paradip | 88.96 | 76.39 | 16.45% ↑ |
| JNPT | 62.15 | 64.03 | -2.93% ↑ |
| Mumbai | 63.05 | 61.11 | 3.17% ↑ |
| Visakhapatnam | 61.02 | 57.03 | 6.99% ↑ |
| Chennai | 50.21 | 50.06 | 0.31% ↑ |
| Kolkata | 50.95 | 50.29 | 1.32% ↑ |
| Mangalore | 39.95 | 35.58 | 12.26% ↑ |
| Tuticorin (V.O.Chidambaranar Port) | 38.46 | 36.85 | 4.38% ↑ |
| Ennore (Kamarajar Port) | 30.02 | 32.21 | -6.79% ↑ |
| Cochin | 25.01 | 22.10 | 13.16% ↑ |
| Mormugao | 33.18 | 20.78 | 59.71% ↑ |
| Total[6] | 648.40 | 606.47 | 6.91% ↑ |
References
- ↑ https://web.archive.org/web/20130821132857/http://business.gov.in/Industry_services/ports.php. Archived from the original on 21 August 2013. Missing or empty
|title=(help) - ↑ "Cabinet gives 'in principle' nod to concept of Sagarmala project". Economic Times, Times of India. 27 March 2015. Retrieved 4 July 2015.
- ↑ "Operational Details". Indian Ports Association. Retrieved 17 December 2014.
- 1 2 "Official port website - statistics".
- ↑ "TheHindu".
- ↑ "Cargo Traffic at Major Ports".
External links
| Wikimedia Commons has media related to Ports and harbours in India. |
| Types |
|
|---|---|
| Individual sites |
|
| Rankings | |
| Port management |
|
| Conventions | |
| Organizations |
|
| |
| Companies |
|
|---|---|
| Governance |
|
| Currency | |
| Financial services |
|
| History | |
| People |
|
| States | |
| Sectors | |
| |