BSE SENSEX
 | |
| Type | Stock exchange |
|---|---|
| Location | Mumbai, Maharashtra, India |
| Currency | Indian rupee (₹) |
| Website |
www |
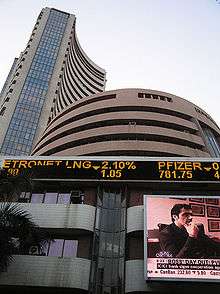
The S&P BSE SENSEX (S&P Bombay Stock Exchange Sensitive Index), also called the BSE 30 or simply the SENSEX, is a free-float market-weighted stock market index of 30 well-established and financially sound companies listed on Bombay Stock Exchange. The 30 component companies which are some of the largest and most actively traded stocks, are representative of various industrial sectors of the Indian economy. Published since 1 January 1986, the S&P BSE SENSEX is regarded as the pulse of the domestic stock markets in India. The base value of the S&P BSE SENSEX is taken as 100 on 1 April 1979 and its base year as 1978–79. On 25 July 2001 BSE launched DOLLEX-30, a dollar-linked version of S&P BSE SENSEX.
As of 25th September 2017, the full market capitalisation of S&P BSE SENSEX was about ₹54,637.0878 billion (US$761 billion) (37% of GDP) while its free-float market capitalisation was ₹30,094.2286 billion (US$419 billion). During 2008-12, Sensex 30 Index share of BSE market capitalisation fell from 49% to 25%[1] due to the rise of sectoral indices like BSE PSU, Bankex, BSE-Teck, etc.
Sensex Name Etymology
The term Sensex was coined by Deepak Mohoni, a stock market analyst.[2][3] It is a portmanteau of the words Sensitive and Index. The initials S&P are derived from Standard & Poor's Financial Services LLC , an American financial services company which also rates and analyses stock market indices such as the U.S based S&P 500, the Canadian S&P/TSX, and the Australian S&P/ASX200 .
Calculation
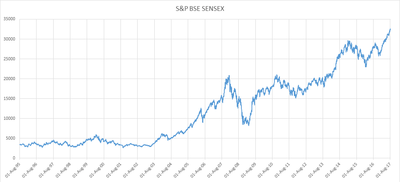
The BSE has some reviews and modifies its composition to be sure it reflects current market conditions. The index is calculated based on a free float capitalisation method, a variation of the market capitalisation method. Instead of using a company's outstanding shares it uses its float, or shares that are readily available for trading. Free Floating capital implies total capitalization less Directors shareholding. [4] As per free float capitalisation methodology, the level of index at any point of time reflects the free float market value of 30 component stocks relative to a base period. The market capitalisation of a company is determined by multiplying the price of its stock by the number of shares issued by corporate actions, replacement of scrips. The index has increased by over twenty five times from June 1990 to the present. Using information from April 1979 onwards, the long-run rate of return on the S&P BSE SENSEX works out to be 18.6% per annum.
Constituents
As of 18 December 2017, SENSEX constitutes of 31 stocks (Tata Motors has two stocks in the list):
| # | Exchange ticker | Companies | Date Added |
|---|---|---|---|
| 1 | 532921 | Adani Ports & SEZ | 21 December 2015[5] |
| 2 | 500820 | Asian Paints | 21 December 2015[5] |
| 3 | 532215 | Axis Bank | |
| 4 | 532977 | Bajaj Auto | |
| 5 | 532454 | Bharti Airtel | |
| 6 | 533278 | Coal India | 8 August 2011[6] |
| 7 | 500124 | Dr. Reddy's Laboratories | |
| 8 | 500180 | HDFC Bank | |
| 9 | 500182 | Hero MotoCorp | |
| 10 | 500696 | Hindustan Unilever | |
| 11 | 500010 | Housing Development Finance Corporation | |
| 12 | 532174 | ICICI Bank | |
| 13 | 532187 | IndusInd Bank | 18 December 2017[7] |
| 14 | 500209 | Infosys | |
| 15 | 500875 | ITC | |
| 16 | 500247 | Kotak Mahindra Bank | 19 June 2017[8] |
| 17 | 500510 | Larsen & Toubro | |
| 18 | 500520 | Mahindra & Mahindra | |
| 19 | 532500 | Maruti Suzuki | |
| 20 | 532555 | NTPC | |
| 21 | 500312 | Oil and Natural Gas Corporation | |
| 22 | 532898 | Power Grid Corporation of India | 20 June 2016[9] |
| 23 | 500325 | Reliance Industries | |
| 24 | 500112 | State Bank of India | |
| 25 | 524715 | Sun Pharmaceutical | 8 August 2011[6] |
| 26 | 532540 | Tata Consultancy Services | |
| 27 | 500570 | Tata Motors | |
| 28 | 570001 | Tata Motors DVR | 19 June 2017[8] |
| 29 | 500470 | Tata Steel | |
| 30 | 507685 | Wipro | |
| 31 | 532648 | Yes Bank | 18 December 2017[7] |
Record values
| Category | All-Time Highs [10] | |
|---|---|---|
| Closing | 38,896.63 | Tuesday, August 28, 2018 |
| Intraday | 38,989.65 | Wednesday, August 29, 2018 |
Milestones
The following is a timeline on the rise of the SENSEX through Indian stock market history.
- 1000, 25 July 1990 – On 25 July 1990, the SENSEX touched the four-digit figure for the first time and closed at 1,001 in the wake of a good monsoon and excellent corporate results.
- 2000, 15 January 1992 – On 15 January 1992, the SENSEX crossed the 2,000 mark and closed at 2,020 followed by the liberal economic policy initiatives undertaken, under the leadership of the then prime minister PV Narasimha Rao, by the then finance minister and Former Prime Minister of India Dr Manmohan Singh.
- 3000, 29 February 1992 – On 29 February 1992, the SENSEX surged past the 3,000 mark in the wake of the market-friendly Budget announced by Manmohan Singh.
- 4000, 30 March 1992 – On 30 March 1992, the SENSEX crossed the 4,000 mark and closed at 4,091 on the expectations of a liberal export-import policy. It was then that the Harshad Mehta scam hit the markets and SENSEX witnessed unabated selling.
- 5000, 11 October 1999 – On 11 October 1999, the SENSEX crossed the 5,000 mark, as the Bharatiya Janata Party-led coalition won the majority in the 13th Lok Sabha election.[11]
- 6000, 11 February 2000 – On 11 February 2000, the information technology boom helped the SENSEX to cross the 6,000 mark and hit an all-time high of 6,006 points. This record would stand for nearly four years, until 2 January 2004, when the SENSEX closed at 6,026.59 points.[12]
- 7000, 21 June 2005 – On 20 June 2005, the news of the settlement between the Ambani brothers boosted investor sentiments and the scrips of RIL, Reliance Energy, Reliance Capital and IPCL made huge gains. This helped the SENSEX crossed 7,000 points for the first time.
- 8000, 8 September 2005 – On 8 September 2005, the Bombay Stock Exchange's benchmark 30-share index – the SENSEX – crossed the 8,000 level following brisk buying by foreign and domestic funds in early trading.
- 9000, 9 December 2005 – The SENSEX on 28 November 2005 crossed 9,000 and touched a peak of 9,000.32 points during mid-session at the Bombay Stock Exchange on the back of frantic buying spree by foreign institutional investors and well supported by local operators as well as retail investors. However, it was on 9 December 2005 that the SENSEX first closed at over 9,000 points.[13]
- 10,000, 7 February 2006 – The SENSEX on 6 February 2006 touched 10,003 points during mid-session. The SENSEX finally closed above the 10,000 mark on 7 February 2006.
- 20,000, 11 December 2007 – The SENSEX on 29 October 2007 crossed the 20,000 mark for the first time during intra-day trading, but closed at 19,977.67 points. However, it was on 11 December 2007 that it finally closed at a figure above 20,000 points on the back of aggressive buying by funds.[11]
- 21,000, 5 November 2010 – The SENSEX on 8 January 2008 crossed the 21,000 mark for the first time, reaching an intra-day peak of 21,078 points, before closing at 20,873.[14] However, it was not until 5 November 2010 that the SENSEX closed at 21,004.96, for its first close above 21,000 points.[15] This record would stand for nearly three years, until 30 October 2013, when the SENSEX closed at 21,033.97 points.[16]
- 19 February 2013 – SENSEX becomes S&P SENSEX as BSE ties up with Standard and Poor's to use the S&P brand for Sensex and other indices.[17]
- 13 March 2014 - The SENSEX closes higher than the Hang Seng Index, to become the major Asian stock market index with the highest value, for the first time ever.
- 22,000, 24 March 2014 – The SENSEX on 10 March 2014 crossed the 22,000 mark for the first time during intra-day trading. However, it was on 24 March 2014 that the index finally closed above the milestone[18] at 22,095.30.[19]
- 23,000, 9 May 2014 - The SENSEX crossed record 23,000 level for the first time, but close just short of the milestone level, on 9 May 2014. The index would close well above the 23,000 mark during the following session.
- 12 May 2014 - The SENSEX closed at its record all-time high of 23,551, a rise of 2.42%(+556.77 points) intraday due to continued fund inflows on hopes of a stable government.[20]
- 24,000, 13 May 2014 - The SENSEX crossed record 24,000 level for the first time, on 13 May 2014 and reached its peak of 24,067.11 due to sustained capital inflows by foreign funds at the domestic bourses and widespread buying by retail investors after exit polls showing the BJP-led NDA forming the government lifted the key indices to new highs.However it closed at a little low at 23,905 points[21]
- 25,000, 16 May 2014 - The SENSEX crossed record 25,000 level for the first time, on 16 May 2014 and reached its peak of 25,364.71 due to winning of the BJP led NDA government by a staggering record marginal difference of all times. However, it closed well below the 25,000 mark. Still, the index closed at its all-time high of 24,121.74, for its first close above 24,000 points.[22] The SENSEX closed at 25,019.51, for its first close above the 25,000 milestone on 5 June 2014[23]
- 26,000, 7 July 2014- The SENSEX crossed record 26,000 level for the first time on 7 July 2014 and reached its peak of 26,123.55, before closing slightly lower at 26,100.08, in anticipation of strong reformatory budget by the new government.[24]
- 27,000, 2 September 2014 - The SENSEX closed at 27,019.39, for its first close above the 27,000 level, on 2 September 2014.[25] This is the sixth 1000-point milestone the index has crossed in 2014, tying a record set in 2007.
- 28,000, 5 November 2014 - The SENSEX crossed 28,000 mark, on 5 November 2014.[26] One week later, on 12 November 2014, the index would close above the milestone for the first time.[27] This is the seventh 1000-point milestone the index has crossed in 2014, breaking the six 1000-point record set in 2007.
- 29,272, 23 January 2015 - BSE Sensex today set a new high of 29,408 points and all-time closing high of 29,278.84, up 272.82 points[28]
- 30,000, 4 March 2015 - The Sensex breaches 30000 mark following steps taken by the Reserve Bank of India in cutting the repo rates.
- 26 April 2017 - The SENSEX closed at 30,133.35, for its first close above the 30,000 level.[29]
- 31,000, 26 May 2017- The SENSEX crossed record 31,000 level for the first time on 26 May 2017 and reached its peak of 31,074.07, before closing slightly lower at 31,028.21.[30]
- 32,000, 13 July 2017 - The SENSEX closed at 32,037.38, for its first close above the 32,000 level, on 13 July 2017.[31]
- 33,000, 25 October 2017 - The SENSEX closed at 33,042.50, for its first close above the 33,000 level.[32]
- 34,000, 26 December 2017 - The SENSEX closed at 34,010.62, for its first close above the 34,000 level.[33]
- 35,000, 17 January 2018 - The SENSEX closed at 35,081.82, for its first close above the 35,000 level.[34]
- 36,000, 23 January 2018 - The SENSEX closed at 36,139.98, for its first close above the 36,000 level.[35]
- 37,000, 27 July 2018 - The SENSEX on 26 July 2018 crossed the 37,000 mark for the first time during intra-day trading. On 27 July 2018 the index closed above the milestone.[36]
- 38,000, 9 August 2018 - For the first time SENSEX passed the score of 38,000 during intra-day trading, and then closed at 38,024.37.[37]
The SENSEX since 2006
May–December 2006
On 22 May 2006, the SENSEX plunged by 1,100 points during intra-day trading, leading to the suspension of trading for the first time since 17 May 2004. The volatility of the SENSEX had caused investors to lose Rs 6 trillion (US$131 billion) within seven trading sessions. The then Finance Minister of India, P. Chidambaram, made an unscheduled press statement when trading was suspended to assure investors that nothing was wrong with the fundamentals of the economy, and advised retail investors to stay invested. When trading resumed after the reassurances of the Reserve Bank of India and the Securities and Exchange Board of India (SEBI), the SENSEX managed to move up 700 points, but still finished the session 457 points in the red.[38]
The SENSEX eventually recovered from the volatility, and on 16 October 2006, the SENSEX closed at an all-time high of 12,928.18 with an intra-day high of 12,953.76. This was a result of increased confidence in the economy and reports that India's manufacturing sector grew by 11.1% in August 2006.
- 13,000, 30 October 2006 – The SENSEX on 30 October 2006 crossed 13,000 mark for the first time, touching a peak of 13,039.36, before closing at 13,024.26 points. It took 135 days to reach 13,000 from 12,000, and 124 days to reach 13,000 from 12,500.
- 14,000, 5 December 2006 – The SENSEX on 5 December 2006 crossed 14,000 mark for the first time, after opening the day with a peak of 14,028 at 9.58 am(IST).
July–September 2007: Effects of the subprime crisis in the U.S.
- 15,000, 6 July 2007- The SENSEX on 6 July 2007 crossed another milestone and reached a magic figure of 15,000. It took 7 months and one day after first reaching the 14,000 milestone to touch this historic milestone.
On 23 July 2007, the SENSEX touched a new high of 15,733 points. On 27 July 2007 the SENSEX witnessed a huge decline because of selling by Foreign Institutional Investors and global cues to come back to 15,160 points by noon. Following global cues and heavy selling in the international markets, the BSE SENSEX fell by 615 points in a single day on 1 August 2007.[39]
- 16,000, 19 September 2007- The SENSEX on 19 September 2007 crossed the 16,000 mark, closing at a historic peak of 16,322. The bull hits because of the rate cut of 50 bit/s in the discount rate by the Fed chief Ben Bernanke.
- 17,000, 26 September 2007- On 26 September 2007, the SENSEX crossed the 17,000 mark for the first time, creating a record for the second fastest 1000 point gain in just 5 trading sessions. It failed however to sustain the momentum and closed below 17,000. The SENSEX closed above 17,000 for the first time on the following day. Reliance group has been the main contributor in this bull run, contributing 256 points. This also helped Mukesh Ambani's net worth to grow to over $50 billion or Rs. 2 trillion. It was also during this record bull run that the SENSEX for the first time zoomed ahead of the Nikkei of Japan.
October–December 2007: Participatory notes issue
- 18,000, 9 October 2007- The SENSEX crossed the 18,000 mark for the first time on 9 October 2007, gaining 788 points, to close at 18,280. The journey from 17,000 to 18,000 took just 8 trading sessions, which is the third fastest 1000-point rise in the history of the SENSEX.
- 19,000, 15 October 2007- The SENSEX crossed the 19,000 mark for the first time on 15 October 2007, gaining 640 points, to close at 19,059. It took just 4 trading sessions for the SENSEX to move from 18,000 to 19,000. This is the fastest 1000-point rise ever for the index. In addition, the rise from 16,000 to 19,000 in 17 trading sessions sets a record for the fastest 3,000-point rally in the history of the SENSEX.
On 16 October 2007, SEBI (Securities & Exchange Board of India) proposed curbs on participatory notes which accounted for roughly 50% of FII investment in 2007. SEBI was not happy with P-notes because it was not possible to know who owned the underlying securities, and hedge funds acting through P-notes might therefore cause volatility in the Indian markets.
However the proposals of SEBI were not clear and this led to a knee-jerk crash when the markets opened on the following day (17 October 2007). Within a minute of opening trade, the SENSEX crashed by 1,744 points or about 9% of its value – the biggest intra-day fall in Indian stock markets in absolute terms till then. This led to the automatic suspension of trade for one hour. Finance Minister P. Chidambaram issued clarifications, in the meantime, that the government was not against FIIs and was not immediately banning PNs. After the market opened at 10:55 am, the index staged a comeback and ended the day at 18715.82, down 336.04 from the last day's close.
However, this would not be the end of the volatility. The next day (18 October 2007), the SENSEX tumbled by 717.43 points – 3.83 per cent – to close at 17,998.39 points. The slide continued the next day (19 October 2007), when the SENSEX fell 438.41 points to settle at 17,559.98 to the end of the week, after touching the lowest level of that week at 17,226.18 during the day.
After detailed clarifications from the SEBI chief M. Damodaran regarding the new rules, the market made an 879-point gain on 23 October, thus signalling the end of the PN crisis.
- 20,000, 11 December 2007- On 29 October 2007, the SENSEX crossed the 20,000 mark for the first time with a massive 734.5-point gain, but closed below the 20,000 mark. The SENSEX would close above the 20,000 mark for the first time on 11 December 2007. It took 42 days after reaching the 19,000 milestone to close above 20,000 points for the first time. The journey of the last 10,000 points was covered in just 483[40] sessions, compared to 7,297 sessions taken to touch the 10,000 mark from its base value of 100 points. In the second half of 2007 alone, the SENSEX reached six 1,000-point milestones.
May 2009
On 18 May 2009, the SENSEX surged up 2,110.79 points to close at 14,285.21, from its previous closing of 12,174.42, for its largest single day rally. Less than a month later, on 4 June 2009, the SENSEX would cross the 15,000 mark.
However, the SENSEX remained volatile during the summer of 2009. The SENSEX plunged by 869.65 points on 6 July 2009, the day of Union Budget presentation in Parliament on concerns over high fiscal deficit. This was the biggest Budget-day loss for the index.[11] On 17 August 2009, the SENSEX lost 626.71 points.
Once again, the SENSEX would recover from the volatility. On 7 September 2009, the SENSEX crossed the 16,000 mark, closing at 16,016.32 points. The index would gain 3,000 points over the next 12 months, as the SENSEX crossed the 19,000 mark on 13 September 2010, closing at 19,208.33 points.
- 21,000, 5 November 2010 - The SENSEX closed at 21,004.96, for its first close above the 21,000 mark. It would take nearly three years for the index to make its next close above this level.
- 22,000, 24 March 2014 - The SENSEX closed at 22,055.48, for its first close above the 22,000 mark. For the first time, the SENSEX zoomed ahead of the Hang Seng Index.
- 23,000, 12 May 2014 - The SENSEX closed at 23,551.00, for its first close above the 23,000 mark,
- 24,000, 16 May 2014 - The SENSEX closed at 24,121.74, for its first close above the 24,000 mark, Breaking all previous records and above all other indexes in the world.
- 25,000, 5 June 2014 - The SENSEX closed at 25,019.51, for its first close above the 25,000 mark,
- 26,000, 7 July 2014 - The SENSEX closed at 26,123.55, for its first close above the 26,000 mark,
- 27,000, 2 September 2014 - The SENSEX closed at 27019.39, for its first close above the 27,000 mark,
- 28,000, 5 November 2014 - The SENSEX crossed 28,000 mark, on 5 November 2014.[26] This is the seventh 1000-point milestone the index has crossed in 2014, breaking the six 1000-point record set in 2007.
Major SENSEX stock market plunges
Also see Stock market crashes in India
January 2008
In the third week of January 2008, the SENSEX experienced huge falls along with other markets around the world. On 21 January 2008, the SENSEX saw its highest ever loss of 1,408 points at the end of the session. The SENSEX recovered to close at 17,605.40 after it tumbled to the day's low of 16,963.96, on high volatility as investors panicked following weak global cues amid fears of a recession in the US.
The next day, the BSE SENSEX index went into a free fall. The index hit the lower circuit breaker in barely a minute after the markets opened at 10 am. Trading was suspended for an hour. On reopening at 10.55 am IST, the market saw its biggest intra-day fall when it hit a low of 15,332, down 2,273 points. However, after reassurance from the Finance Minister of India, the market bounced back to close at 16,730 with a loss of 875 points.[41]
Over the course of two days, the BSE SENSEX in India dropped from 19,013 on Monday morning to 16,730 by Tuesday evening or a two-day fall of 13.9%.[41] Less than a month later, on 11 February 2008, the SENSEX lost 833.98 points, when Reliance Power fell below its IPO price in its debut trade after a high-profile public offer.[11]
March 2008
The free fall of the SENSEX accelerated in March 2008. The month started out with the Sensex losing 900.84 points on 3 March 2008, on concerns emanating from growing credit losses in the US. This would be the first of four one-day falls of greater than 700 points during the month. On 13 March 2008, the SENSEX plummeted another 770.63 points on global economic jitters.[11]
- 14,810, 17 March 2008 - The SENSEX dropped by 951.03 points on the global credit crisis and distress, to fall below the 15,000 mark, closing at 14,810.[11]
The month ended with the SENSEX shedding 726.85 points on 31 March 2008, after heavy selling in blue-chip stocks on global economic fears.
- 13,802, 27 June 2008 - The SENSEX dropped by 600 points, to fall below the 14,000 mark, closing at 13,802.
- 12,962, 1 July 2008 - The SENSEX falls below the 13,000 mark, closing at 12,962.[11]
- 11,802, 6 October 2008 - The SENSEX dropped by 724.62 points amid fears of the US recession and attempts by governments across the world to save their failing banks, to fall below the 12,000 mark, closing at 11,802.[11]
- 10,527, 10 October 2008 - The SENSEX dropped by 800.51 points amid weak industrial production data and concerns over impact of global economic crisis on IT and banking firms in India,[11] to fall below the 11,000 mark, closing at 10,527.
- 9,975, 17 October 2008 – The SENSEX crashes below the psychological 5-figure mark of 10,000 points, closing at 9,975.35, following extremely negative global financial indications in US and other countries. Just ten months earlier, in December 2007, SENSEX had closed above the 20,000 mark for the first time.
- 8,701.07, 24 October 2008 - The SENSEX lost 10.96% of its value (1070.63 points) on the intra-day trade, closing at 8,701.07, for its first close below the 9,000 mark since 14 June 2006, after RBI lowered its GDP growth forecasts on global economic concerns.[11] The loss was the 2nd highest in terms of total points, and the 3rd highest percentage-wise, for a one-day period in the index's history.
- 8,509.56, 27 October 2008 - The SENSEX hit an intra-day low of 7,697.39, before closing at 8,509.56,[11] for its lowest close since 14 November 2005.
Early 2009
The SENSEX dropped by 749.05 points on 7 January 2009, when the Satyam fraud came to light.[11]
- 8,160.40, 9 March 2009 - The SENSEX closed at 8,160.40, for its lowest close since 2 November 2005.
2015
The index crossed the historical mark of 30,000 after repo rate cut announcement by RBI[42]
The index plummeted by over 1,624.51 points on 24 August 2015, the biggest one-day point plunge in the index's history.[43]
Major falls
On the following dates, the SENSEX index suffered major single-day falls (of 430 or more points):[44]
| N. | Date | Points |
|---|---|---|
| 1 | 24 August 2015 | 1624.512 |
| 2 | 21 January 2008 | 1408.35 |
| 3 | 24 October 2008 | 1070.63 |
| 4 | 17 March 2008 | 951.03 |
| 5 | 3 March 2008 | 900.84 |
- 24 August 2015 --- 1,624.51 points
- 21 January 2008 --- 1,408.35 points
- 24 October 2008 --— 1,070.63 points
- 17 March 2008 --- 951.03 points
- 3 March 2008 --- 900.84 points[11]
- 22 January 2008 --- 875 points
- 6 July 2009 --- 869.65 points
- 6 January 2015 --- 854.86 points
- 2 February 2018 --- 839.91 points
- 11 February 2008 --- 833.98 points
- 18 May 2006 --- 826 points
- 11 February 2016 --- 807.07 points
- 4 October 2018 --- 806.47 points
- 5 October 2018 --- 800.51points
- 10 October 2008 --- 792.17 points (latest)
- 13 March 2008 --- 770.63 points
- 17 December 2007 --- 769.48 points
- 16 August 2013 --- 769.41 points
- 7 January 2009 --- 749.05 points
- 31 March 2008[11] --- 726.85 points
- 6 October 2008 --- 724.62 points
- 5 May 2015 --- 722 points
- 17 October 2007 --- 717.43 points
- 15 September 2008 --- 710.00 points
- 22 September 2011 --- 704.00 points
- 11 November 2016 --- 698.86 points
- 18 January 2008 --- 687.82 points
- 21 November 2007 --- 678.18 points
- 26 March 2015 --- 654.25 points[45]
- 3 September 2013 --- 651.47 points[46]
- 16 August 2007 --- 642.70 points
- 17 August 2009 --- 626.71 points
- 2 April 2007 --- 617 points[39]
- 1 August 2007 --- 615 points
- 9 March 2015 --- 604.17 points[47]
- 27 June 2008 --- 600.00 points
- 27 Aug 2013 --- 590.05 points[48]
- 28 April 1992 --- 570 points[38]
- 17 May 2004 --- 565 points[38]
- 24 February 2011 --- 545.92 points
- 22 September 2015 --- 541.14 points
- 16 December 2014 --- 538.12 points[49]
- 4 January 2016 --- 537.55 points.
- 20 June 2013 --- 526.41 points[50]
- 8 July 2014 --- 517.97 points[51]
- 30 January 2015 --- 498.82 points[52]
- 9 February 2015 --- 490.52 points[53]
- 27 February 2012 --- 477.82 points
- 15 May 2006 --- 463 points[38]
- 22 May 2006 --- 457 points
- 31 May 2013 --- 455.10 points
- 18 Nov 2013 --- 451.32 points
- 19 May 2006 --- 453 points[38]
- 6 August 2013 --- 449.22 points[54]
- 16 November 2010 --- 444.55 points
- 4 February 2011 --- 441.92 points
- 12 November 2010 --- 432 points
- 13 May 2013 --- 430.65 points[55]
- 07 Jan 2016 --- 554.50 points
References
- ↑ "Securities and Exchange Board of India Report" (PDF). Sebi.gov.in. Retrieved 18 February 2015.
- ↑ Will Nelson's magic work again for Sensex on Friday?
- ↑ He coined the term Sensex and he now wants a trademark for it
- ↑ "How the Sensex is calculated".
- 1 2 "20151120-9 - Reconstitution of S&P BSE Indices". BSE. 20 November 2015. Archived from the original on 29 August 2017. Retrieved 29 August 2017.
- 1 2 "Coal India, Sun Pharma to enter Sensex on Monday". BusinessLine. PTI. 7 August 2011. Archived from the original on 30 January 2018. Retrieved 30 January 2018.
- 1 2
- 1 2 "20170519-15 - Reconstitution of S&P BSE Indices". BSE. 19 May 2017. Archived from the original on 29 August 2017. Retrieved 29 August 2017.
- ↑ "20160520-25 - Reconstitution of S&P BSE Indices". BSE. 20 May 2016. Archived from the original on 29 August 2017. Retrieved 29 August 2017.
- ↑ "Indian stock exchange". bseindia.com. 2018-01-08. Retrieved 2018-01-08.
- 1 2 3 4 5 6 7 8 9 10 11 12 13 14 "Ups and Downs of Sensex". bemoneyaware.com. Retrieved 21 May 2013.
- ↑ "Funds Hope to Ride on the Boom". ArabNews. Retrieved 14 June 2013.
- ↑ "Sensex at 9k, bulls on Cloud 9 - Money - DNA". Dnaindia.com. Retrieved 14 June 2013.
- ↑ "Sensex hits 21,000; ends up 61 points – Rediff.com Business". In.rediff.com. 8 January 2008. Retrieved 19 September 2011.
- ↑ "Sensex closes above 21,000 level in Diwali Muhurat trade - Money - DNA". Dnaindia.com. Retrieved 14 June 2013.
- ↑ "Sensex ends at record high of 21,033.97, up 105 points | Latest News & Updates at Daily News & Analysis". Dnaindia.com. 2013-10-30. Retrieved 2015-02-18.
- ↑ Vyas Mohan (19 February 2013). "Sensex to carry S&P tag". Livemint. Retrieved 14 June 2013.
- ↑ "Stable govt hope pushes Sensex to life-time high | Business Line". Thehindubusinessline.com. Retrieved 2015-02-18.
- ↑ "Sensex, Nifty attain record closing high | Business Standard News". Business-standard.com. 2014-03-26. Retrieved 2015-02-18.
- ↑ "Sensex at new record high, Nifty breaches 7,000 mark". The Hindu. 2014-05-12. Retrieved 2015-02-18.
- ↑ "Sensex hits new record high of 23,922". The Hindu. 2014-05-13. Retrieved 2015-02-18.
- ↑ "Stock markets: BSE Sensex rallies to record high on Narendra Modi election 2014 win". The Indian Express. 2014-05-16. Retrieved 2015-02-18.
- ↑ "BSE Sensex closes above 25,000-level for the first time - Business Today". Businesstoday.intoday.in. 2014-06-05. Retrieved 2015-02-18.
- ↑ "Sensex surges 138 points on hopes of business-friendly Budget | Business Line". Thehindubusinessline.com. Retrieved 2015-02-18.
- ↑ "Sensex ends above 27000, heavyweights lead show; cements up". Moneycontrol.com. Retrieved 2015-02-18.
- 1 2 "BSE Sensex breaches 28,000-mark; Nifty at 8,363.65". The Indian Express. 2014-11-05. Retrieved 2015-02-18.
- ↑ "Sensex ends above 28000 for 1st time; Tata Steel slips 2%". Moneycontrol.com. Retrieved 2015-02-18.
- ↑ "Sensex hits fresh peak of 29,278, Nifty hits 8,835". Indiatvnews.com. Retrieved 2015-02-18.
- ↑ "Sensex makes history, closes at over 30,000; Nifty reaches all-time high". hindustantimes. 2017-04-27. Retrieved 2017-05-25.
- ↑ "Sensex ends above 31,000 for the first time, Nifty at new peak". india.com. 2017-05-26. Retrieved 2017-05-26.
- ↑ "Sensex closes above 32,000-mark for first time, Nifty rallies too". timesofindia.com. 2017-07-13. Retrieved 2017-07-13.
- ↑ "Government's PSU bank package push Sensex, Nifty to record highs; SBI stock zooms". timesofindia.com. 2017-10-25. Retrieved 2017-10-25.
- ↑ "Closing bell: Sensex closes above 34,000 for the first time, Nifty at record high of 10,531". livemint.com. 2017-12-26. Retrieved 2017-12-26.
- ↑ "Sensex ends at fresh record high of 35,082 for first time; Nifty closes at 10,788". thehindubusinessline.com. 2018-01-17. Retrieved 2018-01-17.
- ↑ "Sensex, Nifty Settle At Fresh Record Highs". rttnews.com. 2018-01-23. Retrieved 2018-01-23.
- ↑ "Sensex logs new all-time high, Nifty too ends at record high; ITC, RIL, HDFC twins, ICICI Bank shares shine". financialexpress.com. 2018-07-27. Retrieved 2018-07-28.
- ↑ "Sensex closes above 38,000 for first time, Nifty at 11,468". zeenews.india.com. 2018-08-09. Retrieved 2018-08-09.
- 1 2 3 4 5 "The 10 Biggest Falls in Sensex History as of 2006". rediff.com. Retrieved 21 May 2013.
- 1 2 "The 10 Biggest Falls in Sensex History as of October 2008". rediff.com. Retrieved 21 May 2013.
- ↑ "Article: MARKET WATCH: Sensex @ 10K: up in 483 days, down in 193. | AccessMyLibrary - Promoting library advocacy". AccessMyLibrary. Retrieved 14 June 2013.
- 1 2 rediff Business Bureau (21 January 2008). "The 10 biggest falls in SENSEX history". MarketWatch. Archived from the original on 27 January 2008. Retrieved 23 January 2008.
- ↑ http://profit.ndtv.com/budget/rajan-backs-jaitley-on-growth-cuts-repo-rate-sensex-hits-30-000-744111
- ↑ "Sensex slips nearly 6 pct; posts biggest fall in 6-1/2 years". Reuters India. August 24, 2015. Retrieved August 24, 2015.
- ↑ "The Hindu News Update Service". Chennai, India: Hindu.com. 22 January 2008. Archived from the original on 27 August 2011. Retrieved 19 September 2011.
- ↑ http://economictimes.indiatimes.com/markets/stocks/news/top-five-reasons-sensex-fell-below-27500/articleshow/46698449.cms
- ↑ "Sensex slumps 651 points on geopolitical worries". Reuters. 3 September 2013.
- ↑ http://businesstoday.intoday.in/story/stock-market-bse-sensex-nse-nifty-today-march-9-2015/1/216673.html
- ↑ "Re, Sensex sink on fears Food Bill will feed deficit | Business Line". Thehindubusinessline.com. Retrieved 2015-02-18.
- ↑ "Sensex sheds 538 points amid global market sell-off". Livemint. Retrieved 2015-02-18.
- ↑ "Live news, top stories, corporate news, company news, sector news, economy news, results analysis news, ceo interviews, fund manager interview, advisor interview, market news, bazaar talk, hot stocks news, ipo news, commodities news, mutual fund news, insurance news, news wire". Myiris.com. Archived from the original on 18 February 2015. Retrieved 2015-02-18.
- ↑ "BSE Sensex plummets 518 pts, marks biggest single-day fall in over 10 months". The Indian Express. Retrieved 2015-02-18.
- ↑ http://www.rediff.com/business/report/how-the-markets-fared-on-jan-30/20150130.htm
- ↑ http://businesstoday.intoday.in/story/stock-market-bse-sensex-nse-nifty-february-9-2015/1/215511.html
- ↑ "Sensex plunges 450 points, Nifty slips way below 5,600". The Times Of India. 6 August 2013.
- ↑ "Just 6 stocks caused half of Sensex's 430-point fall - Money - DNA". Dnaindia.com. Retrieved 3 September 2013.
| Companies |
|
|---|---|
| Governance |
|
| Currency | |
| Financial services |
|
| History | |
| People |
|
| States | |
| Sectors | |
| |