List of busiest container ports
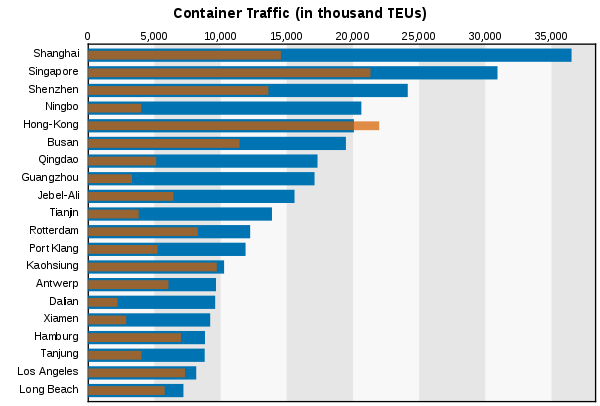
This is a list of the world's busiest container ports (ports with container terminals that specialize in handling goods transported in shipping containers) by total number of actual twenty-foot equivalent units (TEUs) transported through the port. Data listed in millions of TEU.
| # | Port | Country | Region | Location | 2017 | 2016[1] | 2015[2] | 2014[2] | 2013[3] | 2012[4] | 2011[5] | 2010[6] | 2009[7] | 2008[8] | 2007[9] | 2006[10] | 2005[11] | 2004[12] |
|---|---|---|---|---|---|---|---|---|---|---|---|---|---|---|---|---|---|---|
| 1 | Shanghai | East Asia | Yangtze Delta | 40,230 | 37,133 | 36,537[13] | 35,268 | 33,617 | 32,529 | 31,700 | 29,069 | 25,002 | 27,980 | 26,150 | 21,710 | 18,084 | 14,557 | |
| 2 | Singapore | Southeast Asia | Malacca Strait | 33,670 | 30,904[14] | 30,922[14] | 33,869 | 32,240 | 31,649 | 29,937 | 28,431 | 25,866 | 29,918 | 27,932 | 24,792 | 23,192 | 21,329 | |
| 3 | Shenzhen | East Asia | Pearl River Delta | 25,210 | 23,979[15] | 24,204[15] | 23,798 | 23,280 | 22,940 | 22,570 | 22,510 | 18,250 | 21,414 | 21,099 | 18,469 | 16,197 | 13,615 | |
| 4 | Ningbo-Zhoushan | East Asia | Yangtze Delta | 24,610 | 21,560[16] | 20,620[16] | 19,450 | 17,351 | 16,670 | 14,686 | 13,144 | 10,502 | 11,226 | 9,349 | 7,068 | 5,208 | 4,006 | |
| 5 | Busan | East Asia | Korean Strait | 21,400 | 19,850[17] | 19,469[17] | 18,423 | 17,690 | 17,046 | 16,185 | 14,157 | 11,954 | 13,425 | 13,270 | 12,039 | 11,843 | 11,430 | |
| 6 | Hong Kong | East Asia | Pearl River Delta | 20,760 | 19,813[18] | 20,073[18] | 22,374 | 22,352 | 23,117 | 24,384 | 23,532 | 20,983 | 24,248 | 23,881 | 23,539 | 22,427 | 21,984 | |
| 7 | Guangzhou | East Asia | Pearl River Delta | 20,370 | 18,858[19] | 17,625 | 16,160 | 15,309 | 14,744 | 14,400 | 12,550 | 11,190 | 11,001 | 9,200 | 6,600 | 4,685 | 3,308 | |
| 8 | Qingdao | East Asia | Yellow Sea | 18,260 | 18,010[20] | 17,510 | 16,624 | 15,520 | 14,503 | 13,020 | 12,012 | 10,260 | 10,320 | 9,462 | 7,702 | 6,307 | 5,140 | |
| 9 | Dubai | Western Asia | Arab Peninsula | 15,440 | 14,772[21] | 15,592 | 14,750 | 13,641 | 13,270 | 13,000 | 11,600 | 11,124 | 11,827 | 10,653 | 8,923 | 7,619 | 6,429 | |
| 10 | Tianjin | East Asia | Yellow Sea | 15,210 | 14,490[22] | 14,090 | 14,050 | 13,010 | 12,300 | 11,500 | 10,080 | 8,700 | 8,500 | 7,103 | 5,950 | 4,801 | 3,814 | |
| 11 | Rotterdam | Northern Europe | North sea | 13,600 | 12,385[23] | 12,235 | 12,453 | 11,621 | 11,866 | 11,877 | 11,146 | 9,743 | 10,784 | 10,791 | 9,655 | 9,287 | 8,281 | |
| 12 | Port Klang | Southeast Asia | Malacca Strait | 12,060 | 13,170[24] | 11,887 | 10,736 | 10,350 | 10,000 | 9,604 | 8,870 | 7,309 | 7,970 | 7,120 | 6,326 | 5,544 | 5,244 | |
| 13 | Antwerp | Northern Europe | North sea | 10,450 | 10,037[25] | 9,654 | 9,136 | 8,578 | 8,635 | 8,664 | 8,468 | 7,309 | 8,663 | 8,176 | 7,019 | 6,482 | 6,064 | |
| 14 | Xiamen | East Asia | Taiwan strait | 10,380 | 9,614[26] | 9,183 | 8,572 | 8,010 | 7,202 | 6,461 | 5,820 | 4,680 | 5,035 | 4,627 | 4,019 | 3,342 | 2,872 | |
| 15 | Kaohsiung | East Asia | Taiwan | 10,240 | 10,465[27] | 10,264 | 10,593 | 9,938 | 9,781 | 9,636 | 8,872 | 8,581 | 9,677 | 10,257 | 9,775 | 9,471 | 9,714 | |
| 16 | Dalian | East Asia | Yellow Sea | 9,710 | 9,614[28] | 9,450 | 10,128 | 10,860 | 8,060 | 6,400 | 5,242 | 4,552 | 4,503 | 4,574 | 3,212 | 2,665 | 2,211 | |
| 17 | Los Angeles | North America | West Coast | 9,340 | 8,857[29] | 8,160 | 8,340 | 7,869 | 8,078 | 7,941 | 7,832 | 6,748 | 7,850 | 8,355 | 8,470 | 7,485 | 7,321 | |
| 18 | Hamburg | Northern Europe | North sea | 9,000 | 8,910[30] | 8,821 | 9,729 | 9,302 | 8,864 | 9,022 | 7,900 | 7,007 | 9,737 | 9,890 | 8,862 | 8,088 | 7,003 | |
| 19 | Tanjung Pelepas | Southeast Asia | Malacca Strait | 8,330 | 8,281[31] | 9,120 | 8,500[2] | 7,628 | 7,700 | 7,500 | 6,530 | 6,000 | 5,600 | 5,500 | 4,770 | 4,177 | 4,020 | |
| 20 | Laem Chabang | Southeast Asia | Gulf of Thailand | 7,760 | 7,227[32] | 6,780 | 6,518 | 6,032 | 5,830 | 5,731 | 5,068 | 4,538 | 5,134 | 4,642 | 4,123 | 3,834 | 3,529 | |
| 21 | Long Beach | North America | West Coast | 7,545[33] | 6,775[34] | 7,192 | 6,821 | 6,731 | 6,046 | 6,061 | 6,263 | 5,067 | 6,350 | 7,316 | 7,289 | 6,710 | 5,780 | |
| 22 | New York | North America | East Coast | 6,711[35] | 6,252[36] | 6,372 | 5,772 | 5,467 | 5,530 | 5,503 | 5,292 | 4,561 | 5,265 | 5,299 | 5,093 | 4,785 | 4,478 | |
| 23 | Yingkou | East Asia | Liaodong Bay | 6,086[37] | 5,922 | |||||||||||||
| 24 | Saigon | Southeast Asia | Ho Chi Minh City | 5,987[38] | 5,788[2][38] | 6,334 | 5,542 | 5,060 | 4,674 | 4,100 | 3,563 | 3,100 | 2,532 | 2,532 | 2,122 | 1,868 | ||
| 25 | Colombo | South Asia | Colombo | 6,200 | 5,735[39] | 5,185[2][39] | ||||||||||||
| 26 | Bremerhaven | Northern Europe | North sea | 5,535 [40] | 5,479[40] | 5,796 | 5,831 | 6,115 | 5,915 | 4,871 | 4,578 | 5,529 | 4,912 | 4,450 | 3,736 | 3,469 | ||
| 27 | Tanjung Priok | Southeast Asia | Java Sea | 5,515[41] | 5,201[41] | 5,034 | 6,590 | 6,200 | 5,618 | 4,715 | 3,800 | 3,984 | 3,900 | 3,280 | 3,282 | 3,170 | ||
| 28 | Algeciras | Southern Europe | Western Mediterranean | 4,761[42] | 4,516[42] | 4,457 | 4,501 | 4,114 | 3,603 | 2,810 | 3,042 | 3,324 | 3,152 | 3,257 | 3,180 | 2,937 | ||
| 29 | Valencia | Southern Europe | Western Mediterranean | 4,722 | 4,616 | 4,442 | 4,328 | 4,470 | 4,327 | 4,207 | 3,653 | 3,593 | 3,043 | 2,612 | 2,410 | 2,145 | ||
| 30 | Lianyungang | East Asia | Yellow Sea | 4,703 | 4,703 | |||||||||||||
| 31 | Tokyo | East Asia | Tokyo Bay | 4,700 | 4,629 | 4,917 | 4,861 | 4,752 | 4,640 | 4,286 | 3,810 | 4,271 | 3,818 | 3,969 | 3,593 | 3,358 | ||
| 32 | Manila | Southeast Asia | Manila Bay | 4,523 | 3,976 | 3,673 | 3,770 | 3,705 | 3,250 | 3,257 | 2,815 | 2,977 | 2,800 | 2,638 | 2,625 | 2,698 | ||
| 33 | Mumbai | South Asia | Arabian Sea | 4,830 | 4,432 | |||||||||||||
| 34 | Mundra | South Asia | Gulf of Kutch | 4,240[43] | 3,320 | 2,895 | ||||||||||||
| 35 | Taicang | East Asia | Yangtze Delta | 4,081 | 3,760 | |||||||||||||
| 36 | Felixstowe | Northern Europe | North Sea | 4,000 | 3,980 | 3,680 | 3,740 | 3,700 | 3,519 | 3,400 | 3,100 | 3,200 | 3,300 | 3,000 | 2,700 | 2,717 | ||
| 37 | Jeddah | Western Asia | Arab Peninsula | 3,957 | 4,188[44] | 4,200 | 4,561 | 4,738 | 4,010 | 3,830 | 3,091 | 3,326 | 3,068 | 2,964 | 2,836 | 2,426 | ||
| 38 | Piraeus | Southern Europe | Eastern Mediterranean | 3,737 | 3,330 | 3,164 | 2,745 | 1,680 | 1,198 | 665 | 434 | 1,373 | N/A | N/A | N/A | |||
| 39 | Savannah | North America | East Coast | 4,046[45] | 3,645 | 3,737 | 3,346 | 3,034 | 2,966 | 2,945 | 2,825 | 2,356 | 2,616 | 2,604 | 2,160 | 1,902 | 1,662 | |
| 40 | Khor Fakkan | Western Asia | Arab Peninsula | 3,800[46] | 4,330 | 4,142 | 4,256 | 3,800 | 3,996 | 3,230 | 3,023 | 2,750 | 2,112 | 1,850 | 1,730 | 1,929 | 1,819 | |
| 41 | Dongguan | East Asia | Pearl River Delta | 3,640 | 3,363 | |||||||||||||
| 42 | Seattle/Tacoma | North America | West Coast | 3,665[47] | 3,616 | 3,154 | 3,456 | 3,461 | 3,510 | 3,590 | ||||||||
| 43 | Santos | South America | South Atlantic Ocean | 3,394 | 3,645 | 3,685 | 3,446 | 3,172 | 2,985 | 2,716 | 2,252 | 2,675 | 2,533 | 2,208 | 2,240 | 1,883 | ||
| 44 | Tanjung Perak | Southeast Asia | Madura Strait | 3,355 | 3,154 | |||||||||||||
| 45 | Salalah | Western Asia | Arabian Sea | 3,325 | 2,569 | |||||||||||||
| 46 | Colón | Central America | Caribbean coast | 3,258 | 3,577 | 3,356 | 2,060 | 1,900 | 1,600 | 2,802 | 1,856[48] | 2,262 | N/A | 1,947 | 2,150 | |||
| 47 | Marsaxlokk | Southern Europe | Eastern Mediterranean | 3,084 | 3,064 | |||||||||||||
| 48 | Nanjing | East Asia | Yangtze Delta | 3,084 | 2,940 | |||||||||||||
| 49 | Port Said | North Africa | North of Suez Canal | 3,036 | 3,462 | 3,036 | 4,100 | 3,631 | 4,272 | 3,646 | 3,300 | 3,202 | 2,127 | 2,127 | 1,522 | 869 | ||
| 50 | Rizhao | East Asia | Yellow Sea | 3,010[49] | 2,810[49] | |||||||||||||
List of busiest container ports
Level in 2015
Level in 2004
See also
References
- ↑ "Lloyd's List Top 100 Ports | Maritime Intelligence". Retrieved 2018-05-16.
- 1 2 3 4 5 "Top 50 World Container Ports | World Shipping Council". www.worldshipping.org. Retrieved 2017-12-27.
- ↑ The Lloyd's List of the World's Busiest Container Ports 2013 Archived 2015-03-28 at the Wayback Machine.
- ↑ The Lloyd's List of the World's Busiest Container Ports 2012 Archived 2015-03-28 at the Wayback Machine.
- ↑ The Lloyd's List of the World's Busiest Container Ports 2011 Archived 2015-03-28 at the Wayback Machine.
- ↑ The Lloyd's List of the World's Busiest Container Ports 2010 Archived 2015-02-17 at the Wayback Machine.
- ↑ AAPA World Port Rankings 2009
- ↑ AAPA World Port Rankings 2008
- ↑ Port of Hamburg
- ↑ AAPA World Port Rankings 2006 Archived December 21, 2008, at the Wayback Machine.
- ↑ AAPA World Port Rankings 2005 Archived September 27, 2007, at the Wayback Machine.
- ↑ AAPA World Port Rankings 2004 Archived 2011-07-24 at the Wayback Machine.
- ↑ "01 Shanghai (China)". Lloyd's List. 2017-08-02. Retrieved 2017-12-27.
- 1 2 "02 Singapore (Singapore)". Lloyd's List. 2017-08-02.
- 1 2 "03 Shenzhen (China)". Lloyd's List. 2017-08-02. Retrieved 2017-12-27.
- 1 2 "04 Ningbo-Zhoushan (China)". Lloyd's List. 2017-08-02. Retrieved 2017-12-27.
- 1 2 "05 Busan (South Korea)". Lloyd's List. 2017-08-02. Retrieved 2017-12-27.
- 1 2 "06 Hong Kong (China)". Lloyd's List. 2017-08-02. Retrieved 2017-12-27.
- ↑ "07 Guangzhou (China)". Lloyd's List. 2017-08-02. Retrieved 2017-12-27.
- ↑ "08 Qingdao (China)". Lloyd's List. 2017-08-02. Retrieved 2017-12-27.
- ↑ "09 Dubai (United Arab Emirates)". Lloyd's List. 2017-08-02. Retrieved 2017-12-27.
- ↑ "10 Tianjin (China)". Lloyd's List. 2017-08-02. Retrieved 2017-12-27.
- ↑ "12 Rotterdam (The Netherlands)". Lloyd's List. 2017-08-02. Retrieved 2017-12-27.
- ↑ "11 Port Klang (Malaysia)". Lloyd's List. 2017-08-02.
- ↑ "14 Antwerp (Belgium)". Lloyd's List. 2017-08-02. Retrieved 2017-12-27.
- ↑ "16 Xiamen (China)". Lloyd's List. 2017-08-02. Retrieved 2017-12-27.
- ↑ "13 Kaohsiung (Taiwan)". Lloyd's List. 2017-08-02. Retrieved 2017-12-27.
- ↑ "15 Dalian (China)". Lloyd's List. 2017-08-02. Retrieved 2017-12-27.
- ↑ "18 Los Angeles (US)". Lloyd's List. 2017-08-02. Retrieved 2017-12-27.
- ↑ "17 Hamburg (Germany)". Lloyd's List. 2017-08-02. Retrieved 2017-12-27.
- ↑ "19 Tanjung Pelepas (Malaysia)". Lloyd's List. 2017-08-02. Retrieved 2017-12-27.
- ↑ "20 Laem Chabang (Thailand)". Lloyd's List. 2017-08-02. Retrieved 2017-12-27.
- ↑ "Port of Long Beach - Yearly TEUs". Port of Long Beach. Retrieved 2018-04-19.
- ↑ "21 Long Beach (US)". Lloyd's List. 2017-08-02. Retrieved 2017-12-27.
- ↑ "Port of New York and New Jersey - Loaded Containers in TEUs by Month". Retrieved 2018-04-19.
- ↑ "22 New York/New Jersey (US)". Lloyd's List. 2017-08-02. Retrieved 2017-12-27.
- ↑ "23 Yingkou (China)". Lloyd's List. 2017-08-02. Retrieved 2017-12-27.
- 1 2 "24 Ho Chi Minh City (Vietnam)". Lloyd's List. 2017-08-02. Retrieved 2017-12-27.
- 1 2 "25 Colombo (Sri Lanka)". Lloyd's List. 2017-08-02. Retrieved 2017-12-27.
- 1 2 "26 Bremen/Bremerhaven (Germany)". Lloyd's List. 2017-08-02. Retrieved 2017-12-27.
- 1 2 "27 Tanjung Priok (Indonesia)". Lloyd's List. 2017-08-02. Retrieved 2017-12-27.
- 1 2 "28 Algeciras (Spain)". Lloyd's List. 2017-08-02. Retrieved 2017-12-27.
- ↑ "Mundra port crosses 4 million TEUs mark for the first time". Adani Group. Retrieved 24 May 2017.
- ↑ "37 Jeddah (Saudi Arabia)". Lloyd's List. 2017-08-02. Retrieved 2017-12-27.
- ↑ "GA Ports By The Numbers". Georgia Ports. 2018-04-12. p. "Monthly TEU Throughput" link. Retrieved 2018-04-19.
- ↑ "Middle East port's appetite capacity expansion won't satisfy volumes". The Loadstar. Retrieved 6 April 2018.
- ↑ "NWSA international container volumes grew 4 percent in 2017". Northwest Seaport Alliance. 2018-01-18. p. Container Volumes - December 2017.
- ↑ PORTS OF CENTRAL AND SOUTH AMERICA, CONTAINER TRAFFIC 2009 - 2008
- 1 2 "50 Rizhao (China)". Lloyd's List. 2017-08-01.
| Types |
|
|---|---|
| Individual sites |
|
| Rankings | |
| Port management |
|
| Conventions | |
| Organizations |
|
| |
This article is issued from
Wikipedia.
The text is licensed under Creative Commons - Attribution - Sharealike.
Additional terms may apply for the media files.