Pacific typhoon climatology
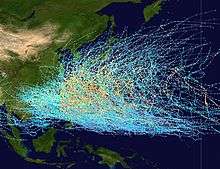
Tracks of all tropical cyclones in the northernwestern Pacific Ocean between 1980 and 2005. The vertical line to the right is the International Date Line.
The following is a list of Pacific typhoon seasons. The seasons are limited to the north of the equator between the 100th meridian east and the 180th meridian.
| Period | Seasons |
|---|---|
| Pre 1940 | List of Pacific typhoons before 1900, 1900, 1901, 1927, 1939 |
| 1940s | 1940, 1941–44, 1945, 1946, 1947, 1948, 1949 |
| 1950s | 1950, 1951, 1952, 1953, 1954, 1955, 1956, 1957, 1958, 1959 |
| 1960s | 1960, 1961, 1962, 1963, 1964, 1965, 1966, 1967, 1968, 1969 |
| 1970s | 1970, 1971, 1972, 1973, 1974, 1975, 1976, 1977, 1978, 1979 |
| 1980s | 1980, 1981, 1982, 1983, 1984, 1985, 1986, 1987, 1988, 1989 |
| 1990s | 1990, 1991, 1992, 1993, 1994, 1995, 1996, 1997, 1998, 1999 |
| 2000s | 2000, 2001, 2002, 2003, 2004, 2005, 2006, 2007, 2008, 2009 |
| 2010s | 2010, 2011, 2012, 2013, 2014, 2015, 2016, 2017, 2018 |
Pre 1940
| Year | TD | TS | TY | STY | Strongest storm | Deaths | Damages (USD) | Notes | |
|---|---|---|---|---|---|---|---|---|---|
| 1900 | -- | 23 | -- | -- | Guam typhoon | >1,965 | Unknown | ||
| 1901 | -- | 21 | -- | -- | De Witte typhoon | >4 | Unknown | ||
| 1927 | 27 | 25 | 19 | -- | Eleven | 15,159 | $4 million | ||
| 1939 | 28 | 24 | 22 | -- | Twenty-Six | 1,185 | $106.15 million | ||
| References[1] | |||||||||
1940s
| Year | TD | TS | TY | STY | Strongest storm | Deaths | Damages (USD) | Notes | |
|---|---|---|---|---|---|---|---|---|---|
| 1940 | 43 | -- | 27 | -- | July typhoon | 183 | Unknown | ||
| 1945 | -- | 26 | 13 | -- | Helen | 3,798+ | Unknown | ||
| 1946 | -- | 15 | 10 | -- | Lilly | Unknown | Unknown | ||
| 1947 | -- | 27 | 19 | 1 | Rosalind | Unknown | Unknown | ||
| 1948 | -- | 26 | 15 | 1 | Karen | Unknown | Unknown | ||
| 1949 | 33 | 22 | 14 | 1 | Patricia | At least 1,790 | $127 million | ||
| References[1] | |||||||||
1950s
| Year | TD | TS | TY | STY | Strongest storm | Deaths | Damages (USD) | Notes | |
|---|---|---|---|---|---|---|---|---|---|
| 1950 | -- | 18 | 12 | 1 | Doris | 544 | Unknown | ||
| 1951 | 31 | 25 | 16 | 1 | Marge | 1,185 | $106.15 million | ||
| 1952 | -- | 29 | 20 | 6 | Wilma | 1,070 | Unknown | ||
| 1953 | -- | 24 | 17 | 5 | Nina | 430 | Unknown | ||
| 1954 | 33 | 19 | 15 | 5 | Ida | 1,530 | Unknown | ||
| 1955 | 39 | 31 | 20 | 4 | Clara | Unknown | Unknown | ||
| 1956 | 39 | 26 | 18 | 5 | Wanda | >5,980 | $60.5 million | ||
| 1957 | 27 | 22 | 18 | 8 | Lola | 644 | Unknown | ||
| 1958 | 24 | 23 | 21 | 9 | Ida | Unknown | Unknown | ||
| 1959 | 33 | 25 | 18 | 8 | Joan | >8,557 | $755 million | ||
| >19,396 | $921.65 million | ||||||||
| References[1] | |||||||||
1960s
| Year | TD | TS | TY | STY | Strongest storm | Deaths | Damages (USD) | Notes | |
|---|---|---|---|---|---|---|---|---|---|
| 1960 | 39 | 30 | 19 | 2 | Shirley | >2,869 | $69 million | ||
| 1961 | 53 | 35 | 20 | 8 | Nancy | 308 | Unknown | ||
| 1962 | 38 | 30 | 23 | 6 | Emma | 1,700 | $325 million | ||
| 1963 | 36 | 25 | 19 | 8 | Judy | Unknown | Unknown | ||
| 1964 | 58 | 40 | 26 | 7 | Sally and Opal | >8,743 | Unknown | Most active tropical cyclone season recorded globally | |
| 1965 | 44 | 35 | 21 | 11 | Bess | Unknown | Unknown | ||
| 1966 | 51 | 30 | 20 | 3 | Kit | 1,146 | $377.6 million | ||
| 1967 | 40 | 35 | 20 | 5 | Carla | Unknown | Unknown | ||
| 1968 | 39 | 29 | 20 | 4 | Agnes | Unknown | Unknown | ||
| 1969 | 34 | 23 | 13 | 2 | Elsie | Unknown | Unknown | ||
| >14,766 | $771.6 million | ||||||||
| References[1] | |||||||||
1970s
| Year | TD | TS | TY | STY | Strongest storm | Deaths | Damages (USD) | Notes | |
|---|---|---|---|---|---|---|---|---|---|
| 1970 | 30 | 24 | 12 | 7 | Hope | 3,909 | Unknown | ||
| 1971 | 55 | 35 | 24 | 6 | Irma | 617 | $57.7 million | ||
| 1972 | 38 | 30 | 22 | 2 | Rita | 860 | $290 million | ||
| 1973 | 25 | 21 | 12 | 3 | Nora | Unknown | Unknown | ||
| 1974 | 35 | 32 | 16 | 0 | Gloria | Unknown | Unknown | ||
| 1975 | 25 | 20 | 14 | 3 | June | >229,160 | >$1.2 billion | Deadliest typhoon season on record | |
| 1976 | 30 | 25 | 14 | 4 | Louise | Unknown | Unknown | ||
| 1977 | 26 | 20 | 11 | 1 | Babe | 143 | Unknown | ||
| 1978 | 34 | 30 | 15 | 1 | Rita | Unknown | Unknown | ||
| 1979 | 55 | 24 | 13 | 4 | Tip | At least 976 | $18.36 billion | ||
| >235,665 | >$19.91 billion | ||||||||
| References[1] | |||||||||
1980s
| Year | TD | TS | TY | STY | Strongest storm | Deaths | Damages (USD) | Notes | |
|---|---|---|---|---|---|---|---|---|---|
| 1980 | 46 | 24 | 15 | 2 | Wynne | >131 | Unknown | ||
| 1981 | 52 | 29 | 13 | 2 | Elsie | >1,268 | >$280.2 million | ||
| 1982 | 29 | 25 | 19 | 2 | Mac | 597 | $2.41 billion | ||
| 1983 | 33 | 23 | 10 | 4 | Forrest | 1,073 | $258.3 million | ||
| 1984 | 44 | 27 | 16 | 2 | Vanessa | 2,919 | $1 billion | ||
| 1985 | 57 | 28 | 15 | 1 | Dot | 1,355 | $243.1 million | ||
| 1986 | 48 | 29 | 19 | 3 | Peggy | >905 | >$508.5 million | ||
| 1987 | 32 | 23 | 17 | 6 | Betty | 1,402 | $1.3 billion | ||
| 1988 | 52 | 31 | 11 | 1 | Nelson | >786 | >$503.9 million | ||
| 1989 | 55 | 32 | 20 | 5 | Gordon and Elsie | 3,328 | $2.24 billion | ||
| >13,822 | $7.52 billion | ||||||||
| References[1] | |||||||||
1990s
| Year | TD | TS | TY | STY | Strongest storm | Deaths | Damages (USD) | Notes | |
|---|---|---|---|---|---|---|---|---|---|
| 1990 | 41 | 29 | 18 | 4 | Flo | 1,606 | $5.26 billion | ||
| 1991 | 38 | 29 | 17 | 5 | Yuri | 5,505 | $10.1 billion | ||
| 1992 | 40 | 31 | 16 | 5 | Gay | 399 | $2.64 billion | ||
| 1993 | 43 | 30 | 15 | 3 | Koryn | 668 | $1.75 billion | ||
| 1994 | 46 | 36 | 19 | 6 | Melissa and Seth | 2,539 | $8.3 billion | ||
| 1995 | 47 | 24 | 8 | 5 | Angela | 1,317 | $1.21 billion | ||
| 1996 | 43 | 31 | 16 | 6 | Herb | 873 | $6.87 billion | ||
| 1997 | 47 | 28 | 16 | 11 | Ivan and Joan | At least 4,181 | $4.59 billion | Most Category 5 storms in a single season on record | |
| 1998 | 30 | 16 | 8 | 3 | Zeb | 924 | $950.8 million | latest start for a Pacific typhoon season and
latest start for the first named system to develop | |
| 1999 | 45 | 20 | 5 | 1 | Bart | At least 976 | $18.36 billion | ||
| ~18,988 | $60.03 billion | ||||||||
| References[1] | |||||||||
2000s
| Year | TD | TS | TY | STY | Strongest storm | Deaths | Damages (USD) | Retired names | Notes |
|---|---|---|---|---|---|---|---|---|---|
| 2000 | 51 | 23 | 13 | 4 | Bilis | 467 | $7.11 billion | None | |
| 2001 | 45 | 26 | 16 | 3 | Faxai | 1,287 | $2.3 billion | Vamei | |
| 2002 | 44 | 26 | 15 | 8 | Fengshen | 725 | $9.54 billion | Chataan, Rusa, Pongsona | |
| 2003 | 45 | 21 | 14 | 5 | Maemi | 360 | $5.73 billion | Yanyan, Imbudo, Maemi | |
| 2004 | 45 | 29 | 19 | 7 | Chaba | 2,402 | $18.1 billion | Sudal, Tingting, Rananim | Third most active season in recorded history |
| 2005 | 33 | 24 | 13 | 3 | Haitang | 436 | $7.64 billion | Matsa, Nabi, Longwang | |
| 2006 | 40 | 23 | 15 | 6 | Yagi | 3,879 | $14.4 billion | Chanchu, Bilis, Saomai, Xangsane, Durian | |
| 2007 | 34 | 24 | 14 | 5 | Sepat | 320 | $7.5 billion | None | |
| 2008 | 40 | 22 | 11 | 3 | Jangmi | 1,936 | $5.97 billion | None | |
| 2009 | 41 | 22 | 13 | 5 | Nida | 2,348 | $9.97 billion | Morakot, Ketsana, Parma | |
| 14,160 | $88.26 billion | ||||||||
| References[1] | |||||||||
2010s
| Year | TD | TS | TY | STY | Strongest storm | Deaths | Damages (USD) | Retired names | Notes |
|---|---|---|---|---|---|---|---|---|---|
| 2010 | 29 | 14 | 7 | 1 | Megi | 384 | $2.96 billion | Fanapi | Quietest Pacific typhoon season on record |
| 2011 | 39 | 21 | 8 | 4 | Songda | 3,111 | $7.18 billion | Washi | |
| 2012 | 35 | 25 | 14 | 4 | Sanba | 2,487 | $20.5 billion | Vicente, Bopha | Second costliest season ever recorded |
| 2013 | 49 | 31 | 13 | 5 | Haiyan | 8,570 | $35 billion | Sonamu, Utor, Fitow, Haiyan | Most active since 2004, deadliest since 1975, costliest season ever |
| 2014 | 32 | 23 | 11 | 8 | Vongfong | 576 | $12.4 billion | Rammasun | Most Category 5 typhoons since 1997 |
| 2015 | 40 | 27 | 18 | 9 | Soudelor | 350 | $12.2 billion | Soudelor, Mujigae, Koppu, Melor | Saw each month having a named storm active since 1963 |
| 2016 | 51 | 26 | 13 | 6 | Meranti | 972 | $13.4 billion | Meranti, Sarika, Haima, Nock-ten | Fifth latest start for a Pacific typhoon season and second latest start for the first named system to develop |
| 2017 | 42 | 27 | 11 | 2 | Lan | 864 | $15.7 billion | Hato, Kai-tak, Tembin | Second latest start for a typhoon to develop since 1998 |
| 2018 | 37 | 26 | 11 | 6 | Mangkhut | 302 | $7.77 billion | TBD | Third earliest start for a tropical storm to develop since 1949 |
| 17,613 | $127.15 billion | ||||||||
| References[1] | |||||||||
See also
Parent topics
Other tropical cyclone basins
References
- 1 2 3 4 5 6 7 8 9 Unattributed (2010-08-31). "Annual frequency of cyclonic disturbances (Maximum sustained windspeeds of 17 knots or more), Cyclones (34 knots or more) and Severe Cyclones (48 knots or more) over the Bay of Bengal (BOB), Arabian Sea (AS) and land surface of India" (PDF). India Meteorological Department. Archived from the original (PDF) on 2011-08-05. Retrieved 2011-08-20.
This article is issued from
Wikipedia.
The text is licensed under Creative Commons - Attribution - Sharealike.
Additional terms may apply for the media files.