Outremont (electoral district)
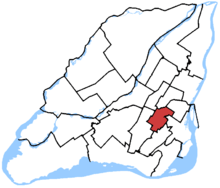 Outremont in relation to other federal electoral districts in Montreal and Laval (2013 boundaries) | |||
| Federal electoral district | |||
| Legislature | House of Commons | ||
| MP |
| ||
| District created | 1933 | ||
| First contested | 1935 | ||
| Last contested | 2015 | ||
| District webpage | profile, map | ||
| Demographics | |||
| Population (2016)[1] | 102,088 | ||
| Electors (2015) | 71,300 | ||
| Area (km²)[2] | 11.95 | ||
| Pop. density (per km²) | 8,542.9 | ||
| Census divisions | Montreal | ||
| Census subdivisions | Montreal | ||
Outremont is a federal electoral district in Montreal, Quebec, Canada, that has been represented in the House of Commons of Canada since 1935. It was known as Outremont—Saint-Jean from 1947 to 1966. Its population in 2006 was 95,711. Its previous Member of Parliament was Tom Mulcair, former leader of the New Democratic Party.
Demographics
- According to the Canada 2011 Census[3]
Ethnic groups: 69.5% White, 6.9% Black, 6.7% Arab, 3.8% Latino, 2.8% Filipino, 2.4% South Asian, 2.1% Southeast Asian, 2.0% Chinese, 1.7% Indigenous, 2.1% Other
Languages: 47.9% French, 16.5% English, 5.4% Arabic, 4.8% Yiddish, 4.6% Spanish, 1.9% Portuguese, 1.8% Greek, 1.5% Romanian, 1.4% Tagalog, 1.3% Russian, 12.9% Other
Religions: 50.7% Christian, 11.0% Jewish, 9.5% Muslim, 1.3% Buddhist, 1.2% Hindu, 0.3% Other, 26.0% None
Median income: $22,551 (2010)
Average income: $39,486 (2010)
- According to the Canada 2016 Census
- Languages: (2016) 54.9% French, 23.5% English, 4.9% Yiddish, 2.7% Spanish, 2.4% Arabic, 1.5% Farsi, 1.1% Portuguese, 0.9% Greek, 0.9% Romanian, 0.8% Tagalog, 0.8% Russian, 0.8% Mandarin, 0.6% Vietnamese[4]
Geography
The district includes the Borough of Outremont, the eastern part of Côte-des-Neiges in the Borough of Côte-des-Neiges—Notre-Dame-de-Grâce, and the western part of the Mile End in Borough of Le Plateau-Mont-Royal, plus bits of upper Downtown Montreal in the borough of Ville-Marie, La Petite-Patrie in the borough of Rosemont–La Petite-Patrie, and Parc Extension in the borough of Villeray–Saint-Michel–Parc-Extension.
Political geography
In the 2006 election, the Liberals had their strongest support in Côte-des-Neiges, on the eastern slopes of Mont-Royal and in the small part of the riding in the Parc-Extension neighbourhood. The Bloc had its support concentrated in the borough of Outremont, and around the Université de Montréal. The New Democratic Party (NDP) won all of its polls in Mile-End where it obtained most of its polls. The Conservatives won just three polls in the riding all of which were around the western border of the Outremont border.
In the 2007 by-election, the NDP almost swept the riding. Their strongest areas were in Mile-End, Jeanne-Mance, and around the Université de Montréal. It was not uncommon for the NDP win more than 70% of the vote in these polls. The Bloc Québécois vote had collapsed, most of which went to the NDP. They did not win a single poll. Liberal support was relegated to the small part of Parc-Extension in the riding, the area around Rue Jean-Talon and the area on the opposite side of Mount Royal along Avenue des Pins. The Conservatives held on to one of their three polls.
In the 2008 election, the NDP held on to Outremont, albeit with a lower percentage of overall support.
Until the 2011 election, this riding was the only riding in Quebec to be held by the NDP. Mulcair has held it since winning a by-election in 2007, winning a seat for the party for only the second time in history. He was challenged in 2011 by Liberal Martin Cauchon, who held this riding from 1993 to 2004 and was a cabinet minister.
History
The electoral district was created in 1933 from parts of Laurier—Outremont and Mount Royal ridings.
This riding lost territory to Papineau, Notre-Dame-de-Grâce—Westmount, Laurier—Sainte-Marie, Ville-Marie—Le Sud-Ouest—Île-des-Sœurs and Rosemont—La Petite-Patrie, and gained territory from Laurier—Sainte-Marie, Westmount—Ville-Marie and Mount Royal during the 2012 electoral redistribution.
2007 by-election
After the resignation of Jean Lapierre on 28 January 2007, a by-election was called for 17 September 2007. In the by-election, this riding was won by the NDP candidate Thomas Mulcair.
Mulcair retained the riding for the NDP in the 2008 federal election, marking the NDP's first re-election and first general election victory in Quebec.
Former boundaries
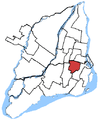 2004 to 2011 election
Members of Parliament
This riding has elected the following Members of Parliament:
| Parliament | Years | Member | Party | |
|---|---|---|---|---|
| Outremont Riding created from Laurier—Outremont and Mount Royal |
||||
| 18th | 1935–1940 | Thomas Vien | Liberal | |
| 19th | 1940–1942 | |||
| 1942–1945 | Léo Richer Laflèche | |||
| 20th | 1945–1949 | Édouard Rinfret | ||
| Outremont—Saint-Jean | ||||
| 21st | 1949–1952 | Édouard Rinfret | Liberal | |
| 1952–1953 | Romuald Bourque | |||
| 22nd | 1953–1957 | |||
| 23rd | 1957–1958 | |||
| 24th | 1958–1962 | |||
| 25th | 1962–1963 | |||
| 26th | 1963–1965 | Maurice Lamontagne | ||
| 27th | 1965–1967 | |||
| 1967–1968 | Aurélien Noël | |||
| Outremont | ||||
| 28th | 1968–1972 | Aurélien Noël | Liberal | |
| 29th | 1972–1974 | Marc Lalonde | ||
| 30th | 1974–1979 | |||
| 31st | 1979–1980 | |||
| 32nd | 1980–1984 | |||
| 33rd | 1984–1988 | Lucie Pépin | ||
| 34th | 1988–1993 | Jean-Pierre Hogue | Progressive Conservative | |
| 35th | 1993–1997 | Martin Cauchon | Liberal | |
| 36th | 1997–2000 | |||
| 37th | 2000–2004 | |||
| 38th | 2004–2006 | Jean Lapierre | ||
| 39th | 2006–2007 | |||
| 2007–2008 | Tom Mulcair | New Democratic | ||
| 40th | 2008–2011 | |||
| 41st | 2011–2015 | |||
| 42nd | 2015–2018 | |||
Election results
Outremont, 1968–present
| Canadian federal election, 2015 | ||||||||
|---|---|---|---|---|---|---|---|---|
| Party | Candidate | Votes | % | ±% | Expenditures | |||
| New Democratic | Tom Mulcair | 19,242 | 44.11 | −11.57 | $101,332.88 | |||
| Liberal | Rachel Bendayan | 14,597 | 33.46 | +11.84 | $101,506.39 | |||
| Conservative | Rodolphe Husny | 4,159 | 9.53 | +1.55 | $7,828.89 | |||
| Bloc Québécois | Roger Galland Barou | 3,668 | 8.41 | −3.20 | $6,959.30 | |||
| Green | Amara Diallo | 1,575 | 3.61 | +1.37 | – | |||
| Libertarian | Francis Pouliot | 216 | 0.50 | – | – | |||
| Communist | Adrien Welsh | 162 | 0.37 | – | – | |||
| Total valid votes/Expense limit | 43,619 | 100.00 | – | $204,392.07 | ||||
| Total rejected ballots | 426 | 0.97 | – | – | ||||
| Turnout | 44,045 | 62.42 | – | – | ||||
| Eligible voters | 70,559 | – | – | – | ||||
| Source: Elections Canada[5][6] | ||||||||
| 2011 federal election redistributed results[7] | |||
|---|---|---|---|
| Party | Vote | % | |
| New Democratic | 23,317 | 55.68 | |
| Liberal | 9,055 | 21.62 | |
| Bloc Québécois | 4,860 | 11.61 | |
| Conservative | 3,343 | 7.98 | |
| Green | 937 | 2.24 | |
| Others | 362 | 0.86 | |
| Canadian federal election, 2011 | ||||||||
|---|---|---|---|---|---|---|---|---|
| Party | Candidate | Votes | % | ±% | Expenditures | |||
| New Democratic | Tom Mulcair | 21,906 | 56.37 | +16.84 | $80,457 | |||
| Liberal | Martin Cauchon | 9,204 | 23.69 | −9.39 | $51,130 | |||
| Conservative | Rodolphe Husny | 3,408 | 8.77 | −1.76 | $18,319 | |||
| Bloc Québécois | Élise Daoust | 3,199 | 8.23 | −4.32 | $10,456 | |||
| Green | François Pilon | 838 | 2.16 | −2.15 | $4,578 | |||
| Rhinoceros | Tommy Gaudet | 160 | 0.41 | – | ||||
| Communist | Johan Boyden | 143 | 0.37 | – | ||||
| Total valid votes | 38,858 | 100.00 | ||||||
| Total rejected ballots | 291 | 0.74 | +0.05 | |||||
| Turnout | 39,149 | 60.46 | +4.35 | |||||
| Electors on the lists | 65,573 | |||||||
| Source: Official Voting Results, 41st General Election 2011, Elections Canada | ||||||||
| Canadian federal election, 2008 | ||||||||
|---|---|---|---|---|---|---|---|---|
| Party | Candidate | Votes | % | ±% | Expenditures | |||
| New Democratic | Tom Mulcair | 14,348 | 39.53 | −7.97 | $69,072 | |||
| Liberal | Sébastien Dhavernas | 12,005 | 33.08 | +4.12 | $45,118 | |||
| Bloc Québécois | Marcela Valdivia | 4,554 | 12.55 | +1.62 | $48,279 | |||
| Conservative | Lulzim Laloshi | 3,820 | 10.53 | +1.96 | $25,770 | |||
| Green | François Pilon | 1,566 | 4.31 | +2.10 | not listed | |||
| Total valid votes | 36,293 | 100.00 | ||||||
| Total rejected ballots | 253 | 0.69 | ||||||
| Turnout | 36,546 | 56.11 | +18.68 | |||||
| Electors on the lists | 64,556 | |||||||
| New Democratic hold | Swing | −6.05 | ||||||
| Source: Official Voting Results, 40th General Election 2008, Elections Canada. Percentage change totals are in relation to a 2007 by-election, not to the previous general election. | ||||||||
| Canadian federal by-election, September 17, 2007 Resignation of Jean Lapierre | ||||||||
|---|---|---|---|---|---|---|---|---|
| Party | Candidate | Votes | % | ±% | Expenditures | |||
| New Democratic | Thomas Mulcair | 11,374 | 47.50 | +30.03 | $76,194 | |||
| Liberal | Jocelyn Coulon | 6,933 | 28.96 | −6.22 | $72,539 | |||
| Bloc Québécois | Jean-Paul Gilson | 2,618 | 10.93 | −18.08 | $57,717 | |||
| Conservative | Gilles Duguay | 2,052 | 8.57 | −4.16 | $66,401 | |||
| Green | François Pilon | 529 | 2.21 | −2.61 | $169 | |||
| neorhino.ca | François Yo Gourd | 145 | 0.61 | – | $1,774 | |||
| Independent | Mahmood Raza Baig | 78 | 0.33 | – | $45 | |||
| Independent | Jocelyne Leduc | 61 | 0.25 | – | $6 | |||
| Independent | Romain Angeles | 46 | 0.19 | – | $157 | |||
| Canadian Action | Alexandre Amirizian | 45 | 0.19 | – | $0 | |||
| Independent | Régent Millette | 32 | 0.13 | +0.08 | none listed | |||
| Independent | John Turmel | 30 | 0.13 | – | none listed | |||
| Total valid votes | 23,943 | 100.00 | ||||||
| Total rejected ballots | 175 | 0.73 | +0.03 | |||||
| Turnout | 24,118 | 37.43 | −23.35 | |||||
| Electors on the lists | 64,438 | |||||||
| New Democratic gain from Liberal | Swing | −18.3 | ||||||
| Canadian federal election, 2006 | ||||||||
|---|---|---|---|---|---|---|---|---|
| Party | Candidate | Votes | % | ±% | Expenditures | |||
| Liberal | Jean Lapierre | 14,282 | 35.18 | −5.76 | $69,816 | |||
| Bloc Québécois | Jacques Léonard | 11,778 | 29.01 | −4.24 | $63,590 | |||
| New Democratic | Léo-Paul Lauzon | 6,984 | 17.20 | +3.14 | $26,625 | |||
| Conservative | Daniel Fournier | 5,168 | 12.73 | +6.76 | $73,991 | |||
| Green | François Pilon | 1,957 | 4.82 | +0.53 | $425 | |||
| Independent | Eric Roach Denis | 101 | 0.25 | $431 | ||||
| Progressive Canadian | Philip Paynter | 94 | 0.23 | none listed | ||||
| Marxist–Leninist | Linda Sullivan | 88 | 0.22 | −0.09 | none listed | |||
| Independent | Yan Lacombe | 85 | 0.21 | none listed | ||||
| Independent | Xavier Rochon | 34 | 0.08 | $572 | ||||
| Independent | Régent Millette | 22 | 0.05 | none listed | ||||
| Total valid votes | 40,593 | 100.00 | ||||||
| Total rejected ballots | 282 | 0.69 | ||||||
| Turnout | 40,875 | 60.78 | −4.65 | |||||
| Electors on the lists | 67,253 | |||||||
Source: Official Results, Elections Canada and Financial Returns, Elections Canada.
| Canadian federal election, 2004 | ||||||||
|---|---|---|---|---|---|---|---|---|
| Party | Candidate | Votes | % | ±% | Expenditures | |||
| Liberal | Jean Lapierre | 15,675 | 40.94 | −6.74 | $58,392 | |||
| Bloc Québécois | François Rebello | 12,730 | 33.25 | +4.96 | $63,640 | |||
| New Democratic | Omar Aktouf | 5,382 | 14.06 | +8.48 | $11,371 | |||
| Conservative | Marc Rousseau | 2,284 | 5.97 | −5.37 | $38,835 | |||
| Green | Shaun Perceval-Maxwell | 1,643 | 4.29 | +0.54 | $475 | |||
| Marijuana | Yan Lacombe | 452 | 1.18 | -1.39 | ||||
| Marxist–Leninist | Linda Sullivan | 120 | 0.31 | −0.18 | ||||
| Total valid votes/Expense limit | 38,286 | 100.00 | – | $73,313 | ||||
| Canadian federal election, 2000 | ||||||||
|---|---|---|---|---|---|---|---|---|
| Party | Candidate | Votes | % | ±% | Expenditures | |||
| Liberal | Martin Cauchon | 18,796 | 47.68 | −2.47 | $52,920 | |||
| Bloc Québécois | Amir Khadir | 11,151 | 28.29 | −0.10 | $50,207 | |||
| Progressive Conservative | Robert Archambault | 3,190 | 8.09 | −4.12 | $3,360 | |||
| New Democratic | Peter Graefe | 2,199 | 5.58 | −0.86 | $590 | |||
| Green | Jan Schotte | 1,478 | 3.75 | – | $260 | |||
| Alliance | Josée Duchesneau | 1,283 | 3.25 | – | $1,425 | |||
| Marijuana | Huguette Plourde | 1,013 | 2.57 | – | none listed | |||
| Marxist–Leninist | Louise Charron | 194 | 0.49 | −0.36 | $10 | |||
| Communist | Pierre Smith | 118 | 0.30 | – | $187 | |||
| Total | 39,422 | 100.00 | ||||||
| Canadian federal election, 1997 | ||||||||
|---|---|---|---|---|---|---|---|---|
| Party | Candidate | Votes | % | ±% | ||||
| Liberal | Martin Cauchon | 22,271 | 50.15 | +3.34 | ||||
| Bloc Québécois | Michel Sarra-Bournet | 12,608 | 28.39 | −8.98 | ||||
| Progressive Conservative | Marguerite Sicard | 5,424 | 12.21 | +3.30 | ||||
| New Democratic | Tooker Gomberg | 2,862 | 6.44 | +1.89 | ||||
| Natural Law | Denis Cauchon | 868 | 1.95 | +0.45 | ||||
| Marxist–Leninist | Louise Charron | 378 | 0.85 | +0.46 | ||||
| Total | 44,411 | 100.00 | – | |||||
| Canadian federal election, 1993 | ||||||||
|---|---|---|---|---|---|---|---|---|
| Party | Candidate | Votes | % | ±% | ||||
| Liberal | Martin Cauchon | 21,638 | 46.81 | +12.10 | ||||
| Bloc Québécois | Jean-Louis Hérivault | 17,274 | 37.37 | – | ||||
| Progressive Conservative | Jean Pierre Hogue | 4,119 | 8.91 | −29.52 | ||||
| New Democratic | Catherine Kallos | 2,104 | 4.55 | −15.93 | ||||
| Natural Law | Daniel Bergeron | 694 | 1.50 | – | ||||
| Marxist–Leninist | Michel Rocheleau | 179 | 0.39 | – | ||||
| Abolitionist | Sylvain M. Coulombe | 131 | 0.28 | – | ||||
| Commonwealth of Canada | Mamunor Rashid | 89 | 0.19 | −0.07 | ||||
| Total | 46,228 | 100.00 | – | |||||
| Canadian federal election, 1988 | ||||||||
|---|---|---|---|---|---|---|---|---|
| Party | Candidate | Votes | % | ±% | ||||
| Progressive Conservative | Jean-Pierre Hogue | 17,597 | 38.43 | +9.15 | ||||
| Liberal | Lucie Pépin | 15,895 | 34.71 | −6.21 | ||||
| New Democratic | Louise O'Neill | 9,379 | 20.48 | +1.82 | ||||
| Green | Harriett Fels | 1,342 | 2.93 | +0.42 | ||||
| Rhinoceros | Milenko P. Miljévic | 1,077 | 2.35 | −1.84 | ||||
| Communist | Monique Marcotte | 200 | 0.44 | −0.07 | ||||
| Independent | Fernand Deschamps | 183 | 0.40 | – | ||||
| Commonwealth of Canada | Guy Huard | 117 | 0.26 | −0.13 | ||||
| Total | 45,790 | 100.00 | – | |||||
| Canadian federal election, 1984 | ||||||||
|---|---|---|---|---|---|---|---|---|
| Party | Candidate | Votes | % | ±% | ||||
| Liberal | Lucie Pépin | 14,508 | 40.92 | −30.57 | ||||
| Progressive Conservative | Anne-Marie Sylvestre | 10,383 | 29.28 | +21.96 | ||||
| New Democratic | Johanne Beaudin | 6,687 | 18.86 | +6.44 | ||||
| Rhinoceros | Claude V.U. Hamel | 1,484 | 4.19 | −2.235 | ||||
| Parti nationaliste | Roger Lebeuf | 1,185 | 3.34 | – | ||||
| Green | François Lubrina | 890 | 2.51 | – | ||||
| Communist | Jocelyne Rioux | 182 | 0.51 | +0.04 | ||||
| Commonwealth of Canada | Christiane Deland-Gervais | 139 | 0.39 | – | ||||
| Total | 35,458 | 100.00 | – | |||||
| Canadian federal election, 1980 | ||||||||
|---|---|---|---|---|---|---|---|---|
| Party | Candidate | Votes | % | ±% | ||||
| Liberal | Marc Lalonde | 23,004 | 71.4 | −0.66 | ||||
| New Democratic | Claire A. Brisson | 3,996 | 12.42 | +2.09 | ||||
| Progressive Conservative | Diane Chevrette | 2,355 | 7.32 | +1.96 | ||||
| Rhinoceros | Philippe Langlois | 2,065 | 6.42 | −0.02 | ||||
| Independent | Danielle Trudel | 277 | 0.86 | – | ||||
| Communist | Jocelyne Rioux | 150 | 0.47 | +0.01 | ||||
| Independent | H.-Georges Grenier | 140 | 0.44 | – | ||||
| Union populaire | Colette Picard-Desjardins | 128 | 0.40 | +0.13 | ||||
| Marxist–Leninist | Robert Wallace | 64 | 0.20 | −0.03 | ||||
| Total | 32,179 | 100.00 | – | |||||
| Canadian federal election, 1979 | ||||||||
|---|---|---|---|---|---|---|---|---|
| Party | Candidate | Votes | % | ±% | ||||
| Liberal | Marc Lalonde | 28,710 | 72.15 | −0.15 | ||||
| New Democratic | Claire A. Brisson | 4,112 | 10.33 | −1.91 | ||||
| Rhinoceros | Serge Beauchemin | 2,564 | 6.44 | – | ||||
| Progressive Conservative | Henriette Guérin | 2,134 | 5.36 | −5.30 | ||||
| Social Credit | Philippe Chartrand | 1,765 | 4.44 | +2.09 | ||||
| Communist | Jocelyne Rioux | 185 | 0.46 | – | ||||
| Independent | Fred Haight | 122 | 0.31 | – | ||||
| Union populaire | G. Spooner | 108 | 0.27 | – | ||||
| Marxist–Leninist | Robert Wallace | 91 | 0.23 | −0.86 | ||||
| Total | 39,791 | 100.00 | – | |||||
| Canadian federal election, 1974 | ||||||||
|---|---|---|---|---|---|---|---|---|
| Party | Candidate | Votes | % | ±% | ||||
| Liberal | Marc Lalonde | 20,400 | 72.30 | +6.82 | ||||
| New Democratic | Georges Louis Valois | 3,453 | 12.24 | −3.74 | ||||
| Progressive Conservative | Symone Beaudin | 3,007 | 10.66 | +2.06 | ||||
| Social Credit | Joseph-Endré De Csavossy | 663 | 2.35 | −1.95 | ||||
| Independent | Vera Jackson | 399 | 1.41 | – | ||||
| Marxist–Leninist | Micheline Mélanson | 292 | 1.03 | – | ||||
| Total | 28,214 | 100.00 | – | |||||
| Canadian federal election, 1972 | ||||||||
|---|---|---|---|---|---|---|---|---|
| Party | Candidate | Votes | % | ±% | ||||
| Liberal | Marc Lalonde | 21,399 | 65.48 | −13.18 | ||||
| New Democratic | Henri-François Gautrin | 5,223 | 15.98 | +4.58 | ||||
| Progressive Conservative | André Poitras | 2,811 | 8.60 | −1.34 | ||||
| Rhinoceros | Réginald Martel | 1,565 | 4.79 | – | ||||
| Social Credit | Maurice Benoit | 1,404 | 4.30 | – | ||||
| Independent | Harold J. Glick | 168 | 0.51 | – | ||||
| Independent | H.-Georges Grenier | 109 | 0.33 | – | ||||
| Total | 32,679 | 100.00 | – | |||||
| Canadian federal election, 1968 | ||||||||
|---|---|---|---|---|---|---|---|---|
| Party | Candidate | Votes | % | ±% | ||||
| Liberal | Aurélien Noël | 24,219 | 78.66 | +23.99 | ||||
| New Democratic | Saul Handelman | 3,511 | 11.40 | −31.03 | ||||
| Progressive Conservative | Neil Morrison | 3,059 | 9.94 | – | ||||
| Total | 30,789 | 100.00 | – | |||||
Outremont—Saint-Jean, 1949–1968
| Canadian federal by-election, 29 May 1967 | ||||||||
|---|---|---|---|---|---|---|---|---|
| Party | Candidate | Votes | % | ±% | ||||
| On Mr. Lamontagne's resignation, 4 June 1967 | ||||||||
| Liberal | Aurélien Noël | 6,262 | 54.67% | +2.10% | ||||
| New Democratic | Denis Lazure | 4,860 | 42.43% | +25.89% | ||||
| Esprit social | Henri-Georges Grenier | 214 | 1.87% | −0.19% | ||||
| Rhinoceros | F.-L.-M. Bonnier | 118 | 1.03% | |||||
| Total valid votes | 11,454 | 100.00% | ||||||
| Canadian federal election, 1965 | ||||||||
|---|---|---|---|---|---|---|---|---|
| Party | Candidate | Votes | % | ±% | ||||
| Liberal | Maurice Lamontagne | 11,855 | 52.57% | −4.06% | ||||
| New Democratic | Monique Ferron | 3,730 | 16.54% | −1.45% | ||||
| Progressive Conservative | Albert Guilbeault | 3,241 | 14.37% | −5.56% | ||||
| Ralliement créditiste | André Poitras | 3,259 | 14.45% | +9.01% | 2.06% | |||
| Droit vital personnel | Henri-Georges Grenier | 465 | 2.06% | |||||
| Total valid votes | 22,550 | 100.00% | ||||||
Note: Ralliement créditiste vote is compared to Social Credit vote in the 1963 election.
| Canadian federal election, 1963 | ||||||||
|---|---|---|---|---|---|---|---|---|
| Party | Candidate | Votes | % | ±% | ||||
| Liberal | Maurice Lamontagne | 13,305 | 56.63% | +9.55% | ||||
| Progressive Conservative | Marc Lacoste | 4,684 | 19.94% | −10.28% | ||||
| New Democratic | Thérèse Casgrain | 4,227 | 17.99% | −2.02% | ||||
| Social Credit | Léopold Savard | 1,278 | 5.44% | +2.76% | ||||
| Total valid votes | 23,494 | 100.00% | ||||||
| Canadian federal election, 1962 | ||||||||
|---|---|---|---|---|---|---|---|---|
| Party | Candidate | Votes | % | ±% | ||||
| Liberal | Romuald Bourque | 10,134 | 47.08% | −8.51% | ||||
| Progressive Conservative | Marc Lacoste | 6,504 | 30.22% | −8.72% | ||||
| New Democratic | Thérèse Casgrain | 4,308 | 20.02% | +14.55% | ||||
| Social Credit | Jean-Guy Laprise | 577 | 2.68% | |||||
| Total valid votes | 21,523 | 100.00% | ||||||
Note: NDP vote is compared to CCF vote in 1958 election.
| Canadian federal election, 1958 | ||||||||
|---|---|---|---|---|---|---|---|---|
| Party | Candidate | Votes | % | ±% | ||||
| Liberal | Romuald Bourque | 12,715 | 55.60% | −17.10% | ||||
| Progressive Conservative | Conrad Archambault | 8,906 | 38.94% | +18.46% | ||||
| Co-operative Commonwealth | Gaston Miron | 1,249 | 5.46% | −1.36% | ||||
| Total valid votes | 22,870 | 100.00% | ||||||
| Canadian federal election, 1957 | ||||||||
|---|---|---|---|---|---|---|---|---|
| Party | Candidate | Votes | % | ±% | ||||
| Liberal | Romuald Bourque | 13,840 | 72.70% | +3.92% | ||||
| Progressive Conservative | René Dostaler | 3,899 | 20.48% | −4.65% | ||||
| Co-operative Commonwealth | Gaston Miron | 1,299 | 6.82% | +4.22% | ||||
| Total valid votes | 19,038 | 100.00% | ||||||
| Canadian federal election, 1953 | ||||||||
|---|---|---|---|---|---|---|---|---|
| Party | Candidate | Votes | % | ±% | ||||
| Liberal | Romuald Bourque | 11,536 | 68.77% | +12.75% | ||||
| Progressive Conservative | Gaston Sylvestre | 4,216 | 25.13% | −3.37% | ||||
| Co-operative Commonwealth | Pierre-D. Gagnon | 436 | 2.60% | −7.50% | ||||
| Labor–Progressive | Anne Eizner | 406 | 2.42% | |||||
| Independent Progressive Conservative | Homère Louiselle | 180 | 1.07% | |||||
| Total valid votes | 16,774 | 100.00% | ||||||
| Canadian federal by-election, 6 October 1952 | ||||||||
|---|---|---|---|---|---|---|---|---|
| Party | Candidate | Votes | % | ±% | ||||
| On Mr. Rinfret being appointed Puisne Judge, Court of Queen's Bench, Quebec, 12 February 1952 | ||||||||
| Liberal | Romuald Bourque | 6,294 | 56.02% | −20.30% | ||||
| Progressive Conservative | Claude Nolin | 3,203 | 28.51% | +4.83% | ||||
| Co-operative Commonwealth | Thérèse Casgrain | 1,135 | 10.10% | |||||
| Independent Liberal | Raymond Bourque | 442 | 3.93% | |||||
| Independent | Ben Ash | 161 | 1.43% | |||||
| Total valid votes | 11,235 | 100.00% | ||||||
| Canadian federal election, 1949 | ||||||||
|---|---|---|---|---|---|---|---|---|
| Party | Candidate | Votes | % | ±% | ||||
| Liberal | Édouard Rinfret | 16,215 | 76.32% | +20.28% | ||||
| Progressive Conservative | Alphonse Bélanger | 5,030 | 23.68% | +9.51% | ||||
| Total valid votes | 21,245 | 100.00% | ||||||
Outremont, 1935–1949
| Canadian federal election, 1945 | ||||||||
|---|---|---|---|---|---|---|---|---|
| Party | Candidate | Votes | % | ±% | ||||
| Liberal | Édouard-Gabriel Rinfret | 14,836 | 56.04% | −8.01% | ||||
| Progressive Conservative | Joseph Hector Bender | 3,750 | 14.17% | |||||
| Bloc populaire | Joseph-Alfred Goyer | 3,259 | 12.31% | |||||
| Independent Liberal | John P. Callaghan | 1,762 | 6.66% | |||||
| Co-operative Commonwealth | Abraham Jacob Rosenstein | 1,639 | 6.19% | |||||
| Labor–Progressive | Gertrude Partridge | 1,227 | 4.63% | |||||
| Total valid votes | 26,473 | 100.00% | ||||||
| Canadian federal by-election, 30 November 1942 | ||||||||
|---|---|---|---|---|---|---|---|---|
| Party | Candidate | Votes | % | ±% | ||||
| On Mr. Vien's resignation, 5 October 1942 | ||||||||
| Liberal | Léo Richer Laflèche | 12,378 | 64.05% | −2.35% | ||||
| Bloc populaire | Jean Drapeau | 6,948 | 35.95% | |||||
| Total valid votes | 19,326 | 100.00% | ||||||
| Canadian federal election, 1940 | ||||||||
|---|---|---|---|---|---|---|---|---|
| Party | Candidate | Votes | % | ±% | ||||
| Liberal | Thomas Vien | 14,511 | 66.40% | 10.50% | ||||
| National Government | Joseph-Hector Bender | 4,556 | 20.85% | −14.10% | ||||
| Independent Liberal | Ernest Poulin | 2,787 | 12.75% | |||||
| Total valid votes | 21,854 | 100.00% | ||||||
Note: "National Government" vote is compared to Conservative vote in 1935 election.
| Canadian federal election, 1935 | ||||||||
|---|---|---|---|---|---|---|---|---|
| Party | Candidate | Votes | % | |||||
| Liberal | Thomas Vien | 11,260 | 55.90% | |||||
| Conservative | Jean-Joseph Penverne | 7,040 | 34.95% | |||||
| Reconstruction | Hervé Roch | 1,844 | 9.15% | |||||
| Total valid votes | 20,144 | 100.00% | ||||||
See also
References
- "(Code 24047) Census Profile". 2011 census. Statistics Canada. 2012. Retrieved 2011-03-07.
Notes
- ↑ Statistics Canada: 2017
- ↑ Statistics Canada: 2017
- ↑ http://www12.statcan.gc.ca/nhs-enm/2011/dp-pd/prof/details/page.cfm?Lang=E&Geo1=FED2013&Code1=24054&Data=Count&SearchText=outremont&SearchType=Begins&SearchPR=01&A1=All&B1=All&Custom=&TABID=1
- ↑ https://www12.statcan.gc.ca/census-recensement/2016/dp-pd/dt-td/Rp-eng.cfm?LANG=E&APATH=3&DETAIL=0&DIM=0&FL=A&FREE=0&GC=0&GID=0&GK=0&GRP=1&PID=109983&PRID=10&PTYPE=109445&S=0&SHOWALL=0&SUB=0&Temporal=2016&THEME=118&VID=0&VNAMEE=&VNAMEF=
- ↑ Elections Canada – Election Results, 22 October 2015
- ↑ Elections Canada – Preliminary Election Expenses Limits for Candidates
- ↑ Pundits' Guide to Canadian Elections
.png)