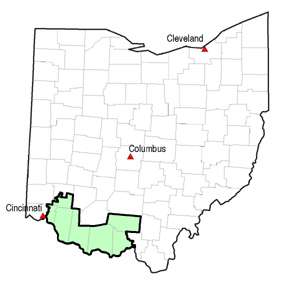
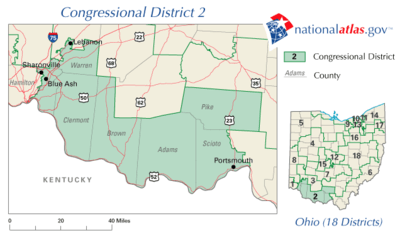
Ohio's 2nd congressional district
| Ohio's 2nd congressional district | |
|---|---|
.tif.png) Ohio's 2nd congressional district - since January 3, 2013. | |
| Current Representative | Brad Wenstrup (R–Cincinnati) |
| Distribution |
|
| Population (2016) | 724,451[2] |
| Median income | $55,472 |
| Ethnicity |
|
| Cook PVI | R+9[3] |
Ohio's 2nd congressional district is a district in southern Ohio. It is currently represented by Brad Wenstrup.
The district stretches along the Ohio River from the Hamilton County suburbs of Cincinnati east to Scioto County. It includes all of Adams, Brown, Pike, Clermont, and Highland counties, as well as parts of Hamilton, Scioto, and Ross counties.
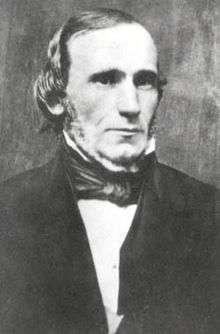
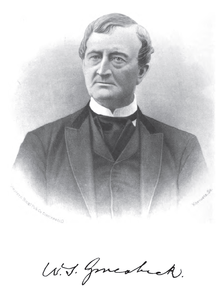
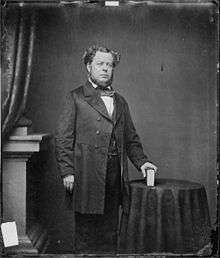
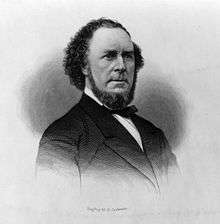
List of representatives
| Representative | Party | Congress(es) | Year(s) | Notes |
|---|---|---|---|---|
| District created March 4, 1813 | ||||
 |
Democratic-Republican | 13th–14th | March 4, 1813 – March 3, 1817 |
|
 |
15th–17th | March 4, 1817 – March 3, 1823 |
Redistricted to the 5th district | |
 |
Crawford D-R | 18th | March 4, 1823 – March 3, 1825 |
Redistricted from the 1st district |
.jpg) |
Adams | 19th–20th | March 4, 1825 – March 3, 1829 |
|
|
Jacksonian | 21st | March 4, 1829 – March 3, 1831 |
|
 |
Anti-Jacksonian | 22nd | March 4, 1831 – March 3, 1833 |
Redistricted to the 4th district |
|
Jacksonian | 23rd–24th | March 4, 1833 – March 3, 1837 |
|
| Democratic | 25th | March 4, 1837 – March 3, 1839 | ||
 |
26th–28th | March 4, 1839 – March 3, 1845 |
||
|
29th | March 4, 1845 – March 3, 1847 |
||
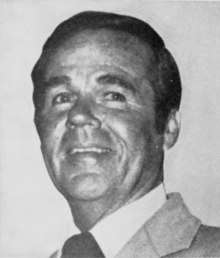
.jpg) |
Whig | 30th | March 4, 1847 – March 3, 1849 |
|
 |
31st–32nd | March 4, 1849 – March 3, 1853 |
Redistricted to the 3rd district | |
 |
33rd | March 4, 1853 – March 3, 1855 |
||
| Opposition | 34th | March 4, 1855 – March 3, 1857 | ||
 |
Democratic | 35th | March 4, 1857 – March 3, 1859 |
|
 |
Republican | 36th–37th | March 4, 1859 – March 3, 1863 |
|
 |
Democratic | 38th | March 4, 1863 – March 3, 1865 |
|
 |
Republican | 39th–40th | March 4, 1865 – July 20, 1867 |
Nominated Governor of Ohio |
| Vacant | 40th | July 20, 1867 – November 21, 1867 | ||
 |
Independent Republican | 40th | November 21, 1867 – March 3, 1869 |
|
 |
Republican | 41st–42nd | March 4, 1869 – March 3, 1873 |
|
 |
Liberal Republican | 43rd | March 4, 1873 – March 3, 1875 |
|
| Democratic | 44th–45th | March 4, 1875 – March 3, 1879 | ||
 |
Republican | 46th–47th | March 4, 1879 – March 4, 1883 |
|
 |
Democratic | 48th | March 4, 1883 – March 3, 1885 |
|
 |
Republican | 49th–50th | March 4, 1885 – March 3, 1889 |
|
 |
51st–53rd | March 4, 1889 – May 4, 1894 |
Elected Mayor of Cincinnati | |
| Vacant | 53rd | May 4, 1894 – December 3, 1894 | ||
 |
Republican | 53rd–57th | December 3, 1894 – March 3, 1903 |
|
 |
58th–61st | March 4, 1903 – March 4, 1911 |
||
 |
Democratic | 62nd–64th | March 4, 1911 – March 3, 1917 |
|
 |
Republican | 65th | March 4, 1917 – March 3, 1919 |
|
 |
66th–69th | March 4, 1919 – February 12, 1927 |
Died | |
| Vacant | 69th–70th | February 12, 1927 – November 8, 1927 | ||
|
Republican | 70th | November 8, 1927 – March 3, 1929 |
|
 |
71st–74th | March 4, 1929 – January 3, 1937 |
||
 |
Democratic | 75th | January 3, 1937 – January 3, 1939 |
|
 |
Republican | 76th–80th | January 3, 1939 – January 3, 1949 |
|
|
Democratic | 81st | January 3, 1949 – January 3, 1951 |
|
|
Republican | 82nd–86h | January 3, 1951 – January 3, 1961 |
|
 |
84th–94th | January 3, 1961 – January 3, 1977 |
||
 |
Democratic | 95th–97th | January 3, 1977 – January 3, 1983 |
Redistricted to the 1st district |
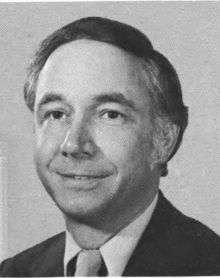 |
Republican | 98th–103rd | January 3, 1983 – January 31, 1993 |
Redistricted from the 1st district, Resigned |
| Vacant | 103rd | January 31, 1993 – May 4, 1993 | ||
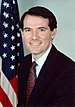 |
Republican | 103rd–109th | May 4, 1993 – April 29, 2005 |
Appointed U.S. Trade Representative |
| Vacant | 109th | April 29, 2005 – August 2, 2005 | ||
 |
Republican | 109th– 112th |
August 2, 2005 – January 3, 2013 |
Lost re-nomination. |
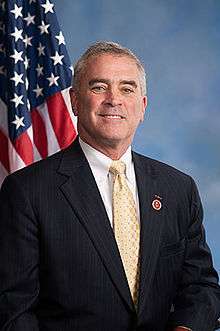 |
113th– |
January 3, 2013 – present |
||
Election results
The following chart shows historic election results. Bold type indicates victor. Italic type indicates incumbent.
| Year | Democratic | Republican | Other |
|---|---|---|---|
| 2016[4] | William Smith: 111,694 | Brad Wenstrup: 221,193 | Janet Everhard (write-in Dem): 7,392 |
| 2014[5] | Marek Tyszkiewicz: 68,453 | Brad Wenstrup: 132,658 | |
| 2012[6] | William Smith: 137,082 | Brad Wenstrup: 194,299 | |
| 2010 | Surya Yalamanchili: 80,139 | Jean Schmidt: 136,120 | Marc Johnson (Libertarian) 15,867 |
| 2008 | Victoria Wulsin: 124,076 | Jean Schmidt: 148,500 | David Krikorian: 58,650; James Condit: 30 |
| 2006 | Victoria Wulsin: 117,595 | Jean Schmidt: 120,112 | |
| 2005* | Paul Hackett: 55,151 | Jean Schmidt: 59,132 | |
| 2004 | Charles W. Sanders: 87,156 | Robert J. Portman: 221,785 | |
| 2002 | Charles W. Sanders: 48,785 | Robert J. Portman: 139,218 | |
| 2000 | Charles W. Sanders: 64,091 | Robert J. Portman: 204,184 | Robert E. Bidwell (L): 9,266 |
| 1998 | Charles W. Sanders: 49,293 | Robert J. Portman: 154,344 | |
| 1996 | Thomas R. Chandler: 58,715 | Robert J. Portman: 186,853 | Kathleen M. McKnight (N): 13,905 |
| 1994 | Les Mann: 43,730 | Robert J. Portman: 150,128 | |
| 1993* | Lee Hornberger: 22,652 | Robert J. Portman: 53,020 | |
| 1992 | Thomas R. Chandler: 75,924 | Willis D. Gradison Jr.: 177,720 | |
| 1990 | Tyrone K. Yates: 57,345 | Willis D. Gradison Jr.: 103,817 | |
| 1988 | Chuck R. Stidham: 58,637 | Willis D. Gradison Jr.: 153,162 | |
| 1986 | William F. Stineman: 43,448 | Willis D. Gradison Jr.: 105,061 | |
| 1984 | Thomas J. Porter: 68,597 | Willis D. Gradison Jr.: 149,856 | |
| 1982 | William J. Luttmer: 53,169 | Willis D. Gradison Jr.*: 97,434 | Joseph I. Lombardo: 1,827 Charles K. Shrout Jr. (L): 2,948 |
| 1980 | Thomas A. Luken*: 103,423 | Thearon "Tom" Atkins: 72,693 | |
| 1978 | Thomas A. Luken: 64,522 | Stanley J. Aronoff: 58,716 | |
| 1976 | Thomas A. Luken: 88,178 | Donald D. Clancy: 83,459 | |
| 1974 | Edward W. Wolterman: 67,685 | Donald D. Clancy: 71,512 | |
| 1972 | Penny Manes: 65,237 | Donald D. Clancy: 109,961 | |
| 1970 | Gerald N. "Jerry" Springer: 60,860 | Donald D. Clancy: 77,071 | |
| 1968 | Don Driehaus: 52,327 | Donald D. Clancy: 108,157 | |
| 1966 | Thomas E. Anderson: 42,367 | Donald D. Clancy: 102,313 | |
| 1964 | H. A. Sand: 79,824 | Donald D. Clancy: 122,487 | |
| 1962 | H. A. Sand: 62,733 | Donald D. Clancy: 105,750 | |
| 1960 | H. A. Sand: 87,531 | Donald D. Clancy: 118,046 | |
| 1958 | James O. Bradley: 71,674 | William E. Hess: 86,656 | |
| 1956 | James T. Dewan: 57,554 | William E. Hess: 109,099 | |
| 1954 | Earl T. Wagner: 49,690 | William E. Hess: 69,695 | |
| 1952 | Earl T. Wagner: 69,341 | William E. Hess: 90,417 | |
| 1950 | Earl T. Wagner: 62,542 | William E. Hess: 69,543 | |
| 1948 | Earl T. Wagner: 75,062 | William E. Hess: 66,968 | |
| 1946 | Francis G. Davis: 39,112 | William E. Hess: 67,067 | |
| 1944 | J. Harry Moore: 61,473 | William E. Hess: 78,185 | |
| 1942 | Nicholas Bauer: 29,823 | William E. Hess: 53,083 | |
| 1940 | James E. O'Connell: 60,410 | William E. Hess: 77,769 | |
| 1938 | Herbert S. Bigelow: 42,773 | William E. Hess: 61,480 | |
| 1936 | Herbert S. Bigelow: 67,213 | William E. Hess: 62,546 | |
| 1934 | Charles E. Miller: 41,701 | William E. Hess: 51,171 | |
| 1932 | Edward F. Alexander: 57,258 | William E. Hess: 58,971 | |
| 1930 | Charles W. Sawyer: 45,761 | William E. Hess: 46,347 | |
| 1928 | James H. Cleveland: 54,332 | William E. Hess: 63,605 | |
| 1926 | Robert J. O'Donnell: 26,322 | A. E. B. Stephens: 36,608 | |
| 1924 | Robert J. O'Donnell: 34,118 | A. E. B. Stephens: 47,331 | |
| 1922 | John R. Quane: 30,051 | A. E. B. Stephens: 39,898 | Charles A. Herbst (FL): 4,001 |
| 1920 | Thomas H. Morrow: 41,781 | A. E. B. Stephens: 47,797 | John Partridge: 1,291 |
- In 2005, a special election was required to fill the seat following Portman's resignation to accept nomination to the office of United States Trade Representative.
- In May 1993, a special election was held to fill the seat to replace Willis D. Gradison Jr. who, three months after his re-election, resigned on 31 January 1993, to become a lobbyist for the insurance industry as president of the Health Insurance Association of America.
- Redistricting following the 1980 census moved Luken from the second district to the first district and Gradison from the first district to the second district.
2005 special election
The district has not elected a Democrat since Tom Luken won a 1974 special election.
On August 2, 2005, elections were held to choose a United States Representative to replace Rob Portman, who resigned his seat on April 29, 2005, to become United States Trade Representative. Republican Jean Schmidt candidate defeated Democrat Paul Hackett in a surprisingly close election.
Re-election bid in 2006
Schmidt defeated Democrat Victoria Wells Wulsin, a doctor from Indian Hill, in the November general election.
2010
| Party | Candidate | Votes | % | |
|---|---|---|---|---|
| Republican | Jean Schmidt* | 139,027 | 58.45 | |
| Democratic | Surya Yalamanchili | 82,431 | 34.66 | |
| Libertarian | Marc Johnston | 16,259 | 6.84 | |
| Total votes | 237,717 | 100.00 | ||
| Turnout | ||||
| Republican hold | ||||
Competitiveness
Election results from presidential races:
| Year | Office | Results |
|---|---|---|
| 2000 | President | George W. Bush 63 - Al Gore 34% |
| 2004 | President | George W. Bush 64 - John Kerry 36% |
| 2008 | President | John McCain 59 - Barack Obama 40% |
| 2012 | President | Mitt Romney 55 - Barack Obama 44% |
| 2016 | President | Donald Trump 56 - Hillary Clinton 40% |
Historical district boundaries
See also
References
- ↑ https://www.census.gov/geo/maps-data/data/cd_state.html
- ↑ https://www.census.gov/mycd/?st=39&cd=02
- ↑ "Partisan Voting Index – Districts of the 115th Congress" (PDF). The Cook Political Report. April 7, 2017. Retrieved April 7, 2017.
- ↑ "2016 Official Elections Results". www.sos.state.oh.us. Retrieved 2017-01-02.
- ↑ "2014 Election Results". Ohio Secretary of State.
- ↑ "2012 Election Results". Ohio Secretary of State.
- Martis, Kenneth C. (1989). The Historical Atlas of Political Parties in the United States Congress. New York: Macmillan Publishing Company.
- Martis, Kenneth C. (1982). The Historical Atlas of United States Congressional Districts. New York: Macmillan Publishing Company.
- Congressional Biographical Directory of the United States 1774–present