New Madrid, Missouri
| New Madrid, Missouri | |
|---|---|
| City | |
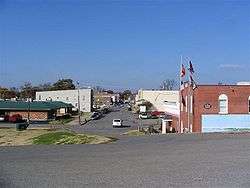 New Madrid, facing away from the Mississippi | |
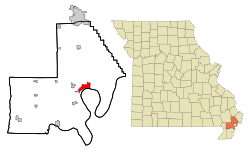 Location of New Madrid, Missouri | |
| Coordinates: 36°35′16″N 89°32′9″W / 36.58778°N 89.53583°WCoordinates: 36°35′16″N 89°32′9″W / 36.58778°N 89.53583°W | |
| Country | United States |
| State | Missouri |
| County | New Madrid |
| Area[1] | |
| • Total | 4.53 sq mi (11.73 km2) |
| • Land | 4.49 sq mi (11.63 km2) |
| • Water | 0.04 sq mi (0.10 km2) |
| Elevation | 295 ft (90 m) |
| Population (2010)[2] | |
| • Total | 3,116 |
| • Estimate (2016)[3] | 2,957 |
| • Density | 690/sq mi (270/km2) |
| Time zone | UTC-6 (Central (CST)) |
| • Summer (DST) | UTC-5 (CDT) |
| ZIP code | 63869 |
| Area code(s) | 573 |
| FIPS code | 29-52076[4] |
| GNIS feature ID | 0723282[5] |
| Website | http://www.new-madrid.mo.us/ |
New Madrid is a city in New Madrid County, Missouri, United States. Located on the Kentucky Bend of the Mississippi River, it is 42 miles (68 km) southwest of Cairo, Illinois, and north of an exclave of Fulton County, Kentucky, across the river.
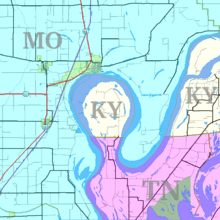
The town is on the north side of the Kentucky Bend in the Mississippi River, which is also known as "New Madrid Bend" or "Madrid Bend." The river curves in an oxbow around an exclave of Fulton County, Kentucky. Scientists expect the river eventually to cut across the neck of the peninsula and make a more direct channel, leaving the Kentucky territory as an island.
New Madrid was the epicenter of the very powerful 1811–12 New Madrid earthquakes.
History
.tif.jpg)
New Madrid was founded in about 1778 by Spanish Governor Bernardo de Gálvez, who was appointed to rule Spanish Louisiana (the land west of the Mississippi River). He welcomed settlers from the United States, but required them to become citizens of Spain. In addition, they had to agree to live under the guidance of his appointed empresario, Colonel William Morgan, an American Revolutionary War veteran from New Jersey. Morgan recruited a number of American families to settle at New Madrid, attracting some 2,000 people to the region.[6]
In 1800, Spain traded the territory back to France in the Third Treaty of San Ildefonso. After trying to regain control of Saint-Domingue, where a slave rebellion was underway, Napoleon gave up on his North American colonies, agreeing to sell this territory to the United States in 1803 as part of the Louisiana Purchase.
The area is noted as the site of a series of more than 1,000 earthquakes in 1811 and 1812, ranging up to approximately magnitude 8, the most powerful non-subduction zone earthquake ever recorded in the United States. New Madrid lies far from any plate boundaries, but it is on the New Madrid Seismic Zone.[7] The major earthquake was felt as far away as the East Coast.[8]
During the Civil War, the Battle of Island Number Ten took place on the Mississippi River near New Madrid.
In the antebellum period, this fertile floodplain area was developed for cotton plantations, based on the labor of enslaved African Americans. They were emancipated after the Civil War and worked to make new lives. As whites struggled to re-establish dominance after the Reconstruction era, they intimidated and attacked blacks under the guise of Jim Crow laws, working to suppress voting and control their activities. Three African-American men are documented as being lynched by whites in New Madrid, the county seat, near the turn of the century: Unknown Negro, on November 29, 1898; Louis Wright, a musician in a minstrel show accused of altercations with whites, hanged on February 17, 1902;[9] and unknown Negro, May 30, 1910.[10]
By the turn of the 20th century, some industry was being developed in New Madrid, which contained two lumber mills, a grist mill, a stave and heading factory, and a cotton gin. It was considered a rough town.[9] There were four Protestant churches, two with independent African-American congregations, and one Catholic church.[11] In 1900, 1,489 people lived in New Madrid; in 1910, the population was 1,882.
The population was 3,116 at the 2010 census. New Madrid is the county seat of New Madrid County.[12] The town is home to the consolidated middle and high schools.
Geography
New Madrid is located at 36°35′16″N 89°32′9″W / 36.58778°N 89.53583°W (36.59, -89.54).[13] According to the United States Census Bureau, the city has a total area of 4.53 square miles (11.73 km2), of which 4.49 square miles (11.63 km2) is land and 0.04 square miles (0.10 km2) is water.[1]
Climate
New Madrid has a humid subtropical climate (Köppen Cfa) with hot, humid summers and chilly, though not severe winters. Winter weather can vary from very mild and rainy when air masses from the Gulf of Mexico predominate, to very cold, dry and windy with northerly or northwesterly airflows as in the famous cold month of January 1977. On average there are 82 nights which fall to or below 32 °F or 0 °C, whilst one night falls to or below 0 °F or −17.8 °C, and the coldest temperature ever has been −14 °F or −25.6 °C on January 17, 1982. The hottest has been 107 °F or 41.7 °C record on August 4, 1964, whilst an average of 2.9 days exceed 100 °F or 37.8 °C.
Rainfall is fairly heavy throughout the year due to moist air from the Gulf being advected on the western side of the Bermuda High, plus occasional remnant depressions from hurricanes passing up the Mississippi Valley. Between 1963 and 2012 the wettest calendar year was 1990 with 71.24 inches or 1,809.5 millimetres and the driest 2005 with 32.36 inches or 821.9 millimetres. The wettest day was September 23, 2006 with 11.38 inches (289.1 mm) in one day, and September 2006 was also the wettest month with 15.27 inches (387.9 mm), whilst no precipitation fell during October 1964.
Snowfall is very rare as it is normally too dry to snow when cold air masses reach the Bootheel, so that the median is only 0.4 inches or 0.010 metres per year and the mean just 5.7 inches or 0.14 metres. The most snow in one month was in January 1977 with 13.1 inches or 0.33 metres, whilst the snowiest season was from July 1966 to June 1967 with 19.3 inches or 0.49 metres.
| Climate data for New Madrid, Missouri (1971-2000; extremes 1963 to 2012) | |||||||||||||
|---|---|---|---|---|---|---|---|---|---|---|---|---|---|
| Month | Jan | Feb | Mar | Apr | May | Jun | Jul | Aug | Sep | Oct | Nov | Dec | Year |
| Record high °F (°C) | 71 (22) |
77 (25) |
84 (29) |
94 (34) |
94 (34) |
104 (40) |
106 (41) |
107 (42) |
101 (38) |
92 (33) |
85 (29) |
74 (23) |
107 (42) |
| Average high °F (°C) | 41.5 (5.3) |
47.5 (8.6) |
57.6 (14.2) |
68.6 (20.3) |
78.0 (25.6) |
86.9 (30.5) |
91.1 (32.8) |
89.4 (31.9) |
82.6 (28.1) |
71.7 (22.1) |
57.4 (14.1) |
46.0 (7.8) |
68.2 (20.1) |
| Average low °F (°C) | 26 (−3) |
29 (−2) |
38 (3) |
48 (9) |
58 (14) |
66 (19) |
70 (21) |
68 (20) |
60 (16) |
48 (9) |
39 (4) |
29 (−2) |
48 (9) |
| Record low °F (°C) | −14 (−26) |
−4 (−20) |
8 (−13) |
25 (−4) |
35 (2) |
47 (8) |
52 (11) |
42 (6) |
35 (2) |
25 (−4) |
12 (−11) |
−11 (−24) |
−14 (−26) |
| Average precipitation inches (mm) | 3.34 (84.8) |
3.72 (94.5) |
4.72 (119.9) |
5.23 (132.8) |
5.06 (128.5) |
4.21 (106.9) |
4.05 (102.9) |
2.62 (66.5) |
3.47 (88.1) |
3.65 (92.7) |
4.67 (118.6) |
4.69 (119.1) |
49.43 (1,255.3) |
| Average snowfall inches (cm) | 2.6 (6.6) |
2.1 (5.3) |
0.4 (1) |
0.0 (0) |
0.0 (0) |
0.0 (0) |
0.0 (0) |
0.0 (0) |
0.0 (0) |
0.0 (0) |
trace | 0.6 (1.5) |
5.7 (14.5) |
| Average precipitation days (≥ 0.01 inch) | 9.5 | 8.1 | 10.8 | 10.1 | 10.9 | 8.8 | 8.2 | 6.2 | 7.1 | 7.5 | 9.4 | 9.9 | 106.5 |
| Average snowy days (≥ 0.1 inch) | 1.4 | 1.1 | 0.3 | 0.0 | 0.0 | 0.0 | 0.0 | 0.0 | 0.0 | 0.0 | 0.0 | 0.4 | 3.2 |
| Source #1: National Oceanic and Atmospheric Administration[14] | |||||||||||||
| Source #2: National Weather Service Paducah[15] | |||||||||||||
Demographics
| Historical population | |||
|---|---|---|---|
| Census | Pop. | %± | |
| 1860 | 610 | — | |
| 1870 | 634 | 3.9% | |
| 1880 | 712 | 12.3% | |
| 1890 | 1,193 | 67.6% | |
| 1900 | 1,489 | 24.8% | |
| 1910 | 1,882 | 26.4% | |
| 1920 | 1,908 | 1.4% | |
| 1930 | 2,309 | 21.0% | |
| 1940 | 2,450 | 6.1% | |
| 1950 | 2,726 | 11.3% | |
| 1960 | 2,867 | 5.2% | |
| 1970 | 2,719 | −5.2% | |
| 1980 | 3,204 | 17.8% | |
| 1990 | 3,350 | 4.6% | |
| 2000 | 3,334 | −0.5% | |
| 2010 | 3,116 | −6.5% | |
| Est. 2016 | 2,957 | [3] | −5.1% |
| source:[16] | |||
2010 census
As of the census[2] of 2010, there were 3,116 people, 1,276 households, and 809 families residing in the city. The population density was 694.0 inhabitants per square mile (268.0/km2). There were 1,424 housing units at an average density of 317.1 per square mile (122.4/km2). The racial makeup of the city was 72.30% White, 25.55% Black or African American, 0.22% Native American, 0.26% Asian, 0.13% from other races, and 1.54% from two or more races. Hispanic or Latino of any race were 0.80% of the population.
There were 1,276 households of which 32.3% had children under the age of 18 living with them, 39.9% were married couples living together, 18.2% had a female householder with no husband present, 5.3% had a male householder with no wife present, and 36.6% were non-families. 32.4% of all households were made up of individuals and 14% had someone living alone who was 65 years of age or older. The average household size was 2.34 and the average family size was 2.94.
The median age in the city was 39.8 years. 24.1% of residents were under the age of 18; 7.8% were between the ages of 18 and 24; 23.6% were from 25 to 44; 28.3% were from 45 to 64; and 16.1% were 65 years of age or older. The gender makeup of the city was 47.9% male and 52.1% female.
2000 census
As of the census[4] of 2000, there were 3,334 people, 1,275 households, and 882 families residing in the city. The population density was 738.3 people per square mile (284.8/km²). There were 1,414 housing units at an average density of 313.1 per square mile (120.8/km²). The racial makeup of the city was 72.56% White, 26.48% African American, 0.18% Native American, 0.30% Asian, 0.09% from other races, and 0.39% from two or more races. Hispanic or Latino of any race were 0.69% of the population.
There were 1,275 households out of which 35.5% had children under the age of 18 living with them, 45.8% were married couples living together, 21.0% had a female householder with no husband present, and 30.8% were non-families. 28.4% of all households were made up of individuals and 12.9% had someone living alone who was 65 years of age or older. The average household size was 2.47 and the average family size was 3.02.
In the city, the population was spread out with 28.2% under the age of 18, 8.7% from 18 to 24, 26.0% from 25 to 44, 21.8% from 45 to 64, and 15.4% who were 65 years of age or older. The median age was 36 years. For every 100 females, there were 87.7 males. For every 100 females age 18 and over, there were 79.5 males.
The median income for a household in the city was $27,422, and the median income for a family was $34,464. Males had a median income of $30,705 versus $21,045 for females. The per capita income for the city was $14,639. About 22.6% of families and 25.0% of the population were below the poverty line, including 36.9% of those under age 18 and 17.5% of those age 65 or over.
Government
See also
References
- 1 2 "US Gazetteer files 2010". United States Census Bureau. Archived from the original on 2012-01-24. Retrieved 2012-07-08.
- 1 2 "American FactFinder". United States Census Bureau. Retrieved 2012-07-08.
- 1 2 "Population and Housing Unit Estimates". Retrieved June 9, 2017.
- 1 2 "American FactFinder". United States Census Bureau. Retrieved 2008-01-31.
- ↑ "US Board on Geographic Names". United States Geological Survey. 2007-10-25. Retrieved 2008-01-31.
- ↑ Lynn Morrow, "New Madrid and its Hinterland: 1783-1826," Bulletin of the Missouri Historical Society (1980) 36#4 pp 241-250
- ↑ The series of earthquakes took place in December 1811 and January 1812. They created, among other land features, Reelfoot Lake. See Stewart and Knox, The earthquake that never went away, pp. 17–25.
- ↑ United States Geological Survey. "Historic Earthquakes". Retrieved 25 April 2008.
- 1 2 "A Black Minstrel Lynched in New Madrid, Missouri (1902)", This Cruel War blog, 16 February 2017; accessed 12 April 2018
- ↑ "Lynching in Missouri", Saline County, Missouri/MOGenWeb Project, 1996-2018; accessed 12 April 2018
- ↑ Williams, Walter (1904). The State of Missouri. p. 459.
- ↑ "Find a County". National Association of Counties. Retrieved 2011-06-07.
- ↑ "US Gazetteer files: 2010, 2000, and 1990". United States Census Bureau. 2011-02-12. Retrieved 2011-04-23.
- ↑ "Climatography of the United States No. 20, 1971-2000: New Madrid, MO" (PDF). National Oceanic and Atmospheric Administration. 2004. Retrieved on September 29, 2016.
- ↑ "NOW Data: NOAA Online Weather Data". National Weather Service Paducah Forecast Office. 2016. Retrieved on September 29, 2016.
- ↑ "Missouri Population 1900 - 1990" (PDF). Missouri Census Data Center. Archived from the original (CSV) on 4 July 2014. Retrieved 6 October 2014.
External links
- "New Madrid - 220+ Years Old and Counting". Retrieved 2014-11-01.
- Historic maps of New Madrid in the Sanborn Maps of Missouri Collection at the University of Missouri
Gallery
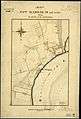 1865 map of New Madrid and Vicinity
Municipalities and communities of New Madrid County, Missouri, United States | ||
|---|---|---|
| Cities | 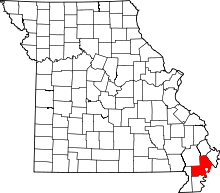 | |
| Village | ||
| Townships | ||
| Unincorporated communities | ||
| Ghost towns | ||
| Footnotes | ‡This populated place also has portions in an adjacent county or counties | |