Longueuil—Saint-Hubert
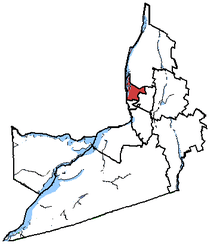 Longueuil—Pierre-Boucher in relation to other Montérégie federal electoral districts. | |||
| Federal electoral district | |||
| Legislature | House of Commons | ||
| MP |
New Democratic | ||
| District created | 1952 | ||
| First contested | 1953 | ||
| Last contested | 2015 | ||
| District webpage | profile, map | ||
| Demographics | |||
| Population (2011)[1] | 104,366 | ||
| Electors (2015) | 85,657 | ||
| Area (km²)[2] | 56 | ||
| Pop. density (per km²) | 1,863.7 | ||
| Census divisions | South Shore | ||
| Census subdivisions | Longueuil | ||
Longueuil—Saint-Hubert (formerly Longueuil—Pierre-Boucher and Longueuil) is a federal electoral district in Quebec, Canada, that has been represented in the House of Commons of Canada since 2004. Its population in 2001 was 96,403.[3]
Geography
This South Shore district in the Quebec region of Montérégie includes the eastern part of the City of Longueuil.
The neighbouring ridings are Longueuil—Charles-LeMoyne, Montarville, Pierre-Boucher—Les Patriotes—Verchères, La Pointe-de-l'Île, and Hochelaga.
Profile
This mainly Francophone riding is one of the NDP's safer seats on the South Shore. The NDP did well across the district, with the BQ coming in distant second for the most part. The Liberals and Conservatives did poorly in this riding, although the Liberals had a tiny pocket of somewhat strong support around Parc Michel-Chartrand. Despite winning the riding again in 2015, it was an extremely close contest. The Liberals surged into second place, just one point away from defeating the incumbent NDP candidate.
Demographics
- According to the Canada 2016 Census
- Twenty most common mother tongue languages (2016) : 83.5% French, 3.5% English, 3.1% Spanish, 2.1% Arabic, 1.0% Creole languages, 0.7% Romanian, 0.6% Farsi, 0.5% Portuguese, 0.5% Italian, 0.5% Russian, 0.5% Vietnamese, 0.4% Mandarin, 0.3% Kabyle, 0.2% Cantonese, 0.2% Greek, 0.1% Polish, 0.1% Ukrainian, 0.1% Bulgarian, 0.1% German, 0.1% Lao, 0.1% Wolof[4]
History
The electoral district was created as "Longueuil" in 1952 from parts of Chambly—Rouville and Châteauguay—Huntingdon—Laprairie ridings. It was renamed "Longueuil—Pierre-Boucher" in 2004.
This riding was largely replaced with "Longueuil—Saint-Hubert", losing territory to Pierre-Boucher—Les Patriotes—Verchères and gaining territory from Saint-Bruno—Saint-Hubert during the 2012 electoral redistribution.
Members of Parliament
This riding has elected the following Members of Parliament:
| Parliament | Years | Member | Party | |
|---|---|---|---|---|
| Longueuil Riding created from Chambly—Rouville and Châteauguay—Huntingdon—Laprairie |
||||
| 22nd | 1953–1957 | Auguste Vincent | Liberal | |
| 23rd | 1957–1958 | |||
| 24th | 1958–1962 | Pierre Sévigny | Progressive Conservative | |
| 25th | 1962–1963 | |||
| 26th | 1963–1965 | Jean-Pierre Côté | Liberal | |
| 27th | 1965–1968 | |||
| 28th | 1968–1972 | |||
| 29th | 1972–1974 | Jacques Olivier | ||
| 30th | 1974–1979 | |||
| 31st | 1979–1980 | |||
| 32nd | 1980–1984 | |||
| 33rd | 1984–1988 | Nic Leblanc | Progressive Conservative | |
| 34th | 1988–1990 | |||
| 1990–1993 | Bloc Québécois | |||
| 35th | 1993–1997 | |||
| 1997–1997 | Independent sovereigntist | |||
| 36th | 1997–2000 | Caroline St-Hilaire | Bloc Québécois | |
| 37th | 2000–2004 | |||
| Longueuil—Pierre-Boucher | ||||
| 38th | 2004–2006 | Caroline St-Hilaire | Bloc Québécois | |
| 39th | 2006–2008 | |||
| 40th | 2008–2011 | Jean Dorion | ||
| 41st | 2011–2015 | Pierre Nantel | New Democratic | |
| Longueuil—Saint-Hubert | ||||
| 42nd | 2015–Present | Pierre Nantel | New Democratic | |
Election results
Longueuil—Saint-Hubert, 2015–present
| Canadian federal election, 2015 | ||||||||
|---|---|---|---|---|---|---|---|---|
| Party | Candidate | Votes | % | ±% | Expenditures | |||
| New Democratic | Pierre Nantel | 18,171 | 31.22 | -18.79 | $41,956.98 | |||
| Liberal | Michael O'Grady | 17,468 | 30.01 | +19.92 | – | |||
| Bloc Québécois | Denis Trudel | 15,873 | 27.27 | -1.52 | – | |||
| Conservative | John Sedlak | 5,087 | 8.74 | +0.00 | $6,341.70 | |||
| Green | Casandra Poitras | 1,447 | 2.49 | +0.29 | – | |||
| Strength in Democracy | Affine Lwalalika | 153 | 0.26 | – | – | |||
| Total valid votes/Expense limit | 58,199 | 100.00 | $224,513.21 | |||||
| Total rejected ballots | 939 | 1.59 | – | |||||
| Turnout | 85,766 | 68.95 | – | |||||
| Eligible voters | 85,766 | |||||||
| New Democratic hold | Swing | -19.36 | ||||||
| Source: Elections Canada[5][6] | ||||||||
| 2011 federal election redistributed results[7] | |||
|---|---|---|---|
| Party | Vote | % | |
| New Democratic | 26,335 | 50.02 | |
| Bloc Québécois | 15,162 | 28.80 | |
| Liberal | 5,313 | 10.09 | |
| Conservative | 4,602 | 8.74 | |
| Green | 1,156 | 2.20 | |
| Others | 86 | 0.16 | |
Longueuil—Pierre-Boucher, 2004–2015
| Canadian federal election, 2011 | ||||||||
|---|---|---|---|---|---|---|---|---|
| Party | Candidate | Votes | % | ±% | Expenditures | |||
| New Democratic | Pierre Nantel | 27,119 | 51.93 | +37.9 | ||||
| Bloc Québécois | Jean Dorion | 14,181 | 27.16 | -18.9 | ||||
| Liberal | Kévan Falsafi | 5,321 | 10.19 | -11.6 | ||||
| Conservative | Richard Bélisle | 4,339 | 8.31 | -6.1 | ||||
| Green | Valérie St-Amant | 1,032 | 1.98 | -1.5 | ||||
| Marxist–Leninist | Serge Patenaude | 228 | 0.44 | +0.2 | ||||
| Total valid votes/Expense limit | 52,220 | 100.00 | ||||||
| Total rejected ballots | 650 | 1.23 | -0.11 | |||||
| Turnout | 52,870 | 67.24 | – | |||||
| Eligible voters | 78,629 | – | – | |||||
| New Democratic gain from Bloc Québécois | Swing | +28.4 | ||||||
| Canadian federal election, 2008 | ||||||||
|---|---|---|---|---|---|---|---|---|
| Party | Candidate | Votes | % | ±% | Expenditures | |||
| Bloc Québécois | Jean Dorion | 23,118 | 46.1 | -9.1 | $49,818 | |||
| Liberal | Ryan Hillier | 10,920 | 21.8 | +9.2 | $10,797 | |||
| Conservative | Jacques Bouchard | 7,210 | 14.4 | -4.4 | $55,552 | |||
| New Democratic | Lise St-Denis | 7,021 | 14.0 | +5.4 | $1,131 | |||
| Green | Danielle Moreau | 1,752 | 3.5 | -0.5 | ||||
| Marxist–Leninist | Serge Patenaude | 103 | 0.2 | – | ||||
| Total valid votes/Expense limit | 50,124 | 100.0 | $83,504 | |||||
| Total rejected ballots | 682 | 1.34 | ||||||
| Turnout | 50,806 | |||||||
| Canadian federal election, 2006 | ||||||||
|---|---|---|---|---|---|---|---|---|
| Party | Candidate | Votes | % | ±% | Expenditures | |||
| Bloc Québécois | Caroline St-Hilaire | 27,425 | 55.2 | -5.7 | $50,372 | |||
| Conservative | Sebastien Legris | 9,331 | 18.8 | +13.9 | $5,118 | |||
| Liberal | Lancine Diawara | 6,260 | 12.6 | -13.0 | $8,387 | |||
| New Democratic | Philippe Haese | 4,273 | 8.6 | +3.4 | $1,615 | |||
| Green | Adam Sommerfeld | 1,995 | 4.0 | +1.4 | ||||
| Marijuana | David Fiset | 397 | 0.8 | 0.0 | ||||
| Total valid votes/Expense limit | 49,681 | 100.0 | $78,130 | |||||
Longueuil, 1952–2004
| Canadian federal election, 2004 | ||||||||
|---|---|---|---|---|---|---|---|---|
| Party | Candidate | Votes | % | ±% | Expenditures | |||
| Bloc Québécois | Caroline St-Hilaire | 29,473 | 60.9 | +8.7 | $75,548 | |||
| Liberal | Robert Gladu | 12,363 | 25.6 | -7.0 | $61,710 | |||
| New Democratic | Nicole Fournier-Sylvester | 2,512 | 5.2 | +3.6 | $572 | |||
| Conservative | Richard Bélisle | 2,354 | 4.9 | -5.8 | $9,041 | |||
| Green | Michel Bédard | 1,263 | 2.6 | – | ||||
| Marijuana | David Fiset | 401 | 0.8 | -1.6 | ||||
| Total valid votes/Expense limit | 48,366 | 100.0 | $77,195 | |||||
Note: Conservative vote is compared to the total of the Canadian Alliance vote and Progressive Conservative vote in the 2000 election.
| Canadian federal election, 2000 | ||||||||
|---|---|---|---|---|---|---|---|---|
| Party | Candidate | Votes | % | ±% | ||||
| Bloc Québécois | Caroline St-Hilaire | 20,868 | 52.2 | +2.1 | ||||
| Liberal | Sophie Joncas | 12,991 | 32.5 | +3.3 | ||||
| Progressive Conservative | Richard Lafleur | 2,210 | 5.5 | -13.0 | ||||
| Alliance | Michel Minguy | 2,066 | 5.2 | |||||
| Marijuana | David Fiset | 968 | 2.4 | |||||
| New Democratic | Timothy Spurr | 655 | 1.6 | -0.4 | ||||
| Marxist–Leninist | Stephane Chénier | 183 | 0.5 | |||||
| Total valid votes | 39,941 | 100.0 | ||||||
| Canadian federal election, 1997 | ||||||||
|---|---|---|---|---|---|---|---|---|
| Party | Candidate | Votes | % | ±% | ||||
| Bloc Québécois | Caroline St-Hilaire | 20,977 | 50.1 | -15.6 | ||||
| Liberal | Carole Marcil | 12,247 | 29.3 | +4.5 | ||||
| Progressive Conservative | François Leduc | 7,773 | 18.6 | +11.1 | ||||
| New Democratic | Maurice Auzat | 857 | 2.0 | +0.4 | ||||
| Total valid votes | 41,854 | 100.0 | ||||||
| Canadian federal election, 1993 | ||||||||
|---|---|---|---|---|---|---|---|---|
| Party | Candidate | Votes | % | ±% | ||||
| Bloc Québécois | Nic Leblanc | 39,734 | 65.7 | |||||
| Liberal | Guy Chartrand | 14,955 | 24.7 | +2.1 | ||||
| Progressive Conservative | Richard Ledoux | 4,512 | 7.5 | -45.8 | ||||
| New Democratic | Sergio Martinez | 985 | 1.6 | -18.0 | ||||
| Commonwealth of Canada | Dany Lépine | 262 | 0.4 | +0.1 | ||||
| Total valid votes | 60,448 | 100.0 | ||||||
| Canadian federal election, 1988 | ||||||||
|---|---|---|---|---|---|---|---|---|
| Party | Candidate | Votes | % | ±% | ||||
| Progressive Conservative | Nic Leblanc | 29,054 | 53.3 | +5.5 | ||||
| Liberal | Michel Dupuy | 12,328 | 22.6 | -9.8 | ||||
| New Democratic | Daniel Senez | 10,681 | 19.6 | +9.0 | ||||
| Rhinoceros | Sylvie Legs Legault | 2,080 | 3.8 | -0.3 | ||||
| Independent | Serge Lachapelle | 233 | 0.4 | |||||
| Commonwealth of Canada | Louis Dubé | 163 | 0.3 | +0.2 | ||||
| Total valid votes | 54,539 | 100.0 | ||||||
| Canadian federal election, 1984 | ||||||||
|---|---|---|---|---|---|---|---|---|
| Party | Candidate | Votes | % | ±% | ||||
| Progressive Conservative | Nic Leblanc | 28,956 | 47.7 | +40.6 | ||||
| Liberal | Jacques Olivier | 19,654 | 32.4 | -36.6 | ||||
| New Democratic | Claire Gagnon | 6,401 | 10.6 | -2.4 | ||||
| Parti nationaliste | Denise Imbeau | 3,054 | 5.0 | |||||
| Rhinoceros | Robert Millet-Lynch dit Bagno | 2,523 | 4.2 | |||||
| Commonwealth of Canada | André Rouillard | 73 | 0.1 | |||||
| Total valid votes | 60,661 | 100.0 | ||||||
| Canadian federal election, 1980 | ||||||||
|---|---|---|---|---|---|---|---|---|
| Party | Candidate | Votes | % | ±% | ||||
| Liberal | Jacques Olivier | 32,755 | 69.0 | +7.7 | ||||
| New Democratic | Jean-Pierre Vaillancourt | 6,144 | 12.9 | +5.8 | ||||
| Progressive Conservative | Hélène Vaillancourt | 3,383 | 7.1 | -3.5 | ||||
| Rhinoceros | Jean-Marc Cornélius Brunet | 2,631 | 5.5 | +1.0 | ||||
| Social Credit | Joseph Roland Grandmaison | 1,688 | 3.6 | -11.1 | ||||
| Union populaire | Denise Imbeau-Cousineau | 362 | 0.8 | -0.6 | ||||
| Independent | Alain Saulnier | 204 | 0.4 | |||||
| Independent | Walter Lee Belyea | 164 | 0.3 | |||||
| Marxist–Leninist | Yves Boyer | 92 | 0.2 | -0.1 | ||||
| Communist | Hervé Fuyet | 73 | 0.2 | |||||
| Total valid votes | 47,496 | 100.0 | ||||||
| Canadian federal election, 1979 | ||||||||
|---|---|---|---|---|---|---|---|---|
| Party | Candidate | Votes | % | ±% | ||||
| Liberal | Jacques Olivier | 34,207 | 61.3 | +9.5 | ||||
| Social Credit | Robert S. Daoust | 8,173 | 14.6 | -1.2 | ||||
| Progressive Conservative | Georges Perrier | 5,952 | 10.7 | -5.5 | ||||
| New Democratic | Jean-Pierre Vaillancourt | 3,995 | 7.2 | -5.6 | ||||
| Rhinoceros | Simonne Monet Chartrand | 2,556 | 4.6 | |||||
| Union populaire | Louis Denoncourt | 764 | 1.4 | |||||
| Marxist–Leninist | Yves Boyer | 176 | 0.3 | -0.4 | ||||
| Total valid votes | 55,823 | 100.0 | ||||||
| Canadian federal election, 1974 | ||||||||
|---|---|---|---|---|---|---|---|---|
| Party | Candidate | Votes | % | ±% | ||||
| Liberal | Jacques Olivier | 24,500 | 51.8 | +7.2 | ||||
| Progressive Conservative | Noël Joanisse | 7,627 | 16.1 | +2.0 | ||||
| Social Credit | Fernand Bouffard | 7,490 | 15.8 | -8.5 | ||||
| New Democratic | Henri-François Gautrin | 6,042 | 12.8 | +3.6 | ||||
| Independent | Jacques Ferron | 1,110 | 2.3 | |||||
| Marxist–Leninist | Paul Lévesque | 357 | 0.8 | |||||
| Independent | G. Bed Valade | 163 | 0.3 | |||||
| Total valid votes | 47,289 | 100.0 | ||||||
| Canadian federal election, 1972 | ||||||||
|---|---|---|---|---|---|---|---|---|
| Party | Candidate | Votes | % | ±% | ||||
| Liberal | Jacques Olivier | 22,129 | 44.6 | -16.1 | ||||
| Social Credit | Emile-A. Vadeboncoeur | 12,091 | 24.4 | +18.0 | ||||
| Progressive Conservative | Marcel Robidas | 7,015 | 14.1 | -3.2 | ||||
| New Democratic | Robert Mansour | 4,548 | 9.2 | -4.4 | ||||
| Independent | Jacques Gendron | 2,020 | 4.1 | |||||
| Independent | Raoul Wéziwézô Duguay | 1,625 | 3.3 | |||||
| Independent | André Pesant | 170 | 0.3 | |||||
| Total valid votes | 49,598 | 100.0 | ||||||
Note: Social Credit vote is compared to Ralliement créditiste vote in the 1968 election.
| Canadian federal election, 1968 | ||||||||
|---|---|---|---|---|---|---|---|---|
| Party | Candidate | Votes | % | ±% | ||||
| Liberal | Jean-Pierre Coté | 19,080 | 60.7 | +4.7 | ||||
| Progressive Conservative | Raymond-J. Bériault | 5,448 | 17.3 | +3.6 | ||||
| New Democratic | Paul Ferron | 4,254 | 13.5 | -2.6 | ||||
| Ralliement créditiste | Joseph-A. Chénier | 2,023 | 6.4 | -7.7 | ||||
| Rhinoceros | Robert Charlebois | 354 | 1.1 | |||||
| Independent PC | Gaston Prévost | 281 | 0.9 | |||||
| Total valid votes | 31,440 | 100.0 | ||||||
| Canadian federal election, 1965 | ||||||||
|---|---|---|---|---|---|---|---|---|
| Party | Candidate | Votes | % | ±% | ||||
| Liberal | Jean-Pierre Coté | 21,578 | 56.0 | +15.4 | ||||
| New Democratic | Jeanne d'Arc Morin | 6,214 | 16.1 | +8.6 | ||||
| Ralliement créditiste | Joseph-A. Chénier | 5,456 | 14.2 | -4.1 | ||||
| Progressive Conservative | Rosaire Clavette | 5,286 | 13.7 | -19.9 | ||||
| Total valid votes | 38,534 | 100.0 | ||||||
Note: Ralliement créditiste vote is compared to Social Credit vote in the 1963 election.
| Canadian federal election, 1963 | ||||||||
|---|---|---|---|---|---|---|---|---|
| Party | Candidate | Votes | % | ±% | ||||
| Liberal | Jean-Pierre Coté | 17,223 | 40.6 | +3.6 | ||||
| Progressive Conservative | Pierre Sévigny | 14,269 | 33.6 | -10.6 | ||||
| Social Credit | Bruno Camirand | 7,735 | 18.2 | +7.7 | ||||
| New Democratic | Gérard Philipps | 3,208 | 7.6 | +1.2 | ||||
| Total valid votes | 42,435 | 100.0 | ||||||
| Canadian federal election, 1962 | ||||||||
|---|---|---|---|---|---|---|---|---|
| Party | Candidate | Votes | % | ±% | ||||
| Progressive Conservative | Pierre Sévigny | 17,578 | 44.3 | -5.6 | ||||
| Liberal | Auguste Vincent | 14,686 | 37.0 | -6.4 | ||||
| Social Credit | Adolphe Martin | 4,186 | 10.5 | |||||
| New Democratic | Réginald Lauzier | 2,518 | 6.3 | -0.4 | ||||
| Independent PC | Roch Ste-Marie | 381 | 1.0 | |||||
| Independent Liberal | Oliva Bédard | 358 | 0.9 | |||||
| Total valid votes | 39,707 | 100.0 | ||||||
Note: New Democratic Party vote is compared to Co-operative Commonwealth Federation vote in the 1958 election.
| Canadian federal election, 1958 | ||||||||
|---|---|---|---|---|---|---|---|---|
| Party | Candidate | Votes | % | ±% | ||||
| Progressive Conservative | Pierre Sévigny | 18,637 | 49.8 | +16.5 | ||||
| Liberal | Auguste Vincent | 16,238 | 43.4 | -15.5 | ||||
| Co-operative Commonwealth | Jacques Ferron | 2,529 | 6.8 | +1.4 | ||||
| Total valid votes | 37,404 | 100.0 | ||||||
| Canadian federal election, 1957 | ||||||||
|---|---|---|---|---|---|---|---|---|
| Party | Candidate | Votes | % | ±% | ||||
| Liberal | Auguste Vincent | 19,314 | 58.9 | -8.7 | ||||
| Progressive Conservative | Pierre Sévigny | 10,942 | 33.4 | +13.5 | ||||
| Co-operative Commonwealth | Michel Chartrand | 1,768 | 5.4 | -5.7 | ||||
| Independent PC | Oliva Bédard | 782 | 2.4 | |||||
| Total valid votes | 32,806 | 100.0 | ||||||
| Canadian federal election, 1953 | ||||||||
|---|---|---|---|---|---|---|---|---|
| Party | Candidate | Votes | % | |||||
| Liberal | Auguste Vincent | 16,688 | 67.6 | |||||
| Progressive Conservative | Georges-Joseph Valade | 4,912 | 19.9 | |||||
| Co-operative Commonwealth | J.-R. Michel Chartrand | 2,742 | 11.1 | |||||
| Labor–Progressive | Yvonne Bourget | 352 | 1.4 | |||||
| Total valid votes | 24,694 | 100.0 | ||||||
See also
References
- "(Code 24035) Census Profile". 2011 census. Statistics Canada. 2012. Retrieved 2011-03-07.
- Campaign expense data from Elections Canada
- Results from Elections Canada
- Riding history from the Library of Parliament
- Longueuil—Pierre-Boucher, Quebec (2004 - )
Notes
- ↑ Statistics Canada: 2012
- ↑ Statistics Canada: 2012
- ↑ http://www.parl.gc.ca/HousePublications/Publication.aspx?Language=E&Mode=1&DocId=6654879&File=4
- ↑ https://www12.statcan.gc.ca/census-recensement/2016/dp-pd/dt-td/Rp-eng.cfm?LANG=E&APATH=3&DETAIL=0&DIM=0&FL=A&FREE=0&GC=0&GID=0&GK=0&GRP=1&PID=109979&PRID=10&PTYPE=109445&S=0&SHOWALL=0&SUB=888&Temporal=2016,2017&THEME=118&VID=0&VNAMEE=&VNAMEF=
- ↑ Elections Canada – Confirmed candidates for Longueuil—Saint-Hubert, 30 September 2015
- ↑ Elections Canada – Preliminary Election Expenses Limits for Candidates Archived 2015-08-15 at the Wayback Machine.
- ↑ Pundits' Guide to Canadian Elections