Ohio's 12th congressional district
| Ohio's 12th congressional district | |
|---|---|
.tif.png) Ohio's 12th congressional district – since January 3, 2013. | |
| Current Representative | Troy Balderson (R–Zanesville) |
| Population (2016) | 758,614[1] |
| Median income | 63,046 |
| Ethnicity |
|
| Cook PVI | R+7[2] |
Ohio's 12th congressional district is a United States congressional district in central Ohio, covering Delaware County, Morrow County, and Licking County, along with parts of Franklin, Marion, Muskingum, and Richland counties.[3] The district includes communities north and east of Columbus including Zanesville, Mansfield, and Dublin.
On January 15, 2018, the district's representative Pat Tiberi resigned. A special election was held on August 7, 2018 to fill the vacancy for the remainder of Tiberi's term, which ends on November 6, 2018.[4] At the special election, the Republican candidate was Troy Balderson, who was endorsed by President Trump, and the Democratic candidate was Danny O’Connor. On August 24, Balderson was officially declared winner of the special election, which witnessed a significant swing away from the Republican Party.[5]
From 2003 to 2013 the district included eastern Columbus, including most of its heavily African-American neighborhoods. The district also took in most of its northern suburbs, including Westerville. It was one of two districts that split the capital, the other being the 15th District. For most of the time from the 1980s to the 2000s, it was considered to be less Republican than the 15th, in part due to its large black population. However, redistricting after the 2010 census drew nearly all of the 15th's black constituents into the 3rd District, while the 15th was pushed into more exurban and Republican areas north and east of the capital.
It has been in Republican hands since 1920, except for an eight-year stretch in the 1930s and a two-year term in 1980 where the Democratic Party held the seat; in both instances the Democratic incumbent was later defeated by a GOP politician. In the 2004 presidential election George W. Bush narrowly won the district against John Kerry, 51% to 49%.[6] However, in the 2008 presidential election, Democratic candidate Barack Obama won the 12th district by a margin of 53% to 46%. After the 2011 redistricting cycle, the district has since been won in larger margins by Republican presidential candidates.[7]
List of representatives
| Representative | Party | Congress(es) | Year(s) | Electoral history |
|---|---|---|---|---|
| District created March 4, 1823 | ||||
 John Sloane |
Adams-Clay D-R | 18th | March 4, 1823 – March 3, 1825 |
Redistricted from the 6th district |
| Adams | 19th 20th |
March 4, 1825 – March 3, 1829 | ||
| John Thomson | Jacksonian | 21st 22nd |
March 4, 1829 – March 3, 1833 |
Redistricted to the 17th district |
| Robert Mitchell | Jacksonian | 23rd | March 4, 1833 – March 3, 1835 |
[Data unknown/missing.] |
| Elias Howell | Anti-Jacksonian | 24th | March 4, 1835 – March 3, 1837 |
[Data unknown/missing.] |
| Alexander Harper | Whig | 25th | March 4, 1837 – March 3, 1839 |
[Data unknown/missing.] |
_001.png) Jonathan Taylor |
Democratic | 26th | March 4, 1839 – March 3, 1841 |
[Data unknown/missing.] |
| Joshua Mathiot | Whig | 27th | March 4, 1841 – March 3, 1843 |
[Data unknown/missing.] |
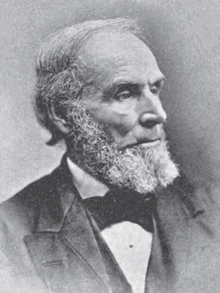
 Samuel Finley Vinton |
Whig | 28th 29th 30th 31st |
March 4, 1843 – March 3, 1851 |
[Data unknown/missing.] |
 John Welch |
Whig | 32nd | March 4, 1851 – March 3, 1853 |
[Data unknown/missing.] |
 Edson B. Olds |
Democratic | 33rd | March 4, 1853 – March 3, 1855 |
Redistricted from the 9th district |
 Samuel Galloway |
Opposition | 34th | March 4, 1855 – March 3, 1857 |
[Data unknown/missing.] |
 Samuel S. Cox |
Democratic | 35th 36th 37th |
March 4, 1857 – March 3, 1863 |
Redistricted to the 7th district |
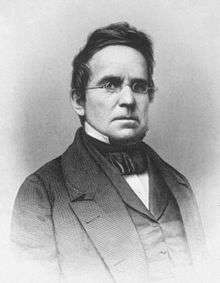
 William E. Finck |
Democratic | 38th 39th |
March 4, 1863 – March 3, 1867 |
[Data unknown/missing.] |
 Philadelph Van Trump |
Democratic | 40th 41st 42nd |
March 4, 1867 – March 3, 1873 |
[Data unknown/missing.] |
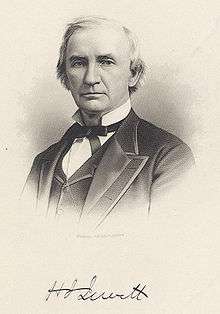 Hugh J. Jewett |
Democratic | 43rd | March 4, 1873 – June 23, 1874 |
Resigned to become President of the Erie Railroad |
 William E. Finck |
Democratic | 43rd | December 7, 1874 – March 3, 1875 |
[Data unknown/missing.] |
 Ansel T. Walling |
Democratic | 44th | March 4, 1875 – March 3, 1877 |
[Data unknown/missing.] |
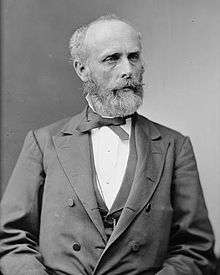
 Thomas Ewing, Jr. |
Democratic | 45th | March 4, 1877 – March 3, 1879 |
Redistricted to the 10th district |
 Henry S. Neal |
Republican | 46th | March 4, 1879 – March 3, 1881 |
Redistricted from the 11th district, Redistricted to the 11th district |
 George L. Converse |
Democratic | 47th | March 4, 1881 – March 3, 1883 |
Redistricted from the 9th district, Redistricted to the 13th district |
 Alphonso Hart |
Republican | 48th | March 4, 1883 – March 3, 1885 |
[Data unknown/missing.] |
 Albert C. Thompson |
Republican | 49th | March 4, 1885 – March 3, 1887 |
Redistricted to the 11th district |
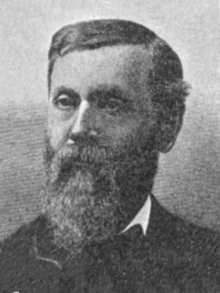
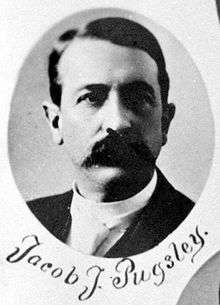 Jacob J. Pugsley |
Republican | 50th 51st |
March 4, 1887 – March 3, 1891 |
[Data unknown/missing.] |
 William H. Enochs |
Republican | 52nd | March 4, 1891 – March 3, 1893 |
Redistricted to the 10th district |
 Joseph H. Outhwaite |
Democratic | 53rd | March 4, 1893 – March 3, 1895 |
Redistricted from the 9th district |
 David K. Watson |
Republican | 54th | March 4, 1895 – March 3, 1897 |
[Data unknown/missing.] |
 John J. Lentz |
Democratic | 55th 56th |
March 4, 1897 – March 3, 1901 |
[Data unknown/missing.] |
 Emmett Tompkins |
Republican | 57th | March 4, 1901 – March 3, 1903 |
[Data unknown/missing.] |
 De Witt C. Badger |
Democratic | 58th | March 4, 1903 – March 3, 1905 |
[Data unknown/missing.] |
 Edward L. Taylor, Jr. |
Republican | 59th 60th 61st 62nd |
March 4, 1905 – March 3, 1913 |
[Data unknown/missing.] |
.png) Clement L. Brumbaugh |
Democratic | 63rd 64th 65th 66th |
March 4, 1913 – March 3, 1921 |
[Data unknown/missing.] |
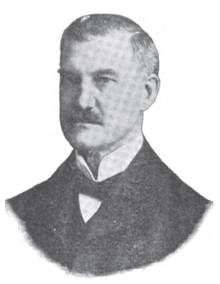
 John C. Speaks |
Republican | 67th 68th 69th 70th 71st |
March 4, 1921 – March 3, 1931 |
[Data unknown/missing.] |
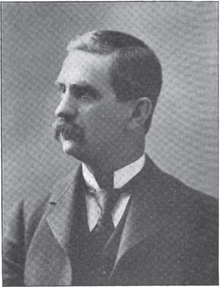
.jpg) Arthur P. Lamneck |
Democratic | 72nd 73rd 74th 75th |
March 4, 1931 – January 3, 1939 |
[Data unknown/missing.] |
 John M. Vorys |
Republican | 76th 77th 78th 79th 80th 81st 82nd 83rd 84th 85th |
January 3, 1939 – January 3, 1959 |
[Data unknown/missing.] |
 Samuel L. Devine |
Republican | 86th 87th 88th 89th 90th 91st 92nd 93rd 94th 95th 96th |
January 3, 1959 – January 3, 1981 |
[Data unknown/missing.] |
 Bob Shamansky |
Democratic | 97th | January 3, 1981 – January 3, 1983 |
Lost re-election. |
 John Kasich |
Republican | 98th 99th 100th 101st 102nd 103rd 104th 105th 106th |
January 3, 1983 – January 3, 2001 |
First elected in 1982. Re-elected in 1984. Re-elected in 1986. Re-elected in 1988. Re-elected in 1990. Re-elected in 1992. Re-elected in 1994. Re-elected in 1996. Re-elected in 1998. Retired to run for U.S. President. |
 Pat Tiberi |
Republican | 107th 108th 109th 110th 111th 112th 113th 114th 115th |
January 3, 2001 – January 15, 2018 |
First elected in 2000. Re-elected in 2002. Re-elected in 2004. Re-elected in 2006. Re-elected in 2008. Re-elected in 2010. Re-elected in 2012. Re-elected in 2014. Re-elected in 2016. Resigned to lead the Ohio Business Roundtable.[8] |
| Vacant | 115th | January 15, 2018 – August 7, 2018 | ||
.jpg) Troy Balderson |
Republican | 115th | August 7, 2018[9] – Present |
Elected to finish Tiberi's term. |
Recent election results
The following chart shows historic election results.
| Year | Democratic | Republican | Other |
|---|---|---|---|
| 1920 | Arthur P. Lamneck: 43,845 | √ John C. Speaks: 62,247 | Enoch B. Eubanks: 1,481 |
| 1922 | H. Sage Valentine: 37,875 | √ John C. Speaks (Incumbent): 47,265 | William Garminden (SL): 632 |
| 1924 | Lowry F. Sater: 41,291 | √ John C. Speaks (Incumbent): 58,705 | |
| 1926 | H. S. Atkinson: 31,724 | √ John C. Speaks (Incumbent): 41,119 | |
| 1928 | Carl H. Valentine: 50,216 | √ John C. Speaks (Incumbent): 82,574 | |
| 1930 | √ Arthur P. Lamneck: 59,330 | John C. Speaks (Incumbent): 43,840 | |
| 1932 | √ Arthur P. Lamneck (Incumbent): 63,135 | John C. Speaks: 62,704 | |
| 1934 | √ Arthur P. Lamneck (Incumbent): 63,396 | John C. Speaks: 50,386 | |
| 1936 | √ Arthur P. Lamneck (Incumbent): 88,222 | Grant P. Ward: 64,766 | |
| 1938 | Arthur P. Lamneck (Incumbent): 62,026 | √ Jonn M. Vorys: 64,409 | |
| 1940 | Arthur P. Lamneck: 87,115 | √ John M. Vorys (Incumbent): 91,767 | |
| 1942 | Arthur P. Lamneck: 40,290 | √ John M. Vorys (Incumbent): 56,558 | |
| 1944 | Forrest F. Smith: 82,503 | √ John M. Vorys (Incumbent): 97,856 | |
| 1946 | Arthur P. Lamneck: 45,779 | √ John M. Vorys (Incumbent): 74,691 | |
| 1948 | Robert M. Draper: 87,770 | √ John M. Vorys (Incumbent): 95,575 | |
| 1950 | John W. Guy: 65,860 | √ John M. Vorys (Incumbent): 117,396 | |
| 1952 | George T. Tarbutton: 81,665 | √ John M. Vorys (Incumbent): 134,693 | |
| 1954 | Jacob F. Myers: 59,210 | √ John M. Vorys (Incumbent): 94,585 | |
| 1956 | Walter J. Shapter Jr.: 79,597 | √ John M. Vorys (Incumbent): 128,682 | |
| 1958 | Walter J. Shapter Jr.: 84,470 | √ Samuel L. Devine: 100,684 | |
| 1960 | Richard E. Liming: 90,894 | √ Samuel L. Devine (Incumbent): 140,236 | |
| 1962 | Paul D. Cassidy: 60,563 | √ Samuel L. Devine (Incumbent): 130,316 | |
| 1964 | Robert L. Van Heyde: 118,299 | √ Samuel L. Devine (Incumbent): 146,971 | |
| 1966 | Bob Shamansky: 39,140 | √ Samuel L. Devine (Incumbent): 70,102 | |
| 1968 | Herbert J. Pfeifer: 51,202 | √ Samuel L. Devine (Incumbent): 106,664 | |
| 1970 | James W. Goodrich: 60,538 | √ Samuel L. Devine (Incumbent): 82,486 | |
| 1972 | James W. Goodrich: 81,074 | √ Samuel L. Devine (Incumbent): 103,655 | |
| 1974 | Francine Ryan: 70,818 | √ Samuel L. Devine (Incumbent): 73,303 | |
| 1976 | Francine Ryan: 89,424 | √ Samuel L. Devine (Incumbent): 90,987 | William Roger "Bill" Moss (I): 15,429 |
| 1978 | James L. Baumann: 61,698 | √ Samuel L. Devine (Incumbent): 81,573 | |
| 1980 | √ Bob Shamansky: 108,690 | Samuel L. Devine (Incumbent): 98,110 | |
| 1982 | Bob Shamansky (Incumbent): 82,753 | √ John Kasich: 88,335 | Russell A. Lewis (L): 3,939 |
| 1984 | Richard S. Sloan: 65,215 | √ John Kasich (Incumbent): 148,899 | |
| 1986 | Timothy C. Jochim: 42,727 | √ John Kasich (Incumbent): 117,905 | |
| 1988 | Mark P. Brown: 50,782 | √ John Kasich (Incumbent): 204,892 | |
| 1990 | Mike Gelpi: 50,784 | √ John Kasich (Incumbent): 130,495 | |
| 1992 | Bob Fitrakis: 68,761 | √ John Kasich (Incumbent): 170,297 | |
| 1994 | Cynthia L. Ruccia: 57,294 | √ John Kasich (Incumbent): 114,608 | |
| 1996 | Cynthia L. Ruccia: 78,762 | √ John Kasich (Incumbent): 151,667 | Barbara Ann Edelman (N): 7,005 |
| 1998 | Edward S. Brown: 60,694 | √ John Kasich (Incumbent): 124,197 | |
| 2000 | Maryellen O'Shaughnessy: 115,432 | √ Pat Tiberi: 139,242 | Charles Ed Jordan: 1,566 Nick Hogan (L): 4,546 Gregory B. Richey (N): 2,600 |
| 2002 | Edward S. Brown: 64,707 | √ Pat Tiberi (Incumbent): 116,982 | |
| 2004 | Edward S. Brown: 122,109 | √ Pat Tiberi (Incumbent): 198,912 | |
| 2006 | Robert N. Shamansky: 126,573 | √ Pat Tiberi (Incumbent): 198,723 | |
| 2008[10] | David Robinson: 152,234 | √ Pat Tiberi (Incumbent): 197,447 | Steven Linnabary (L): 10,707 |
| 2010[11] | Paula Brooks: 110,307 | √ Pat Tiberi (Incumbent): 150,163 | Travis Irvine (L): 8,710 |
| 2012[12] | Jim Reese: 134,614 | √ Pat Tiberi (Incumbent): 233,874 | |
| 2014[13] | David Tibbs: 61,360 | √ Pat Tiberi (Incumbent): 150,573 | Bob Hart (G): 9,148 |
| 2016[14] | Ed Albertson: 112, 638 | √ Pat Tiberi (Incumbent): 251,266 | Joe Manchik (G): 13,474
Write-in: 156 |
| 2018 (Special)[15] | Danny O'Connor: 102,648 | √ Troy Balderson: 104,328 | Joe Manchik (G): 1,165 |
Historical district boundaries

See also
References
- ↑ Bureau, Center for New Media & Promotion (CNMP), US Census. "My Congressional District". www.census.gov. Retrieved 8 August 2018.
- ↑ "Partisan Voting Index – Districts of the 115th Congress" (PDF). The Cook Political Report. April 7, 2017. Retrieved April 7, 2017.
- ↑ "Ohio's 12th Congressional District". Ballotpedia. Retrieved 2018-07-27.
- ↑ Ludlow, Randy (January 5, 2018). "Kasich sets primary for Tiberi seat for May 8; special election on Aug. 7". The Columbus Dispatch. Retrieved January 11, 2018.
- ↑ Republican declared winner in closely contested Ohio congressional race
- ↑ "Presidential Results by Congressional District, 2000-2008". Swing State Project. 2008-12-15. Archived from the original on 2009-03-05. Retrieved 2009-03-26.
- ↑ "Daily Kos Elections' presidential results by congressional district for 2016, 2012, 2008".
- ↑ Evans, Nick. "Pat Tiberi Confident Ohio's 12th District Will Remain Republican". Retrieved 8 August 2018.
- ↑ http://bioguide.congress.gov/scripts/biodisplay.pl?index=B001306
- ↑ Federal Elections 2008. Federal Elections Commission, Washington DC, July 2009
- ↑ 2010 Election Results Archived copy at the Library of Congress (November 9, 2011)., Ohio Secretary of State, Retrieved December 17, 2010
- ↑ "2012 Election Results". Ohio Secretary of State.
- ↑ "2014 Elections Results - Ohio Secretary of State". www.sos.state.oh.us. Retrieved 2018-03-17.
- ↑ "2016 Official Elections Results - Ohio Secretary of State". www.sos.state.oh.us. Retrieved 2018-03-17.
- ↑ "Official Results - Most Populous - Summary" (PDF). Franklin County Board of Elections. Retrieved August 26, 2018.
- Martis, Kenneth C. (1989). The Historical Atlas of Political Parties in the United States Congress. New York: Macmillan Publishing Company.
- Martis, Kenneth C. (1982). The Historical Atlas of United States Congressional Districts. New York: Macmillan Publishing Company.
- Congressional Biographical Directory of the United States 1774–present
Coordinates: 40°14′22″N 82°36′49″W / 40.23944°N 82.61361°W