Dulwich and West Norwood (UK Parliament constituency)
| Dulwich and West Norwood | |
|---|---|
|
Borough constituency for the House of Commons | |
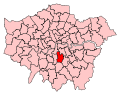 Boundary of Dulwich and West Norwood in Greater London. | |
| County | Greater London |
| Electorate | 71,523 (December 2010)[1] |
| Major settlements | Herne Hill, Dulwich, Brixton, Gipsy Hill, West Norwood |
| Current constituency | |
| Created | 1997 |
| Member of parliament | Helen Hayes (Labour) |
| Number of members | One |
| Created from | Dulwich and Norwood |
| Overlaps | |
| European Parliament constituency | London |
Dulwich and West Norwood /ˈdʌlɪtʃ ...
Boundaries
1997–2010: The London Borough of Southwark wards of Alleyn, Bellenden, College, Lyndhurst, Ruskin, and Rye, and the London Borough of Lambeth wards of Gipsy Hill, Herne Hill, Knight's Hill, and Thurlow Park.
2010–present: The London Borough of Southwark wards of College, East Dulwich, and Village, and the London Borough of Lambeth wards of Coldharbour, Gipsy Hill, Herne Hill, and Thurlow Park.

Constituency profile
Situated in south London is the seat of Dulwich and West Norwood. Traversed by the South Circular Road, one side of which there is Dulwich Village, and on the other side are Angell Town, and Coldharbour.
The seat is ethnically diverse: around 25% of the population are from an Afro-Caribbean background, while about 33% of the total population live in social housing; roughly 10% are lone parents. The constituency has the 15th highest proportion of people with a degree in the country at 47.6%.
Political history
The Labour Party majorities won have been in the safe order of more than 15% since the seat's 1997 creation. The runner-up party in four of the six elections to date has been the Conservative Party, otherwise the Liberal Democrats.
A Principal Speaker of the Green Party, Jenny Jones stood in the seat in 2001 and 2005.
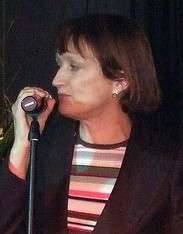
Before 1997 the forerunner seats of Norwood and Dulwich were won by Labour candidates, the latter being Tessa Jowell; the last other party win in either was the 1987 win in the Dulwich seat of Gerald Francis Bowden, Conservative, by 0.5% of the vote, having won a 4.9% majority in the 1983 landslide.
Members of Parliament
The constituency was created in 1997 from parts of the former seats of Dulwich and Norwood. It was represented from its creation until 2015 by the former Secretary of State for Culture (2001–2007), Tessa Jowell.
| Election | Member[2] | Party | |
|---|---|---|---|
| 1997 | Tessa Jowell | Labour | |
| 2015 | Helen Hayes | Labour | |
Election results
Elections in the 2010s
| Party | Candidate | Votes | % | ± | |
|---|---|---|---|---|---|
| Labour | Helen Hayes | 39,096 | 69.6 | +15.5 | |
| Conservative | Rachel Wolf [5] | 10,940 | 19.5 | -3.2 | |
| Liberal Democrat | Gail Kent | 4,475 | 8.0 | -1.8 | |
| Green | Rashid Nix | 1,408 | 2.5 | -6.9 | |
| Independent | Robin Lambert | 121 | 0.2 | 0.0 | |
| Independent | Yen Chong | 103 | 0.2 | N/A | |
| Majority | 28,156 | 50.1 | +18.7 | ||
| Turnout | 55,143 | 71.9 | +4.8 | ||
| Registered electors | 78,037 | ||||
| Labour hold | Swing | +9.3 | |||
| Party | Candidate | Votes | % | ± | |
|---|---|---|---|---|---|
| Labour | Helen Hayes | 27,772 | 54.1 | +7.5 | |
| Conservative | Resham Kotecha | 11,650 | 22.7 | +0.5 | |
| Liberal Democrat | James Barber | 5,055 | 9.8 | -17.3 | |
| Green | Rashid Nix | 4,844 | 9.4 | +6.8 | |
| UKIP | Rathy Alagaratnam | 1,606 | 3.1 | +1.7 | |
| TUSC | Steve Nally | 248 | 0.5 | N/A | |
| Independent | Robin Lambert | 125 | 0.2 | N/A | |
| All People's Party | Amadu Kanumansa | 62 | 0.1 | N/A | |
| Majority | 16,122 | 31.4 | +12.0 | ||
| Turnout | 51,362 | 67.1 | +0.9 | ||
| Registered electors | 76,575 | ||||
| Labour hold | Swing | +3.5 | |||
| Party | Candidate | Votes | % | ± | |
|---|---|---|---|---|---|
| Labour | Tessa Jowell | 22,461 | 46.6 | -2.3 | |
| Liberal Democrat | Jonathan Mitchell | 13,096 | 27.2 | +6.1 | |
| Conservative | Kemi Badenoch | 10,684 | 22.2 | +1.3 | |
| Green | Shane Collins | 1,266 | 2.6 | -3.7 | |
| UKIP | Elizabeth Jones | 707 | 1.5 | +0.7 | |
| Majority | 9,365 | 19.4 | -0.3 | ||
| Turnout | 48,214 | 66.2 | +9.3 | ||
| Registered electors | 72,817 | ||||
| Labour hold | Swing | -0.8 | |||
Elections of the 2000s
| Party | Candidate | Votes | % | ± | |
|---|---|---|---|---|---|
| Labour | Tessa Jowell | 19,059 | 45.4 | -9.5 | |
| Liberal Democrat | Jonathan Mitchell | 10,252 | 24.4 | +9.2 | |
| Conservative | Kim Humphreys | 9,200 | 21.9 | -0.8 | |
| Green | Jenny Jones | 2,741 | 6.5 | +1.5 | |
| UKIP | Ralph Atkinson | 290 | 0.7 | N/A | |
| Veritas | David Heather | 241 | 0.6 | N/A | |
| Socialist Labour | Amanda Rose | 149 | 0.4 | N/A | |
| For Integrity And Trust In Government | Judy Weleminsky | 57 | 0.1 | N/A | |
| Majority | 8,807 | 21.0 | -11.2 | ||
| Turnout | 41,989 | 58.1 | +4.7 | ||
| Registered electors | 73,710 | ||||
| Labour hold | Swing | -9.4 | |||
| Party | Candidate | Votes | % | ± | |
|---|---|---|---|---|---|
| Labour | Tessa Jowell | 20,999 | 54.9 | −6.1 | |
| Conservative | Nicholas Vineall | 8,689 | 22.7 | −1.5 | |
| Liberal Democrat | Caroline Pidgeon | 5,805 | 15.2 | +4.4 | |
| Green | Jenny Jones | 1,914 | 5.0 | N/A | |
| Socialist Alliance | Brian Kelly | 839 | 2.2 | N/A | |
| Majority | 12,310 | 32.2 | -4.6 | ||
| Turnout | 38,246 | 53.4 | −11.6 | ||
| Registered electors | 71,261 | ||||
| Labour hold | Swing | -2.3 | |||
Elections of the 1990s
| Party | Candidate | Votes | % | ± | |
|---|---|---|---|---|---|
| Labour | Tessa Jowell | 27,807 | 61.0 | N/A | |
| Conservative | Roger Gough | 11,038 | 24.2 | N/A | |
| Liberal Democrat | Susan Kramer | 4,916 | 10.8 | N/A | |
| Referendum | Bruce Coles | 897 | 2.0 | N/A | |
| Liberal | Alex Goldie | 587 | 1.3 | N/A | |
| Rainbow Dream Ticket | David Goodman | 173 | 0.4 | N/A | |
| UKIP | Eddie Pike | 159 | 0.3 | N/A | |
| Rizz Party | Captain Rizz | 38 | 0.1 | N/A | |
| Majority | 16,769 | 36.8 | N/A | ||
| Turnout | 45,615 | 65.5 | N/A | ||
| Registered electors | 70,203 | ||||
| Labour win (new seat) | |||||
See also
References
- Notes
- References
- ↑ "Electorate Figures - Boundary Commission for England". 2011 Electorate Figures. Boundary Commission for England. 4 March 2011. Archived from the original on 6 November 2010. Retrieved 13 March 2011.
- ↑ Leigh Rayment's Historical List of MPs – Constituencies beginning with "D" (part 3)
- ↑ "Dulwich & West Norwood parliamentary constituency". BBC News.
- ↑ http://researchbriefings.files.parliament.uk/documents/CBP-7979/CBP-7979.pdf
- ↑ https://inews.co.uk/news/politics/conservative-candidates-running-mps-2017-general-election/
- ↑ "Election Data 2015". Electoral Calculus. Archived from the original on 17 October 2015. Retrieved 17 October 2015.
- ↑ http://moderngov.lambeth.gov.uk/mgElectionAreaResults.aspx?XXR=0&ID=137&RPID=26942154 23Jul15
- ↑ https://www.bbc.co.uk/news/politics/constituencies/E14000673
- ↑ "Election Data 2010". Electoral Calculus. Archived from the original on 26 July 2013. Retrieved 17 October 2015.
- ↑ BBC News http://news.bbc.co.uk/nol/shared/election2010/results/constituency/b45.stm. Missing or empty
|title=(help) - ↑ "Election Data 2005". Electoral Calculus. Archived from the original on 15 October 2011. Retrieved 18 October 2015.
- ↑ "Election Data 2001". Electoral Calculus. Archived from the original on 15 October 2011. Retrieved 18 October 2015.
- ↑ "Election Data 1997". Electoral Calculus. Archived from the original on 15 October 2011. Retrieved 18 October 2015.
External links
- Politics Resources (Election results from 1922 onwards)
- Electoral Calculus (Election results from 1955 onwards)