Climate of the United Kingdom
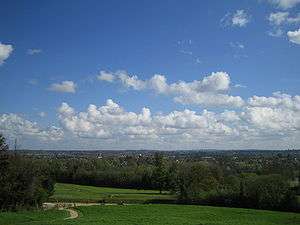
The United Kingdom straddles the higher mid-latitudes between 49° and 61° N. It is on the western seaboard of Afro-Eurasia, the world's largest land mass. Since the UK is always in or close to the path of the polar front jet stream, frequent changes in pressure and unsettled weather are typical. Many types of weather can be experienced in a single day. In general the climate of the UK is cool and often cloudy, and high temperatures are infrequent.
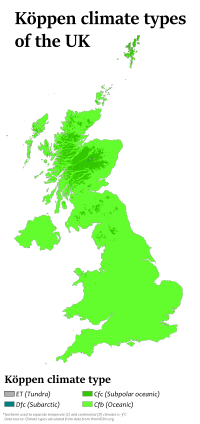
The climate in the United Kingdom is defined as a temperate oceanic climate, or Cfb on the Köppen climate classification system, a classification it shares with most of north-west Europe.[1] Regional climates are influenced by the Atlantic Ocean and latitude. Northern Ireland, Wales and western parts of England and Scotland, being closest to the Atlantic Ocean, are generally the mildest, wettest and windiest regions of the UK, and temperature ranges here are seldom extreme. Eastern areas are drier, cooler, and less windy, and also experience the greatest daily and seasonal temperature variations. Northern areas are generally cooler and wetter, and have slightly larger temperature ranges than southern areas.
The UK is mostly under the influence of the maritime polar air mass from the north-west. Northern Ireland and the west of Scotland are the most exposed to the maritime polar air mass which brings cool moist air; the east of Scotland and north-east England are more exposed to the continental polar air mass which brings cold dry air. The south and south-east of England are the least exposed to polar air masses from the north-west, and on occasion see continental tropical air masses from the south, which bring warm dry air in the summer. On average, the temperature ranges from 25-18 degrees.
If the air masses are strong enough in their respective areas during the summer, there can sometimes be a large difference in temperature between the far north of Scotland (including its islands) and the south-east of England – often a difference of 10–15 °C (18-27 °F) but sometimes as much as 20 °C (36 °F) or more. In the height of summer the Northern Isles could have temperatures around 15 °C (59 °F) and areas around London could reach 30 °C (86 °F).
England
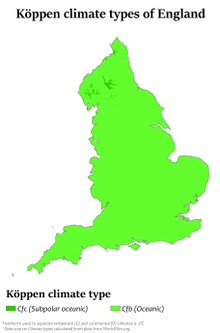
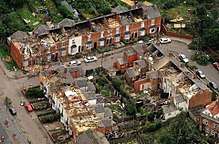
England generally has higher maximum and minimum temperatures than the other areas of the UK, though Wales has higher minima from November to February, and Northern Ireland has higher maxima from December to February. England is also sunnier throughout the year, but unlike Wales, Northern Ireland and Scotland, the sunniest month is July, with an avergae of 193.5 hours. It rains on fewer days in every month throughout the year than the rest of the UK, and rainfall totals are less in every month, with the driest month, May, averaging 58.4 mm (2.30 in).[2] The climate of south-west England displays a seasonal temperature variation, although it is less extreme than most of the United Kingdom. Gales are less common in England compared to Scotland; however on some occasions there can be strong winds, and rarely, the remains of Atlantic hurricanes and tropical storms. Some events such as the Great Storm of 1987 occurred near to the UK and caused damage in England. The prevailing wind direction for England is from the south-west.
| England weather averages | ||||||||||||||
|---|---|---|---|---|---|---|---|---|---|---|---|---|---|---|
| Month | Jan | Feb | Mar | Apr | May | Jun | Jul | Aug | Sep | Oct | Nov | Dec | Year | |
| Average maximum temperature °C (°F) |
6.4 (43.5) |
6.6 (43.9) |
9.1 (48.4) |
11.8 (53.2) |
15.6 (60.1) |
18.6 (65.5) |
20.4 (68.7) |
20.1 (68.2) |
17.5 (63.5) |
14.0 (57.2) |
9.4 (48.9) |
7.3 (45.1) |
13.1 (55.6) | |
| Average minimum temperature °C (°F) |
1.2 (34.2) |
0.9 (33.6) |
2.0 (35.6) |
3.9 (39.0) |
6.8 (44.2) |
9.7 (49.5) |
11.7 (53.1) |
11.5 (52.7) |
9.6 (49.3) |
7.2 (44.5) |
3.6 (38.5) |
2.0 (35.6) |
5.9 (42.6) | |
| Sunshine hours |
54.2 | 74.3 | 107.6 | 155.2 | 190.6 | 182.6 | 193.5 | 182.5 | 137.2 | 103.1 | 64.5 | 47.3 | 1492.7 | |
| Rainfall mm (inches) |
82.9 (3.3) |
60.3 (2.4) |
64.0 (2.5) |
58.7 (2.3) |
58.4 (2.3) |
61.8 (2.4) |
62.6 (2.5) |
69.3 (2.7) |
69.7 (2.7) |
91.7 (3.6) |
88.2 (3.5) |
87.2 (3.4) |
854.8 (33.7) | |
| Rainfall ≥ 1 mm days |
13.2 | 10.4 | 11.5 | 10.4 | 9.9 | 9.6 | 9.5 | 9.9 | 9.9 | 12.6 | 13.1 | 12.7 | 132.8 | |
| Source: Met Office[2] (1981–2010 averages) | ||||||||||||||
| Climate data for England | |||||||||||||
|---|---|---|---|---|---|---|---|---|---|---|---|---|---|
| Month | Jan | Feb | Mar | Apr | May | Jun | Jul | Aug | Sep | Oct | Nov | Dec | Year |
| Record high °C (°F) | 17.6 (63.7) |
19.7 (67.5) |
25.6 (78.1) |
29.4 (84.9) |
32.8 (91) |
35.6 (96.1) |
36.7 (98.1) |
38.5 (101.3) |
35.6 (96.1) |
29.9 (85.8) |
21.1 (70) |
17.7 (63.9) |
38.5 (101.3) |
| Record low °C (°F) | −26.1 (−15) |
−20.6 (−5.1) |
−21.1 (−6) |
−15.0 (5) |
−9.4 (15.1) |
−5.6 (21.9) |
−1.7 (28.9) |
−2.0 (28.4) |
−5.6 (21.9) |
−10.6 (12.9) |
−15.5 (4.1) |
−25.2 (−13.4) |
−26.1 (−15) |
| Source: The Met Office[3] | |||||||||||||
The highest temperature recorded in England occurred on 10 August 2003 in Faversham, Kent. The lowest temperature ever recorded in England occurred on 10 January 1982 in Newport, Shropshire.
| Climate data for Sheffield | |||||||||||||
|---|---|---|---|---|---|---|---|---|---|---|---|---|---|
| Month | Jan | Feb | Mar | Apr | May | Jun | Jul | Aug | Sep | Oct | Nov | Dec | Year |
| Average high °C (°F) | 6.4 (43.5) |
6.7 (44.1) |
9.3 (48.7) |
11.8 (53.2) |
15.7 (60.3) |
18.3 (64.9) |
20.8 (69.4) |
20.6 (69.1) |
17.3 (63.1) |
13.3 (55.9) |
9.2 (48.6) |
7.2 (45) |
13.1 (55.6) |
| Average low °C (°F) | 1.6 (34.9) |
1.6 (34.9) |
3.1 (37.6) |
4.4 (39.9) |
7.0 (44.6) |
10.0 (50) |
12.4 (54.3) |
12.1 (53.8) |
10.0 (50) |
7.2 (45) |
4.2 (39.6) |
2.6 (36.7) |
6.4 (43.5) |
| Average precipitation mm (inches) | 86.5 (3.406) |
63.4 (2.496) |
67.9 (2.673) |
62.5 (2.461) |
55.5 (2.185) |
66.7 (2.626) |
51.0 (2.008) |
63.5 (2.5) |
64.3 (2.531) |
73.9 (2.909) |
77.7 (3.059) |
91.9 (3.618) |
824.7 (32.469) |
| Source: The Met Office[3] | |||||||||||||
| Climate data for Birmingham Elmdon, 99m asl, 1971–2000, extremes 1901– (sunshine 1961–1990) | |||||||||||||
|---|---|---|---|---|---|---|---|---|---|---|---|---|---|
| Month | Jan | Feb | Mar | Apr | May | Jun | Jul | Aug | Sep | Oct | Nov | Dec | Year |
| Record high °C (°F) | 15.0 (59) |
18.1 (64.6) |
23.7 (74.7) |
26.0 (78.8) |
30.0 (86) |
31.6 (88.9) |
32.9 (91.2) |
34.9 (94.8) |
29.8 (85.6) |
26.8 (80.2) |
18.7 (65.7) |
15.7 (60.3) |
34.9 (94.8) |
| Average high °C (°F) | 6.7 (44.1) |
7.1 (44.8) |
9.8 (49.6) |
12.7 (54.9) |
16.0 (60.8) |
19.0 (66.2) |
21.3 (70.3) |
20.8 (69.4) |
17.8 (64) |
13.6 (56.5) |
9.5 (49.1) |
6.9 (44.4) |
13.4 (56.1) |
| Average low °C (°F) | 1.4 (34.5) |
1.1 (34) |
2.9 (37.2) |
4.2 (39.6) |
7.1 (44.8) |
10.0 (50) |
12.1 (53.8) |
11.8 (53.2) |
9.7 (49.5) |
6.8 (44.2) |
3.8 (38.8) |
1.6 (34.9) |
6.0 (42.8) |
| Record low °C (°F) | −20.8 (−5.4) |
−13.7 (7.3) |
−11.6 (11.1) |
−6.6 (20.1) |
−3.8 (25.2) |
−0.8 (30.6) |
1.2 (34.2) |
2.2 (36) |
−1.8 (28.8) |
−6.8 (19.8) |
−8.9 (16) |
−18.5 (−1.3) |
−20.8 (−5.4) |
| Average precipitation mm (inches) | 73.2 (2.882) |
51.4 (2.024) |
55.8 (2.197) |
61.9 (2.437) |
61.3 (2.413) |
65.6 (2.583) |
63.8 (2.512) |
66.7 (2.626) |
68.1 (2.681) |
82.7 (3.256) |
74.8 (2.945) |
79.7 (3.138) |
805 (31.69) |
| Mean monthly sunshine hours | 49.7 | 60.0 | 101.5 | 129.2 | 178.0 | 186.2 | 181.0 | 166.8 | 134.3 | 97.2 | 64.2 | 46.9 | 1,395 |
| Source #1: Royal Dutch Meteorological Institute[4] | |||||||||||||
| Source #2: National Oceanic and Atmospheric Administration[5] | |||||||||||||
| Climate data for Manchester (MAN), elevation: 69 m or 226 ft, 1981-2010 normals, extremes 1958-2004 | |||||||||||||
|---|---|---|---|---|---|---|---|---|---|---|---|---|---|
| Month | Jan | Feb | Mar | Apr | May | Jun | Jul | Aug | Sep | Oct | Nov | Dec | Year |
| Record high °C (°F) | 14.3 (57.7) |
16.5 (61.7) |
21.7 (71.1) |
25.1 (77.2) |
26.7 (80.1) |
31.3 (88.3) |
32.2 (90) |
33.7 (92.7) |
28.4 (83.1) |
25.6 (78.1) |
17.7 (63.9) |
15.1 (59.2) |
33.7 (92.7) |
| Mean maximum °C (°F) | 12.4 (54.3) |
12.6 (54.7) |
15.6 (60.1) |
19.1 (66.4) |
23.1 (73.6) |
25.5 (77.9) |
26.9 (80.4) |
27.0 (80.6) |
23.1 (73.6) |
18.9 (66) |
15.4 (59.7) |
13.2 (55.8) |
28.7 (83.7) |
| Average high °C (°F) | 7.3 (45.1) |
7.6 (45.7) |
10.0 (50) |
12.6 (54.7) |
16.1 (61) |
18.6 (65.5) |
20.6 (69.1) |
20.3 (68.5) |
17.6 (63.7) |
13.9 (57) |
10.0 (50) |
7.4 (45.3) |
13.5 (56.3) |
| Daily mean °C (°F) | 4.5 (40.1) |
4.6 (40.3) |
6.7 (44.1) |
8.8 (47.8) |
11.9 (53.4) |
14.6 (58.3) |
16.6 (61.9) |
16.4 (61.5) |
14.0 (57.2) |
10.7 (51.3) |
7.1 (44.8) |
4.6 (40.3) |
10.0 (50) |
| Average low °C (°F) | 1.7 (35.1) |
1.6 (34.9) |
3.3 (37.9) |
4.9 (40.8) |
7.7 (45.9) |
10.5 (50.9) |
12.6 (54.7) |
12.4 (54.3) |
10.3 (50.5) |
7.4 (45.3) |
4.2 (39.6) |
1.8 (35.2) |
6.6 (43.9) |
| Mean minimum °C (°F) | −4.8 (23.4) |
−4.2 (24.4) |
−2.4 (27.7) |
−0.9 (30.4) |
2.3 (36.1) |
5.2 (41.4) |
8.0 (46.4) |
7.2 (45) |
4.6 (40.3) |
0.5 (32.9) |
−2.4 (27.7) |
−5.7 (21.7) |
−7.4 (18.7) |
| Record low °C (°F) | −12.0 (10.4) |
−13.1 (8.4) |
−9.7 (14.5) |
−4.9 (23.2) |
−1.7 (28.9) |
0.8 (33.4) |
5.4 (41.7) |
3.6 (38.5) |
0.8 (33.4) |
−4.7 (23.5) |
−7.5 (18.5) |
−13.5 (7.7) |
−13.5 (7.7) |
| Average precipitation mm (inches) | 72.3 (2.846) |
51.4 (2.024) |
61.2 (2.409) |
54.0 (2.126) |
56.8 (2.236) |
66.1 (2.602) |
63.9 (2.516) |
77.0 (3.031) |
71.5 (2.815) |
92.5 (3.642) |
81.5 (3.209) |
80.7 (3.177) |
828.8 (32.63) |
| Average precipitation days (≥ 1.0 mm) | 13.1 | 9.7 | 12.3 | 11.2 | 10.4 | 11.1 | 10.9 | 12.0 | 11.1 | 13.6 | 14.1 | 13.5 | 142.9 |
| Average snowy days | 6 | 5 | 3 | 2 | 0 | 0 | 0 | 0 | 0 | 0 | 1 | 3 | 20 |
| Average relative humidity (%) | 87 | 86 | 85 | 85 | 85 | 87 | 88 | 89 | 89 | 89 | 88 | 87 | 88 |
| Mean monthly sunshine hours | 52.5 | 73.9 | 99.0 | 146.9 | 188.3 | 172.5 | 179.7 | 166.3 | 131.2 | 99.3 | 59.5 | 47.1 | 1,416.2 |
| Source #1: Met Office[3] NOAA (relative humidity and snow days 1961-1990)[6] | |||||||||||||
| Source #2: KNMI[7][8] | |||||||||||||
| Climate data for Shanklin, Isle of Wight 1981–2010 | |||||||||||||
|---|---|---|---|---|---|---|---|---|---|---|---|---|---|
| Month | Jan | Feb | Mar | Apr | May | Jun | Jul | Aug | Sep | Oct | Nov | Dec | Year |
| Average high °C (°F) | 8.1 (46.6) |
7.9 (46.2) |
10.0 (50) |
12.3 (54.1) |
15.6 (60.1) |
18.2 (64.8) |
20.4 (68.7) |
20.5 (68.9) |
18.3 (64.9) |
15.0 (59) |
11.3 (52.3) |
8.8 (47.8) |
13.9 (56.9) |
| Average low °C (°F) | 3.5 (38.3) |
2.9 (37.2) |
4.3 (39.7) |
5.4 (41.7) |
8.4 (47.1) |
11.1 (52) |
13.4 (56.1) |
13.8 (56.8) |
11.8 (53.2) |
9.5 (49.1) |
6.2 (43.2) |
4.0 (39.2) |
7.9 (46.1) |
| Average precipitation mm (inches) | 90.8 (3.575) |
65.5 (2.579) |
66.0 (2.598) |
53.4 (2.102) |
52.1 (2.051) |
46.3 (1.823) |
47.1 (1.854) |
54.6 (2.15) |
70.5 (2.776) |
115.0 (4.528) |
108.6 (4.276) |
101.0 (3.976) |
870.9 (34.288) |
| Average precipitation days | 13.1 | 9.8 | 10.4 | 9.1 | 8.2 | 7.6 | 6.9 | 7.4 | 8.9 | 12.7 | 12.7 | 12.9 | 119.7 |
| Mean monthly sunshine hours | 68.2 | 89.8 | 132.9 | 201.4 | 241.1 | 247.7 | 262.3 | 240.9 | 173.1 | 122.3 | 82.6 | 60.7 | 1,923 |
| Source: Met Office[9] | |||||||||||||
| Climate data for Bognor Regis 7m asl, 1981-2010, extremes 1960- | |||||||||||||
|---|---|---|---|---|---|---|---|---|---|---|---|---|---|
| Month | Jan | Feb | Mar | Apr | May | Jun | Jul | Aug | Sep | Oct | Nov | Dec | Year |
| Average high °C (°F) | 7.8 (46) |
7.9 (46.2) |
10.2 (50.4) |
12.8 (55) |
16.0 (60.8) |
18.6 (65.5) |
20.9 (69.6) |
21.0 (69.8) |
18.8 (65.8) |
15.3 (59.5) |
11.3 (52.3) |
8.6 (47.5) |
14.1 (57.4) |
| Average low °C (°F) | 3.1 (37.6) |
2.7 (36.9) |
4.3 (39.7) |
5.8 (42.4) |
9.0 (48.2) |
11.7 (53.1) |
14.0 (57.2) |
13.9 (57) |
11.9 (53.4) |
9.3 (48.7) |
5.8 (42.4) |
3.6 (38.5) |
7.9 (46.3) |
| Average precipitation mm (inches) | 76.2 (3) |
49.6 (1.953) |
56.1 (2.209) |
46.8 (1.843) |
44.4 (1.748) |
44.0 (1.732) |
44.9 (1.768) |
51.3 (2.02) |
58.9 (2.319) |
91.9 (3.618) |
83.4 (3.283) |
81.8 (3.22) |
729.3 (28.713) |
| Average rainy days | 12.5 | 9.0 | 9.7 | 8.8 | 7.6 | 7.3 | 6.5 | 7.3 | 8.3 | 11.2 | 11.6 | 11.7 | 111.5 |
| Mean monthly sunshine hours | 75.4 | 94.6 | 130.9 | 198.6 | 233.0 | 237.9 | 252.5 | 236.7 | 174.1 | 131.9 | 88.5 | 66.7 | 1,920.8 |
| Source: Met Office | |||||||||||||
| Climate data for Bournemouth Hurn 10m asl, 1981–2010,[Note 1] Extremes 1960– | |||||||||||||
|---|---|---|---|---|---|---|---|---|---|---|---|---|---|
| Month | Jan | Feb | Mar | Apr | May | Jun | Jul | Aug | Sep | Oct | Nov | Dec | Year |
| Average high °C (°F) | 8.4 (47.1) |
8.5 (47.3) |
11.0 (51.8) |
13.5 (56.3) |
17.0 (62.6) |
19.8 (67.6) |
22.1 (71.8) |
22.0 (71.6) |
19.3 (66.7) |
15.3 (59.5) |
11.5 (52.7) |
8.7 (47.7) |
14.8 (58.6) |
| Average low °C (°F) | 1.5 (34.7) |
1.2 (34.2) |
2.7 (36.9) |
3.8 (38.8) |
7.2 (45) |
9.8 (49.6) |
11.9 (53.4) |
11.6 (52.9) |
9.4 (48.9) |
7.1 (44.8) |
3.7 (38.7) |
1.6 (34.9) |
6 (42.7) |
| Average rainfall mm (inches) | 86.9 (3.421) |
62.5 (2.461) |
64.7 (2.547) |
53.9 (2.122) |
49.5 (1.949) |
51.6 (2.031) |
47.8 (1.882) |
51.8 (2.039) |
65.3 (2.571) |
100.7 (3.965) |
100.5 (3.957) |
100.0 (3.937) |
835.2 (32.882) |
| Average rainy days | 12.8 | 9.6 | 10.8 | 9.1 | 8.8 | 7.7 | 7.9 | 7.3 | 9.0 | 12.6 | 12.5 | 12.3 | 120.4 |
| Mean monthly sunshine hours | 66.5 | 84.5 | 121.4 | 185.1 | 218.5 | 229.5 | 232.0 | 214.6 | 159.1 | 115.2 | 80.1 | 60.3 | 1,766.8 |
| Source: Met Office[10] | |||||||||||||
Northern Ireland
Northern Ireland is warmer than Scotland throughout the year. Maximum temperatures are milder than in Wales from December to April, and milder than in England from December to February, but Northern Ireland is cooler during the rest of the year. Sunshine totals in every month are more than those of Scotland, but less than those of the rest of Great Britain. Northern Ireland is drier and has fewer rainy days than Scotland throughout the year, except in May, when it rains on more days. Northern Ireland is also drier than Wales in every month, yet it rains on more days. The rainiest month is January, when 17.8 days have more than 1 mm (0.04 in) of rain on average.[11]
| Northern Ireland weather averages | ||||||||||||||
|---|---|---|---|---|---|---|---|---|---|---|---|---|---|---|
| Month | Jan | Feb | Mar | Apr | May | Jun | Jul | Aug | Sep | Oct | Nov | Dec | Year | |
| Average maximum temperature °C (°F) | 6.7 (44.1) |
7.1 (44.8) |
8.9 (48.0) |
11.1 (52.0) |
14.2 (57.6) |
16.5 (61.7) |
18.4 (65.1) |
18.1 (64.6) |
15.7 (60.3) |
12.5 (54.5) |
9.2 (48.6) |
7.5 (45.5) |
12.2 (54.0) | |
| Average minimum temperature °C (°F) | 1.2 (34.2) |
1.2 (34.2) |
2.3 (36.1) |
3.3 (37.9) |
5.6 (42.1) |
8.3 (46.9) |
10.6 (51.1) |
10.2 (50.4) |
8.3 (46.9) |
6.1 (43.0) |
3.1 (37.6) |
2.0 (35.6) |
5.2 (41.4) | |
| Sunshine hours |
41.0 | 60.1 | 90.0 | 140.8 | 175.9 | 150.9 | 139.6 | 138.0 | 113.1 | 85.5 | 52.8 | 31.9 | 1219.7 | |
| Rainfall mm (inches) |
119.1 (4.7) |
86.5 (3.4) |
93.4 (3.7) |
70.6 (2.8) |
68.1 (2.7) |
72.1 (2.8) |
73.2 (2.9) |
90.8 (3.6) |
94.4 (3.7) |
114.5 (4.5) |
110.5 (4.4) |
118.5 (4.7) |
1111.6 (43.8) | |
| Rainfall ≥ 1 mm days |
17.8 | 14.1 | 16.4 | 12.4 | 12.6 | 12.4 | 13.1 | 13.9 | 14.4 | 16.4 | 16.7 | 16.9 | 177.0 | |
| Source: Met Office[11] (1971–2000 averages) | ||||||||||||||
| Climate data for Northern Ireland | |||||||||||||
|---|---|---|---|---|---|---|---|---|---|---|---|---|---|
| Month | Jan | Feb | Mar | Apr | May | Jun | Jul | Aug | Sep | Oct | Nov | Dec | Year |
| Record high °C (°F) | 16.4 (61.5) |
17.8 (64) |
21.7 (71.1) |
24.5 (76.1) |
28.0 (82.4) |
30.8 (87.4) |
30.8 (87.4) |
30.6 (87.1) |
27.8 (82) |
24.1 (75.4) |
18.5 (65.3) |
16.0 (60.8) |
30.8 (87.4) |
| Record low °C (°F) | −17.5 (0.5) |
−15.0 (5) |
−14.8 (5.4) |
−8.5 (16.7) |
−6.5 (20.3) |
−2.4 (27.7) |
−1.1 (30) |
−1.9 (28.6) |
−3.2 (26.2) |
−7.2 (19) |
−12.2 (10) |
−18.7 (−1.7) |
−18.7 (−1.7) |
| Source: The Met Office[3] | |||||||||||||
Scotland
Scotland is generally cool compared to the rest of the UK, and the climate at altitude merges into Cfc on the Köppen system, with average minimum temperatures in January of −0.2 °C (31.6 °F). The Central Lowlands have higher temperatures during the summer than any other part of Scotland, and have also broken some records for the whole of the UK. Aviemore is considered one of the coldest inhabited places, with its inland location and an altitude of about 210 metres. The wettest month in Scotland is January; most months are wetter than other parts of the UK, except for the late spring to early autumn months.
| Scotland 1971-2000[12] | ||||||||||||||||||||||||||||||||||||||||||||||||||||||||||||
|---|---|---|---|---|---|---|---|---|---|---|---|---|---|---|---|---|---|---|---|---|---|---|---|---|---|---|---|---|---|---|---|---|---|---|---|---|---|---|---|---|---|---|---|---|---|---|---|---|---|---|---|---|---|---|---|---|---|---|---|---|
| Climate chart (explanation) | ||||||||||||||||||||||||||||||||||||||||||||||||||||||||||||
| ||||||||||||||||||||||||||||||||||||||||||||||||||||||||||||
| ||||||||||||||||||||||||||||||||||||||||||||||||||||||||||||
| Scotland weather averages | ||||||||||||||
|---|---|---|---|---|---|---|---|---|---|---|---|---|---|---|
| Month | Jan | Feb | Mar | Apr | May | Jun | Jul | Aug | Sep | Oct | Nov | Dec | Year | |
| Average maximum temperature °C (°F) | 5.0 (41.0) |
5.2 (41.4) |
6.9 (44.4) |
9.3 (48.7) |
12.8 (55.0) |
14.9 (58.8) |
16.9 (62.4) |
16.6 (61.9) |
13.9 (57.0) |
10.8 (51.4) |
7.4 (45.3) |
5.7 (42.3) |
10.5 (50.9) | |
| Average minimum temperature °C (°F) | -0.2 (31.6) |
-0.1 (31.8) |
0.9 (33.6) |
2.1 (35.8) |
4.5 (40.1) |
7.2 (45.0) |
9.3 (48.7) |
9.2 (48.6) |
7.2 (45.0) |
4.9 (40.8) |
2.0 (35.6) |
0.5 (32.9) |
4.0 (39.2) | |
| Sunshine hours |
30.8 | 58.1 | 87.6 | 128.2 | 173.2 | 153.2 | 145.0 | 137.5 | 104.4 | 74.5 | 43.2 | 24.7 | 1160.4 | |
| Rainfall mm (inches) |
170.5 (6.7) |
123.4 (4.9) |
138.5 (5.5) |
86.2 (3.4) |
79.0 (3.1) |
85.1 (3.4) |
92.1 (3.6) |
107.4 (4.2) |
139.7 (5.5) |
162.6 (6.4) |
165.9 (6.5) |
169.6 (6.7) |
1520.1 (59.8) | |
| Rainfall ≥ 1 mm days |
18.6 | 14.8 | 17.3 | 13.0 | 12.2 | 12.7 | 13.3 | 14.1 | 15.9 | 17.7 | 17.9 | 18.2 | 185.8 | |
| Source: Met Office[12] (1971–2000 averages) | ||||||||||||||
| Climate data for Scotland | |||||||||||||
|---|---|---|---|---|---|---|---|---|---|---|---|---|---|
| Month | Jan | Feb | Mar | Apr | May | Jun | Jul | Aug | Sep | Oct | Nov | Dec | Year |
| Record high °C (°F) | 18.3 (64.9) |
17.9 (64.2) |
23.6 (74.5) |
27.2 (81) |
30.9 (87.6) |
32.2 (90) |
32.8 (91) |
32.9 (91.2) |
32.2 (90) |
27.4 (81.3) |
20.6 (69.1) |
18.3 (64.9) |
32.9 (91.2) |
| Record low °C (°F) | −27.2 (−17) |
−27.2 (−17) |
−22.8 (−9) |
−13.3 (8.1) |
−7.7 (18.1) |
−5.6 (21.9) |
−2.5 (27.5) |
−4.5 (23.9) |
−6.7 (19.9) |
−11.7 (10.9) |
−23.3 (−9.9) |
−27.2 (−17) |
−27.2 (−17) |
| Source: The Met Office[3] | |||||||||||||
| Aberdeen | ||||||||||||||||||||||||||||||||||||||||||||||||||||||||||||
|---|---|---|---|---|---|---|---|---|---|---|---|---|---|---|---|---|---|---|---|---|---|---|---|---|---|---|---|---|---|---|---|---|---|---|---|---|---|---|---|---|---|---|---|---|---|---|---|---|---|---|---|---|---|---|---|---|---|---|---|---|
| Climate chart (explanation) | ||||||||||||||||||||||||||||||||||||||||||||||||||||||||||||
| ||||||||||||||||||||||||||||||||||||||||||||||||||||||||||||
| ||||||||||||||||||||||||||||||||||||||||||||||||||||||||||||
| Edinburgh | ||||||||||||||||||||||||||||||||||||||||||||||||||||||||||||
|---|---|---|---|---|---|---|---|---|---|---|---|---|---|---|---|---|---|---|---|---|---|---|---|---|---|---|---|---|---|---|---|---|---|---|---|---|---|---|---|---|---|---|---|---|---|---|---|---|---|---|---|---|---|---|---|---|---|---|---|---|
| Climate chart (explanation) | ||||||||||||||||||||||||||||||||||||||||||||||||||||||||||||
| ||||||||||||||||||||||||||||||||||||||||||||||||||||||||||||
| ||||||||||||||||||||||||||||||||||||||||||||||||||||||||||||
| Glasgow | ||||||||||||||||||||||||||||||||||||||||||||||||||||||||||||
|---|---|---|---|---|---|---|---|---|---|---|---|---|---|---|---|---|---|---|---|---|---|---|---|---|---|---|---|---|---|---|---|---|---|---|---|---|---|---|---|---|---|---|---|---|---|---|---|---|---|---|---|---|---|---|---|---|---|---|---|---|
| Climate chart (explanation) | ||||||||||||||||||||||||||||||||||||||||||||||||||||||||||||
| ||||||||||||||||||||||||||||||||||||||||||||||||||||||||||||
| ||||||||||||||||||||||||||||||||||||||||||||||||||||||||||||
| Lerwick | ||||||||||||||||||||||||||||||||||||||||||||||||||||||||||||
|---|---|---|---|---|---|---|---|---|---|---|---|---|---|---|---|---|---|---|---|---|---|---|---|---|---|---|---|---|---|---|---|---|---|---|---|---|---|---|---|---|---|---|---|---|---|---|---|---|---|---|---|---|---|---|---|---|---|---|---|---|
| Climate chart (explanation) | ||||||||||||||||||||||||||||||||||||||||||||||||||||||||||||
| ||||||||||||||||||||||||||||||||||||||||||||||||||||||||||||
| ||||||||||||||||||||||||||||||||||||||||||||||||||||||||||||
Wales
Wales has warmer temperatures throughout the year than Northern Ireland and Scotland and has milder winter minima than England, but cooler winter maxima than Northern Ireland. Wales is wetter throughout the year than Northern Ireland and England, but has fewer rainy days than Northern Ireland; meaning that rainfall tends to be more intense. Wales is also drier than Scotland in every month apart from May, June and December, and there are fewer days with rain than in Scotland. Sunshine totals throughout the year are more than that of Scotland and Northern Ireland, but less than that of neighbouring England. May is the sunniest month, averaging 186.8 hours.[17]
| Wales 1971-2000[17] | ||||||||||||||||||||||||||||||||||||||||||||||||||||||||||||
|---|---|---|---|---|---|---|---|---|---|---|---|---|---|---|---|---|---|---|---|---|---|---|---|---|---|---|---|---|---|---|---|---|---|---|---|---|---|---|---|---|---|---|---|---|---|---|---|---|---|---|---|---|---|---|---|---|---|---|---|---|
| Climate chart (explanation) | ||||||||||||||||||||||||||||||||||||||||||||||||||||||||||||
| ||||||||||||||||||||||||||||||||||||||||||||||||||||||||||||
| ||||||||||||||||||||||||||||||||||||||||||||||||||||||||||||
| Wales weather averages | ||||||||||||||
|---|---|---|---|---|---|---|---|---|---|---|---|---|---|---|
| Month | Jan | Feb | Mar | Apr | May | Jun | Jul | Aug | Sep | Oct | Nov | Dec | Year | |
| Average maximum temperature °C (°F) | 6.5 (43.7) |
6.6 (43.9) |
8.6 (47.5) |
11.0 (51.8) |
14.5 (58.1) |
16.8 (62.2) |
19.1 (66.4) |
18.8 (65.8) |
16.2 (61.2) |
12.8 (55.0) |
9.3 (48.7) |
7.4 (45.3) |
12.3 (54.1) | |
| Average minimum temperature °C (°F) | 1.3 (34.3) |
1.1 (34.0) |
2.4 (36.3) |
3.4 (38.1) |
6.0 (42.8) |
8.6 (47.5) |
10.9 (51.6) |
10.7 (51.3) |
8.8 (47.8) |
6.5 (43.7) |
3.7 (38.7) |
2.2 (36.0) |
5.5 (41.9) | |
| Sunshine hours |
42.8 | 63.4 | 94.2 | 148.0 | 186.8 | 167.0 | 181.8 | 168.7 | 125.8 | 90.4 | 54.9 | 35.4 | 1359.3 | |
| Rainfall mm (inches) |
158.4 (6.2) |
113.8 (4.5) |
118.5 (4.7) |
85.7 (3.4) |
80.6 (3.2) |
86.0 (3.4) |
78.3 (3.1) |
105.8 (4.2) |
123.8 (4.9) |
152.9 (6.0) |
156.6 (6.2) |
173.1 (6.8) |
1433.5 (56.4) | |
| Rainfall ≥ 1 mm days |
17.4 | 13.4 | 15.1 | 11.7 | 11.5 | 11.4 | 10.3 | 12.2 | 13.0 | 15.8 | 16.7 | 17.1 | 165.5 | |
| Source: Met Office[17] (1971–2000 averages) | ||||||||||||||
| Climate data for Wales | |||||||||||||
|---|---|---|---|---|---|---|---|---|---|---|---|---|---|
| Month | Jan | Feb | Mar | Apr | May | Jun | Jul | Aug | Sep | Oct | Nov | Dec | Year |
| Record high °C (°F) | 18.3 (64.9) |
18.7 (65.7) |
23.9 (75) |
26.2 (79.2) |
29.2 (84.6) |
33.7 (92.7) |
34.6 (94.3) |
35.2 (95.4) |
31.1 (88) |
28.2 (82.8) |
22.4 (72.3) |
18.0 (64.4) |
35.2 (95.4) |
| Record low °C (°F) | −23.3 (−9.9) |
−20.0 (−4) |
−21.7 (−7.1) |
−11.2 (11.8) |
−6.1 (21) |
−4.0 (24.8) |
−1.5 (29.3) |
−2.8 (27) |
−5.5 (22.1) |
−9.4 (15.1) |
−18.0 (−0.4) |
−22.7 (−8.9) |
−23.3 (−9.9) |
| Source: The Met Office[3] | |||||||||||||
Seasons
Spring
Spring is the period from March to May. Spring is generally a calm, cool season, particularly because the Atlantic has lost much of its heat throughout the autumn and winter. As the sun rises higher in the sky and the days get longer, temperatures slowly rise, but the solar effect is mitigated somewhat by the effect of the cool ocean waters and westerly winds that blow across them.
There is a fair chance of snow earlier in the season when temperatures are colder; often in March. Some of the country's heaviest snowfalls of recent years have happened in the first half of March, and snow showers can occur infrequently until mid-April. They have been known to develop as late as mid-May over some areas of the country, such as in 2013 when snow was recorded on 14 May over parts of Staffordshire, Herefordshire and Wales. Snow was also recorded at lower levels in early June 1975. More recently, there was a disruptive snow event between 26 and 29 April 2016 across much of Northern England and Scotland, which was unusually the only significant snow event of the winter 2015/16. Snow, frost and ice can be disruptive and damaging to flowering plants, particularly later in the spring.
Early spring can be quite cold, and occasionally the lowest temperature of the winter can occur in March, as it did at Heathrow Airport on 5 March 2001, 4 March 2006 and 8 March 2011. Temperatures below freezing are not unusual in March, even in the south of the UK. On the other hand, high temperatures above 30 °C are generally rare, but can occur on occasion; most recently on 25 May 2012. It was even hotter on 27 May 2005, when 31.9 °C was recorded in London. Rarely, the hottest day of the year can be in spring. As stated below, 27 May was the hottest day of the year in 2012 in most parts of the UK. In Aberdaron, the hottest day of 2011 was very early on in the year on 21 April. Temperatures in March seldom reach 20 °C, as they did in 1990, 1993, 2012 and 2017, and this temperature is usually reached for the first time in April or May. Throughout spring, there can be large temperature swings between day and night. On 9 April 2017, night-time temperatures fell to just 3 °C at Northolt, but 25 °C was reached in the afternoon. Warmth in spring depends almost entirely on the strength of the sun, and can trigger thunderstorms and downpours.
Mean temperatures in Spring are markedly influenced by latitude. Most of Scotland and the mountains of Wales and northern England are the coolest areas of the UK, with average temperatures ranging from −0.6 to 5.8 °C (30.9 to 42.4 °F).[18] The southern half of England experiences the warmest spring temperatures of between 8.8 and 10.3 °C (47.8 and 50.5 °F).[18]
Summer
Summer lasts from June to August and is the warmest and usually the sunniest season. There can be wide local variations in rainfall totals due to localised thundershowers. These thundershowers mainly occur in southern, eastern, and central England and are less frequent and severe in the north and west.[19] Climatic differences at this time of year are more influenced by latitude and proximity to the ocean. Temperatures are the highest in southern and central areas and lowest in the north. Hot weather above 27 °C in most places and in most years occurs on multiple days per year, but more frequently in London and south-east England and less so in parts of Scotland.[20] The record maximum is 38.5 °C (101.3 °F), recorded in Faversham, Kent on 10 August 2003.[21]
Autumn
Autumn in the United Kingdom lasts from September to November.[22] The season may be a little more unsettled; as cool polar air moves southwards, it can meet warm air from the tropics and produce an area of disturbance along which the country lies. This can combine with the warm ocean due to heating throughout the spring and summer, to produce some unsettled weather. In addition, the land may become colder than the ocean, resulting in significant amounts of condensation and rain-bearing clouds.
Atlantic depressions at this time can become intense, and winds of hurricane force (greater than 119 km/h or 74 mph) can be recorded. Western areas, closest to the Atlantic, experience these severe conditions more often than eastern areas. Autumn, particularly the latter part, is often the stormiest time of the year. One particularly intense depression was the Great Storm of 1987. A very severe storm also affected the UK on 27 October 2002. At Mumbles Head near Swansea, a maximum sustained wind speed of over 123 km/h was recorded: equivalent to a Category 1 hurricane.[23] The autumn of 2013 was also littered with severe storms, including the St. Jude's Storm on 28 October 2013.
Autumn can sometimes be a cold season - in recent years, very low temperatures and heavy snowfall have been recorded during November 1985, November 1993 and November 2010. There was a new record low of -18.0 °C in Wales on 28 November 2010. At Northolt, in Greater London, the coldest temperature of the year 2016 was set on 30 November. Snow also fell rather widely across the UK on 28-29 October 2008, causing traffic problems where it settled on the M4. Even further south, low temperatures can be recorded, with temperatures well below freezing as far south as Heathrow Airport on 29-31 October 1997, with a lower temperature than any recorded at this station in March, November or December 1997 and even the following January 1998; only on 2 and 4 February 1998 were lower temperatures recorded here that winter. The first frost of the winter usually occurs between October and December; frost is quite unusual in September, when the surrounding ocean is at or near its warmest, except on high ground. It is not particularly unusual for September to be warmer than June, as it was in 1999.[24]
However, the United Kingdom sometimes experiences an "Indian summer", when temperatures, particularly by night, can be very mild and rarely fall below 10 °C (50 °F). Such events are aided by the surrounding Atlantic Ocean and seas being at their warmest, keeping the country in warm air, despite the relatively weak sun. Examples of this were in 1985, 1999, 2005, 2006, 2011[25] and 2016 when September saw above average temperatures which felt more like a continuation of summer than autumn. Autumns since 2000 have generally been very mild, with notable extremes of precipitation; the UK has seen some of its wettest and driest autumns since the millennium. 2011 and 2016 were notable as many areas of the country recorded their highest temperatures of the year in September and October (for example, 28.2 °C at Hawarden on 1 October, 26.3 °C at St. Athan on 2 October 2011 and the UK's highest temperature of 2016 on 13 September with 34.4 °C at Gravesend).[26]
Coastal areas in the southern half of England have on average the warmest autumns, with mean temperatures of 10.7 to 13.0 °C (51.3 to 55.4 °F).[27] Mountainous areas of Wales and northern England, and almost all of Scotland, experience mean temperatures between 1.7 and 7.5 °C (35.1 and 45.5 °F).[27]
Winter
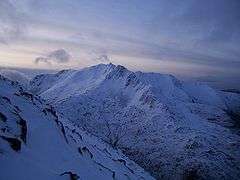
Winter in the UK is defined as lasting from December to February. The season is generally cool, wet, windy, and cloudy. Temperatures at night rarely drop below −10 °C (14 °F) and in the day rarely rise above 15 °C (59 °F). Precipitation can be plentiful throughout the season, though snow is relatively infrequent despite the country's high latitude: often the only areas with significant snowfall are the Scottish Highlands and the Pennines, where at higher elevations a colder climate determines the vegetation, mainly temperate coniferous forest, although deforestation has severely decreased the forest area. For a majority of the UK, snow is possible but not frequent, apart from the higher altitudes, where snow can lie for 1–5 months or even beyond 6 months.
Towards the later part of the season the weather usually stabilises with less wind, less precipitation and lower temperatures. This change is particularly pronounced near the coasts, mainly because the Atlantic Ocean is often at its coldest at this time after being cooled throughout the autumn and the winter. The early part of winter however is often unsettled and stormy; often the wettest and windiest time of the year.
Snow falls intermittently and mainly affects northern and eastern areas, high ground in Wales and especially the mountains of Scotland, where there is often enough snow lying to permit skiing at some of the five Scottish ski resorts. These resorts usually operate between December and April, depending on the snowfall. Frequently in the mountains potent depressions may move in from the north in the form of "polar lows", introducing heavy snow and often blizzard-like conditions to parts of the United Kingdom, particularly Scotland. Blizzards have become rarer in the 21st century, although much of England was affected by one on 30 January 2003. During periods of light winds and high pressure, frost and fog can become a problem and can pose a major hazard to drivers.
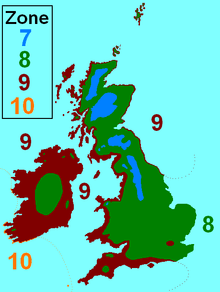
Mean winter temperatures in the UK are most influenced by proximity to the sea. The coldest areas are the mountains of Wales and northern England, and inland areas of Scotland, averaging −3.6 to 2.3 °C (25.5 to 36.1 °F).[28] Coastal areas, particularly those in the south and west, experience the mildest winters, on average 5 to 8.7 °C (41.0 to 47.7 °F).[28] Hardiness zones in the UK are high, ranging from zone 7 in the Scottish Highlands, the Pennines and Snowdonia, to zone 10 on the Isles of Scilly. Most of the UK lies in zones 8 or 9.[29] In zone 7, the average lowest temperature each year is between −17.7 and −12.3 °C (0.1 and 9.9 °F), and in zone 10, this figure is between −1.1 and 4.4 °C (30.0 and 39.9 °F).[30]
Snow falls in the UK almost every year, but in small quantities. The UK can suffer extreme winters like 1684, 1740, 1795 (when London had its record lowest temperature of −21.1 °C (−6.0 °F)), 1947 and 1963. In 1962 it snowed on Boxing Day, and snow lasted in most areas until 6 March, with blizzards through February, which had significant and documented effects on the FA Cup - Wrexham were forced to play on sand for one tie. In recent times snow has generally become rarer, but the UK can still get heavy falls, such as in 1978-79, 1981-82, 1986-87 and 1990-91. The winter of 2008/09 produced the heaviest snowfall since 1991 between 1 and 3 February, and the winter of 2009-10 was even more severe, with many parts of the United Kingdom having the coldest and snowiest winters since 1978/79; temperatures plummeted to −22.3 °C (−8.1 °F) at Altnaharra, Sutherland – close to the −22.9 °C (−9.2 °F) recorded in Antarctica in the same period. The lowest temperature ever recorded in the UK was −27.2 °C (−17.0 °F), on 10 January 1982 and 11 February 1895 in Braemar, Scotland and on 30 December 1995 in Altnaharra. December 2010 was the coldest December in 120 years; the CET (Central England Temperature) was -0.7 °C; it was the coldest month since February 1986, and the coldest December since 1890. Many places had heavy snowfall and extreme cold, temperatures regularly fell below −10.0 °C (14.0 °F)) across many areas. However, the cold subsided after Christmas Day, 2010. November 2010 saw an extremely severe cold snap, with lows of −18.0 °C (−0.4 °F)) in Llysdinam on 28 November. The month saw temperatures below average, despite what was actually a very mild first half. Spring 2013 was also cold: March 2013 was the coldest month of the winter (and indeed 2013 as a whole), which is quite striking given that December 2012, January and February 2013 were all also below average in terms of temperature. The following winter was the opposite: in many places, only on 11 and 12 January was any snow recorded (some places having no snow at all), and the entire country was battered by a series of severe depressions and storms. The St Jude's Day storm first affected the UK on 26 October 2013, and many places saw no respite until a high swept across the country on 2 March 2014. Some places in the Somerset Levels remained under water for most of the winter and well into spring. Record-equalling gusts of 142 mph were recorded off the north coast of Scotland on 5 December 2013, with notably severe storms also recorded on 2 November 2013, 24 December 2013, 3 January 2014 and 14 February 2014.
In the 1990s and 2000s, most of the winters were milder and usually wetter than average, with below-freezing daytime temperatures a rare occurrence. In fact, the winter of 1995/1996 was the only one which was defined as below average in terms of the UK as a whole, although February 1991 saw heavy snowfall and January 1997 was cold in the South. The winters of 2008/09, 2009/10 and 2010/11, however, had below or well below average temperatures, with large snowfall amounts widespread and very low temperatures; this was the first series of three consecutive cold winters in the UK since the 1960s. Since the winter of 2012/2013, winters have been mild (exceptionally so in 2013/2014 and 2015/2016), although exceptionally wet. The winter of 2014/2015 was an oddity: it was generally quiet and sunny. December 2014 and January 2015 were a little milder than the average; February 2015 was close to normal. The winter of 2016/17 was very nearly a very cold winter owing to the presence and position of high pressure, although ultimately only November 2016 was cold widely as a whole. Early December 2016 was cool and January 2017 was cold in the south-east, with much of the rest of England and Wales near the 1961-1990 average. At Northolt, the average daily minimum for January 2017 was below freezing for the first time since December 2010.
December 2015 was the wettest calendar month ever recorded in the United Kingdom, and January 2016 the second wettest. In these months, some northern and western parts had 2 to 4 times as much rainfall as normal.[31] December 2015 was also the warmest December averaged over the whole UK, and had the highest positive anomaly for any month in the Central England temperature series which began in 1659 (CET was 9.7 °C, this is warmer than even any March[32]). Most areas of southern England had average monthly temperatures 5-6 °C above normal. Some plants flowered that would normally do so in the spring or even summer.[33] Hardly any stations in Wales and Southern England recorded any air frosts, and temperatures were often comparable to those of April or May. The maximum recorded temperature was 17.2 °C at Teignmouth in Devon and Plockton and Achnagart in the Highlands of Scotland on the 16th. The lowest daily mean temperature during December 2015 at Heathrow Airport was 8.2 °C (on 9 December), comparable to the average daily high for the calendar month. Remarkably, December 2015 did not break any national records for high temperatures, just failing to reach the maximum England temperature of 17.7 °C recorded on 2 December 1985 in Chivenor, Devon and on 11 December 1994 in Penkridge, Staffordshire.[34] Despite the warmth, it was the dullest December since 1989.[35]
Sunshine and cloud
The average total annual sunshine in the United Kingdom is 1339.7 hours, which is just under 30% of the maximum possible (The maximum hours of sunshine possible in one year is approximately 4476 hours).[36] Generally the United Kingdom sees frequent cloudy skies due to its high latitude and oceanic controlled climate. The lowest sunshine hours are found in northern parts of the country and the highest in the southern parts and southern coast of England. The counties of Dorset, Hampshire, Sussex and Kent are the sunniest areas, which have annual average totals of around 1,750 hours of sunshine per year.[37] Northern, western and mountainous areas are generally the cloudiest areas of the UK, with some mountainous areas receiving fewer than 1,000 hours of sunshine a year.[37]

Valley areas such as the South Wales Valleys, due to their north-south orientation, receive less sunshine than lowland areas because the mountains on either side of the valley obscure the sun in the early morning and late evening. This is noticeable in winter where there are only a few hours of sunshine. The mountains of Wales, northern England and Scotland can be especially cloudy with extensive mist and fog. Near the coast, sea fog may develop in the spring and early summer. Radiation fog may develop over inland areas of Great Britain and can persist for hours or even days in the winter and can pose a major hazard for drivers and aircraft.
On occasions blocking anticyclones (high pressure systems) may move over the United Kingdom, which can persist for weeks or even months. The subsided, dry air often results in clear skies and few clouds, bringing frosty nights in winter and warm days in the summer.
Average hours of sunshine in winter range from 38–108 hours in some mountainous areas and western Scotland, up to 217 hours in the south and east of England;[38] while average hours of sunshine in summer range from 294–420 hours in northern Scotland and Northern Ireland, to 600–760 hours in southern English coastal counties.[39] The most sunshine recorded in one month was 383.9 hours at Eastbourne (East Sussex) in July 1911.[37]
Atlantic Ocean
One of the greatest influences on the climate of the UK is the Atlantic Ocean and especially the Gulf Stream, which carries warm water up from lower latitudes and modifies the high latitude air masses that pass across the UK. This thermohaline circulation has a powerful moderating and warming effect on the country's climate. This warm water current warms the climate to such a great extent that if the current did not exist then temperatures in winter would be about 10 °C (18 °F) lower than they are today and similar to eastern Russia or Canada near the same latitude. The current allows England to have vineyards at the same latitude that Canada has polar bears. These warm ocean currents also bring substantial amounts of humidity which contributes to the notoriously wet climate that western parts of the UK experience.
The extent of the Gulf Stream's contribution to the actual temperature in western Europe is a matter of dispute.[40][41] It has been argued that atmospheric waves that bring warm air northwards contribute to the warmer temperatures than thermohaline circulation.[40]
Winds
The high latitude and proximity to a large ocean to the west means that the United Kingdom experiences strong winds. The prevailing wind is from the south-west, but it may blow from any direction for sustained periods of time. Winds are strongest near westerly facing coasts and exposed headlands.
Gales — which are defined as winds with speeds of 51 to 101 km/h (32 to 63 mph)— are strongly associated with the passage of deep depressions across the country. The Hebrides experience on average 35 days of gale a year (a day where there are gale-force winds) while inland areas in England and Wales receive fewer than 5 days of gale a year.[37] Areas of high elevation tend to have higher wind speeds than low elevations, and Great Dun Fell in Cumbria (at 857 m or 2,812 ft) averaged 114 days of gale a year during the period 1963 to 1976. The highest gust recorded at a low level in England was 191 km/h (119 mph) at Gwennap Head in Cornwall on 15 December 1979,[37] and a 115 mph gust was also recorded at Shoreham-By-Sea on 16 October 1987. A disputed 122 mph gust was recorded on 16 October 1987 at Gorleston in Norfolk during the Great Storm of 1987. In Scotland, Fraserburgh in Aberdeenshire recorded 229 km/h (142 mph) on 13 February 1989, which was equalled during Cyclone Xaver on 5 December 2013. Wales' highest wind speed gust of 200 km/h (124 mph) was set at Rhoose, Vale of Glamorgan on 28 October 1989. Especially potent storm systems typically affect the UK during autumn and winter, with the winters of 1989/1990 and 2013/2014 particularly notable for the frequency and potency of storm systems.
An unofficial gust of 194 mph was recorded on the Shetland Isles during the New Year's Day Storm on 1 January 1992, and an equal unofficial 194 mph wind gust is claimed to have been set in the Cairngorm Mountains on 19 December 2008.[42]
Barometric pressure plays a role in storm systems. For the United Kingdom, record figures for barometric pressure recordings are:[43]
Highest - 1053.6mb (Aberdeen, 31 January 1902)
Lowest - 925.6mb (Ochtertyre, 26 January 1884)
Notably a low pressure storm system affected the UK with a central pressure of 914.0mb on 10 January 1993, however this figure is not recorded over the UK but out in the Atlantic, despite the system affecting the UK.
Rainfall
Rainfall amounts can vary greatly across the United Kingdom: generally the further west and the higher the elevation, the greater the rainfall. The mountains of Wales, Scotland, the Pennines in Northern England and the moors of South West England are the wettest parts of the country, and in some of these places as much as 4,577 millimetres (180.2 in) of rain can fall annually,[44] making these locations some of the wettest in Europe. The wettest spot in the United Kingdom is Crib Goch, in Snowdonia, which has averaged 4,473 millimetres (176.1 in) rain a year over the past 30 years.[45][46] Most rainfall in the United Kingdom comes from North Atlantic depressions which roll into the country throughout the year from the west or southwest and are particularly frequent and intense in the autumn and winter. They can on occasions bring prolonged periods of heavy rain, and flooding is quite common.
Parts of England are dry in global terms, which is contrary to the stereotypical view—London receives just below 650 millimetres (25.6 in) per annum,[47] which is less than Rome, Sydney, or New York City. In East Anglia it typically rains on about 113 days per year.[48] Most of the south, south-east and East Anglia receive less than 700 millimetres (27.6 in) of rain per year.[37] The English counties of Essex, Cambridgeshire - as well as parts of North Yorkshire, the East Riding of Yorkshire, Suffolk and Norfolk - are amongst the driest in the UK, with an average annual rainfall of around 600 millimetres (23.6 in). This is due to a mild rainshadow effect, due to mountainous parts of the South West, Wales and Cumbria blocking the moist airflow across the country to the east. In some years rainfall totals in Essex and South Suffolk can be below 450 millimetres (17.7 in) (especially areas around Colchester, Clacton and Ipswich) - less than the average annual rainfall in Jerusalem, Beirut and even some semi-arid parts of the world.
Parts of the United Kingdom have had drought problems in recent years, particularly in 2004-2006. Fires broke out in some areas, even across the normally damp higher ground of north-west England and Wales. The landscape in much of England and east Wales became very parched, even near the coast; water restrictions were in place in some areas.
July 2006 was the hottest month on record for the United Kingdom and much of Europe,[49] however England has had warmer spells of 31 days which did not coincide with a calendar month—in 1976 and 1995. The impact of droughts is increased because the driest parts of England also have the highest population density, and therefore the highest water consumption. The drought in 2006 was eased when in the period from October 2006 to January 2007, which had well above average rainfall.
December 2015 was the wettest month ever recorded in the United Kingdom.[50] The average rainfall for the month was almost doubled.[51]
Temperature
Generally the United Kingdom has cool to mild winters and warm summers with moderate variation in temperature throughout the year. In England the average annual temperature varies from 8.5 °C (47.3 °F) in the north to 11 °C (51.8 °F) in the south, but over the higher ground this can be several degrees lower.[37] This small variation in temperature is to a large extent due to the moderating effect the Atlantic ocean has—water has a much greater specific heat capacity than air and tends to heat and cool slowly throughout the year. This has a warming influence on coastal areas in winter and a cooling influence in summer.
The ocean is at its coldest in February or early March, thus around coastal areas February is often the coldest month, but inland there is little to choose between February and January as the coldest.[37] Temperatures tend to drop lowest on late winter nights inland, in the presence of high pressure, clear skies, light winds and when there is snow on the ground. On occasions, cold polar or continental air can be drawn in over the United Kingdom to bring very cold weather.
The floors of inland valleys away from warming influence of the sea can be particularly cold as cold, dense air drains into them. A temperature of −26.1 °C (−15.0 °F) was recorded under such conditions at Edgmond in Shropshire on 10 January 1982, the coldest temperature recorded in England and Wales. The following day the coldest maximum temperature in England, at −11.3 °C (11.7 °F), was recorded at the same site.[37]
On average the warmest winter temperatures occur on the south and west coasts, however, warm temperatures occasionally occur due to a foehn wind warming up downwind after the crossing the mountains. Temperatures in these areas can rise to 15 °C (59 °F) in winter on rare occasions[52] This is a particularly notable event in northern Scotland, mainly Aberdeenshire, where these high temperatures can occur in midwinter when the sun only reaches about 10° above the horizon.
July is on average the warmest month, and the highest temperatures tend to occur away from the Atlantic in southern, eastern and central England, where summer temperatures can rise above 30 °C (86 °F). It soared to 38.5 °C (101.3 °F) in Faversham, Kent on 10 August 2003: the highest temperature ever recorded in the United Kingdom.[53]
| Absolute temperature ranges | ||||||
|---|---|---|---|---|---|---|
| Country | Maximum temperatures | Minimum temperatures | ||||
| °C | °F | Location and date | °C | °F | Location and date | |
| England | 38.5 | 101.3 |
|
−26.1 | −15.0 |
|
| Wales | 35.2 | 95.4 |
|
−23.3 | −9.9 |
|
| Scotland | 33.2 | 91.8 |
|
−27.2 | −17.0 |
|
| Northern Ireland | 30.8 | 87.4 |
|
−18.6 | −1.5 |
|
Severe weather
While the United Kingdom is not particularly noted for extreme weather, it does sometimes occur, and events such as floods and drought may be experienced. The summer of 1976, for example, experienced temperatures as high as 35 °C (95 °F), and it was so dry the country suffered drought and water shortages.[54]
Extended periods of extreme weather, such as the droughts of 1975–1976, summer 2006, and spring 2012, the long hot summers of 1911, 1976, 2003 and 2006, and the winters of 1946–1947, 1962–1963, 2009–2010, and 2010–2011 are often caused by blocking anti-cyclones which can persist for several days, weeks, or even months. In winter they can bring long periods of cold dry weather and in summer long periods of hot dry weather.
There have also been occurrences of severe flash floods caused by intense rainfall; the most severe was the Lynmouth disaster of 1952 in which 34 people died and 38 houses and buildings were completely destroyed. In the summer of 2004, a severe flash flood devastated the town of Boscastle in Cornwall. However, the worst floods in the United Kingdom in modern times occurred in the North Sea flood of 1953. A powerful storm from the Atlantic moved around Scotland and down the east coast of England. As it moved south it produced a storm surge which was magnified as the North Sea became narrower further south. By the time the storm affected south-east England and the Netherlands, the surge had reached the height of 3.6 metres (12 ft). Over 300 people were killed by the floods in eastern England.
Thunderstorms are most common in southern and eastern England, and least common in the north and west.[55] In London, thunderstorms occur on average 14–19 days a year, while in most of Northern Ireland and the west of Scotland thunderstorms occur on around 3 days a year.[55] Occasionally, thunderstorms can be severe and produce large hailstones as seen in Ottery St Mary, Devon in October 2008, where drifts reached 1.8 metres (5 ft 11 in).[56]
Strong winds occur mainly in the autumn and winter months associated with low pressure systems and Scotland experiences hurricane-force winds in most winters. The Gale of January 1976, Great Storm of 1987 (23 fatalities) and the Burns' Day storm of 1990 (97 fatalities) are particularly severe examples; Scotland saw winds of 142 mph during Cyclone Xaver in 2013.[57]
The most rain recorded to fall on a single day was 279 mm at Martinstown (Dorset) on 18 July 1955,[37] but also 243 mm fell at Bruton, Somerset on 28 June 1917.[58] Heavy rain also fell between 20 and 25 June in 2007; some areas experienced a month's rainfall in one day. Four people died in the flooding and over £1.5 billion of damage to businesses and properties was caused.
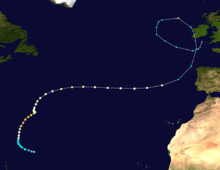
Tropical cyclones themselves do not affect the UK due to the seas being too cold – they need temperatures above 26.5 °C (79.7 °F) to remain active. The waters near the UK, the Atlantic Ocean, only have temperatures of 2 to 18 °C (36 to 64 °F),[59] so any tropical cyclone that does come anywhere near the UK has said to have undergone a process called extratropical transition. This now means it is an extratropical cyclone, which the UK frequently experiences. The Great Storm of 1987 was a very deep depression which formed in the Bay of Biscay, which also contained the remnants of Hurricane Floyd.[60] Hurricane Lili of 1996 and Hurricane Gordon of 2006 both crossed the UK as strong extratropical cyclones with tropical storm-force winds, causing transport closures, power-cuts and flooding in Northern Ireland, Scotland and South West England. In 2011, the remnants of Hurricane Katia passed over northwestern Scotland with winds near 70 mph (110 km/h).
Tornadoes
It is internationally recognised that the United Kingdom has a higher incidence of tornadoes, measured by unit area of land, than any other country in the world. Dr T. Theodore Fujita (inventor of the Fujita scale), an American meteorologist, was the first to recognise the UK as the top site for tornadoes in 1973.[61][62] The United Kingdom has at least 33 tornadoes per year,[63] more than any other country in the world relative to its land area.[64] Although most tornadoes are weak, there are occasional destructive events, for example, the Birmingham tornado of 2005 and the London tornado of 2006. Both registered F2 on the Fujita scale and both caused significant damage and injury. The largest ever recorded was thought to have been an F4, again in London in 1091. The most deadly occurred on 28 December 1879. All 74 lives were lost when a passenger train plunged from the Tay Bridge (Tayside) into the Tay Estuary, when the middle section of the bridge collapsed. Although the bridge was poorly constructed and had already been weakened in earlier gales (including the pre-existing winds at the time of the tragedy), the ultimate failure is believed to have been caused by two or three waterspouts which were sighted close to the bridge immediately before the accident.[65] A tornado also developed in London on 3 July 2007.
The UK also holds the title for the highest known 'outbreak' of tornadoes outside of the United States. The largest tornado outbreak in Britain is also the largest tornado outbreak known anywhere in Europe. On 23 November 1981, 105 tornadoes were spawned by a cold front in the space of 5.25 hours. Excepting Derbyshire, every county in a triangular area from Gwynedd to Humberside to Essex was hit by at least one tornado, while Norfolk was hit by at least 13. Very fortunately most tornadoes were short-lived and also weak (the strongest was around T5 on the TORRO Tornado Scale) and no deaths occurred.[65]
Southern England between the Isle of Wight and Beachy Head has been recognised as a 'hotspot' for tornadoes and waterspouts.[66] The area (known as 'The Isle of Wight and South Coast Anomaly') has seen significant activity and is thought to be due to the shedding of vortices, downwind of the Isle of Wight, under certain weather conditions.[66]
Climate history
The climate of the United Kingdom has not always been the way it is today. During some periods it was much warmer and in others it was much colder. The last glacial period was a period of extreme cold weather that lasted for tens of thousands of years and ended about 10,000 years ago. During this period the temperature was so low that much of the surrounding ocean froze and a great ice sheet extended over all of the United Kingdom except the south of England (connected to mainland Europe via the dry English Channel) and southern coastal areas of Wales.
The cold period from the 16th to the mid-19th centuries is known as the Little Ice Age.
The temperature records in England are continuous back to the mid 17th century. The Central England temperature (CET) record is the oldest in the world, and is a compound source of cross-correlated records from several locations in central England. Precipitation records date back to the eighteenth century and the modern England and Wales Precipitation series begins in 1766.
A detailed narrative account of the weather of every year from 1913 to 1942, with photographs of plants taken on the same day in each of those years, may be found in Willis (1944).[67]
As with many parts of the world, over the last century the United Kingdom has reported a warming trend in temperatures. While some of this may be due to a recovery from the cooler period of climate mid 20th century (particularly the 1960s) the last 20 years has nonetheless seen an unprecedented level of warm weather. This rise in temperatures is illustrated by the most recent dataset (1981–2010) for Belfast and Cambridge Botanical Gardens, and the same data 50 years previous (1931–1960).
| Climate data for Belfast, 1931-1960 | |||||||||||||
|---|---|---|---|---|---|---|---|---|---|---|---|---|---|
| Month | Jan | Feb | Mar | Apr | May | Jun | Jul | Aug | Sep | Oct | Nov | Dec | Year |
| Average high °C (°F) | 6.0 (42.8) |
6.8 (44.2) |
9.2 (48.6) |
11.8 (53.2) |
14.9 (58.8) |
17.5 (63.5) |
18.4 (65.1) |
18.3 (64.9) |
16.1 (61) |
12.6 (54.7) |
9.1 (48.4) |
6.9 (44.4) |
12.3 (54.1) |
| Average low °C (°F) | 1.5 (34.7) |
1.5 (34.7) |
2.7 (36.9) |
3.9 (39) |
6.1 (43) |
9.2 (48.6) |
11.0 (51.8) |
10.7 (51.3) |
9.2 (48.6) |
6.8 (44.2) |
4.1 (39.4) |
2.9 (37.2) |
5.8 (42.4) |
| Source: Stadtklima[68] | |||||||||||||
| Climate data for Belfast, 1981-2010 | |||||||||||||
|---|---|---|---|---|---|---|---|---|---|---|---|---|---|
| Month | Jan | Feb | Mar | Apr | May | Jun | Jul | Aug | Sep | Oct | Nov | Dec | Year |
| Average high °C (°F) | 7.1 (44.8) |
7.4 (45.3) |
9.5 (49.1) |
11.9 (53.4) |
15.0 (59) |
17.4 (63.3) |
19.1 (66.4) |
18.5 (65.3) |
16.3 (61.3) |
12.8 (55) |
9.5 (49.1) |
7.4 (45.3) |
12.7 (54.8) |
| Average low °C (°F) | 1.8 (35.2) |
1.7 (35.1) |
2.9 (37.2) |
4.3 (39.7) |
6.8 (44.2) |
9.6 (49.3) |
11.6 (52.9) |
11.4 (52.5) |
9.5 (49.1) |
6.9 (44.4) |
4.0 (39.2) |
2.1 (35.8) |
6.1 (42.9) |
| Source: Royal Netherlands Meteorological Institute[69] | |||||||||||||
| Climate data for Change in monthly mean temperatures at Belfast between 1931-1960 and 1981-2010 | |||||||||||||
|---|---|---|---|---|---|---|---|---|---|---|---|---|---|
| Month | Jan | Feb | Mar | Apr | May | Jun | Jul | Aug | Sep | Oct | Nov | Dec | Year |
| Average high °C (°F) | +1.1C | +0.6C | +0.3C | +0.1C | +0.1C | -0.1C | +0.7C | +0.2C | +0.2C | +0.4C | +0.5C | +0.4C | +0.36C |
| Average low °C (°F) | +0.3C | +0.2C | +0.2C | +0.4C | +0.7C | +0.4C | +0.6C | +0.7C | +0.3C | +0.1C | -0.1C | -0.8C | +0.25C |
| Source: Royal Netherlands Meteorological Institute[69] | |||||||||||||
As the above tables show, all months except December at Belfast exhibit warming when both maximum and minimum temperatures are taken into account.
| Climate data for Cambridge, 1931-1960 | |||||||||||||
|---|---|---|---|---|---|---|---|---|---|---|---|---|---|
| Month | Jan | Feb | Mar | Apr | May | Jun | Jul | Aug | Sep | Oct | Nov | Dec | Year |
| Average high °C (°F) | 6.3 (43.3) |
7.2 (45) |
10.5 (50.9) |
13.7 (56.7) |
17.2 (63) |
20.5 (68.9) |
22.2 (72) |
22.0 (71.6) |
19.2 (66.6) |
14.6 (58.3) |
9.9 (49.8) |
7.3 (45.1) |
14.2 (57.6) |
| Average low °C (°F) | 0.6 (33.1) |
0.5 (32.9) |
1.6 (34.9) |
3.8 (38.8) |
6.5 (43.7) |
9.7 (49.5) |
11.8 (53.2) |
11.5 (52.7) |
9.5 (49.1) |
6.1 (43) |
3.5 (38.3) |
1.7 (35.1) |
5.6 (42) |
| Source: Stadtklima[70] | |||||||||||||
| Climate data for Cambridge, 1981-2010 | |||||||||||||
|---|---|---|---|---|---|---|---|---|---|---|---|---|---|
| Month | Jan | Feb | Mar | Apr | May | Jun | Jul | Aug | Sep | Oct | Nov | Dec | Year |
| Average high °C (°F) | 7.5 (45.5) |
7.9 (46.2) |
11.1 (52) |
13.8 (56.8) |
17.5 (63.5) |
20.4 (68.7) |
23.1 (73.6) |
22.8 (73) |
19.5 (67.1) |
15.2 (59.4) |
10.5 (50.9) |
7.6 (45.7) |
14.7 (58.5) |
| Average low °C (°F) | 1.4 (34.5) |
1.1 (34) |
3.0 (37.4) |
4.3 (39.7) |
7.3 (45.1) |
10.2 (50.4) |
12.4 (54.3) |
12.2 (54) |
10.0 (50) |
7.2 (45) |
3.9 (39) |
1.7 (35.1) |
6.2 (43.2) |
| Source: Royal Netherlands Meteorological Institute[71] | |||||||||||||
| Climate data for Change in monthly mean temperatures at Cambridge between 1931-1960 and 1981-2010 | |||||||||||||
|---|---|---|---|---|---|---|---|---|---|---|---|---|---|
| Month | Jan | Feb | Mar | Apr | May | Jun | Jul | Aug | Sep | Oct | Nov | Dec | Year |
| Average high °C (°F) | +1.2C | +0.7C | +0.6C | +0.1C | +0.3C | -0.1C | +0.9C | +0.8C | +0.3C | +0.6C | +0.6C | +0.3C | +0.52C |
| Average low °C (°F) | +0.8C | +0.6C | +1.4C | +0.5C | +0.8C | +0.5C | +0.6C | +0.7C | +0.5C | +1.1C | +0.4C | +0.0C | +0.66C |
| Source: Stadtklima[70] | |||||||||||||
Again, a similar warming trend is shown for the South East of England, albeit slightly more pronounced with no month recording a fall in overall mean temperatures.
Monthly temperature extremes
| Climate data for United Kingdom | |||||||||||||
|---|---|---|---|---|---|---|---|---|---|---|---|---|---|
| Month | Jan | Feb | Mar | Apr | May | Jun | Jul | Aug | Sep | Oct | Nov | Dec | Year |
| Record high °C (°F) | 18.3 (64.9) |
19.7 (67.5) |
25.6 (78.1) |
29.4 (84.9) |
32.8 (91) |
35.6 (96.1) |
36.7 (98.1) |
38.5 (101.3) |
35.6 (96.1) |
29.9 (85.8) |
22.4 (72.3) |
18.3 (64.9) |
38.5 (101.3) |
| Average high °C (°F) | 6.4 (43.5) |
6.6 (43.9) |
8.9 (48) |
11.4 (52.5) |
14.7 (58.5) |
17.3 (63.1) |
19.4 (66.9) |
19.1 (66.4) |
16.5 (61.7) |
12.8 (55) |
9.1 (48.4) |
6.7 (44.1) |
12.4 (54.3) |
| Average low °C (°F) | 0.9 (33.6) |
0.7 (33.3) |
2.1 (35.8) |
3.4 (38.1) |
6.0 (42.8) |
8.8 (47.8) |
10.9 (51.6) |
10.8 (51.4) |
8.8 (47.8) |
6.2 (43.2) |
3.3 (37.9) |
1.1 (34) |
5.3 (41.5) |
| Record low °C (°F) | −27.2 (−17) |
−27.2 (−17) |
−22.8 (−9) |
−15.0 (5) |
−9.4 (15.1) |
−5.6 (21.9) |
−2.5 (27.5) |
−4.5 (23.9) |
−6.7 (19.9) |
−11.7 (10.9) |
−23.3 (−9.9) |
−27.2 (−17) |
−27.2 (−17) |
| Source: Met Office[72] | |||||||||||||
| Absolute temperature ranges | ||||||
|---|---|---|---|---|---|---|
| Month | Maximum temperatures | Minimum temperatures | ||||
| °C | °F | Location and date | °C | °F | Location and date | |
| January | 18.3 | 64.9 |
|
−27.2 | −17.0 |
|
| February | 19.7 | 67.5 |
|
−27.2 | −17.0 |
|
| March | 25.6 | 78.1 |
|
−22.8 | −9.0 |
|
| April | 29.4 | 84.9 |
|
−15.0 | 5.0 |
|
| May | 32.8 | 91.0 |
|
−9.4 | 15.1 |
|
| June | 35.6 | 96.1 |
|
−5.6 | 21.9 |
|
| July | 36.7 | 98.1 |
|
−2.5 | 27.5 |
|
| August | 38.5 | 101.3 |
|
−4.5 | 23.9 |
|
| September | 35.6 | 96.1 |
|
−6.7 | 19.9 |
|
| October | 29.9 | 85.8 |
|
−11.7 | 10.9 |
|
| November | 22.4 | 72.3 |
|
−23.3 | −9.9 |
|
| December | 18.3 | 64.9 |
|
−27.2 | −17.0 |
|
A disputed temperature of 42 °C was set at an airfield in Wisley, Surrey on 18 July 2006. It has been suggested that the reading for this temperature should in fact have been 32 °C. It is worth noting that the Met Office expected temperatures to surpass the August 2003 record during the July 2006 heatwave, and it is still speculated that both heatwaves did set higher temperatures than those officially recorded.
Climate change
Central estimates produced by the Met Office predict average annual temperature to increase by 2 °C (4 °F) and the warmest summer day to increase by 3 °C (6 °F) by the 2050s. Average winter rainfall is also likely to increase and most areas will see a slight decrease in annual rainfall.[73]
According to the Met Office, in the UK, the decade from 2000-2009 was the warmest since instrumental record dating started in 1850.[74]
See also
Notes
- ↑ In accordance with World Meteorological Organization (WMO) recommendations, the Met Office maintains long-term averages of the UK climate, based on standard 30-year periods. The latest 30-year period is for1981-2010.
References
- ↑ Peel, M. C.; Finlayson B. L.; McMahon, T. A. (2007). "Updated world map of the Köppen–Geiger climate classification". Hydrol. Earth Syst. Sci. 11: 1633–1644. doi:10.5194/hess-11-1633-2007. ISSN 1027-5606. (direct: Final Revised Paper)
- 1 2 "England averages". Met Office. 2012. Archived from the original on 10 April 2013. Retrieved 6 December 2012.
- 1 2 3 4 5 6 "Manchester 1981-2010 Averages". Met Office. Retrieved 30 January 2016.
- ↑ "Birmingham 1971–2000 & Extremes". KNMI. Retrieved 1 November 2011.
- ↑ "Birmingham 1961–1990 & Extremes". NOAA. Retrieved 1 November 2011.
- ↑ "Manchester Ringway 1961-1990". NOAA. Retrieved 30 January 2016.
- ↑ "Manchester ringway extreme values". KNMI. Retrieved 30 January 2016.
- ↑ "Manchester ringway 1981-2010 mean extreme values". KNMI. Retrieved 2 January 2018.
- ↑ "Shanklin Climatic Averages 1981-2010". Met Office. Retrieved 25 December 2012.
- ↑ "Hurn Climatic Averages 1981–2010". Met Office. Retrieved 23 December 2012.
- 1 2 "N Ireland 1971–2000 averages". Met Office. 2001. Archived from the original on 27 September 2007. Retrieved 14 August 2007.
- 1 2 "Scotland 1971–2000 averages". Met Office. 2001. Archived from the original on 30 April 2004. Retrieved 14 August 2007.
- ↑ Meteo France. "METEO %%% par Météo-France- Prévisions météo du monde gratuites à 10 jours".
- ↑ "Royal Botanic Gardens Edinburgh climate".
- ↑ "UK climate". Archived from the original on 25 March 2013.
- ↑ "UK climate". Archived from the original on 7 October 2012.
- 1 2 3 "Wales 1971–2000 averages". Met Office. 2001. Archived from the original on 29 September 2007. Retrieved 14 August 2007.
- 1 2 "Mean Temperature Spring Average". Met Office. Archived from the original on 27 September 2007. Retrieved 14 August 2007.
- ↑ "National Meteorological Library and Archive Fact sheet 2 — Thunderstorms" (PDF). Met Office UK. Archived from the original (PDF) on 13 August 2014. Retrieved 9 January 2015.
- ↑ "Mean Temperature Summer Average". Met Office. Archived from the original on 9 January 2007. Retrieved 23 March 2007.
- ↑ "Hot spell - August 2003". Met Office.
- ↑ "Archived copy". Archived from the original on 7 April 2012. Retrieved 10 June 2012.
- ↑ https://en.tutiempo.net/climate/10-2002/ws-36090.html
- ↑ "London Weather - 1999 Mild, rather wet, and very thundery". www.london-weather.eu.
- ↑ Jones, Sam (3 October 2011). "UK weather returns to normal after record-breaking heatwave". The Guardian. London.
- ↑ Gayle, Damien (13 September 2016). "UK's hottest September day in 105 years sets 2016 record". the Guardian.
- 1 2 "Mean Temperature Autumn Average". Met Office. Archived from the original on 27 September 2007. Retrieved 14 August 2007.
- 1 2 "Mean Temperature Winter Average". Met Office. Archived from the original on 31 May 2010. Retrieved 14 August 2007.
- ↑ "Hardiness Zone Map for Europe". GardenWeb. 1999. Retrieved 23 December 2007.
- ↑ "Hardiness Zones — Details". United States National Arboretum. 2003. Archived from the original on 17 August 2011. Retrieved 23 December 2007.
- ↑ "January 2016". Met Office.
- ↑ http://www.trevorharley.com/trevorharley/weather_web_pages/british_weather_in_december.htm
- ↑ Harrabin, Roger (25 June 2018). "December warmest and wettest month" – via www.bbc.co.uk.
- 1 2 Office, Met. "UK climate". www.metoffice.gov.uk.
- ↑ "December 2015". Met Office.
- ↑ "UK 1971–2000 averages". Met Office. Archived from the original on 5 July 2009. Retrieved 4 August 2007.
- 1 2 3 4 5 6 7 8 9 10 "Met Office:English Climate". Met Office. Archived from the original on 25 May 2007. Retrieved 4 August 2007.
- ↑ "Sunshine Duration Winter Average". Met Office. Archived from the original on 29 September 2007. Retrieved 4 August 2007.
- ↑ "Sunshine Duration Summer Average". Met Office. Archived from the original on 27 September 2007. Retrieved 4 August 2007.
- 1 2 Seager, Richard (2006). "The Source of Europe's Mild Climate". American Scientist. 94 (4): 334&ndash, 341. doi:10.1511/2006.60.334.
- ↑ Rhines, P.B. and Häkkinen, S. Is the Oceanic Heat Transport in the North Atlantic Irrelevant to the Climate in Europe? Archived 16 July 2007 at the Wayback Machine. OSAF Newsletter, September 2003
- ↑ Britten, Nick (25 June 2018). "Highlands mountain claims strongest UK wind" – via www.telegraph.co.uk.
- ↑ "Archived copy" (PDF). Archived from the original (PDF) on 28 October 2012. Retrieved 11 March 2012.
- ↑ "Rainfall Amount (mm) Annual Average". Met Office. Archived from the original on 19 July 2013. Retrieved 13 April 2008.
- ↑ Clark, Ross (28 October 2006). "The wetter, the better". London: The Independent. Retrieved 2 September 2009.
- ↑ Philip, Catherine (28 July 2005). "40 die as one year's rain falls in a day". London: The Times. Retrieved 2 September 2009.
- ↑ "Mayor of London Environment". Mayor of London. Archived from the original on 7 October 2007. Retrieved 31 July 2008.
- ↑ "East Anglia 1971–2000 averages". Met Office. Archived from the original on 29 September 2007. Retrieved 4 August 2007.
- ↑ McKie, Robin (15 October 2006). "Official: this summer is the longest, hottest ever". London: The Observer. Retrieved 5 November 2006.
- ↑ Carrington, Damian. "December 2015 was the wettest month ever recorded in UK".
- ↑ "December 2015 breaks records". Met Office. Retrieved 5 January 2016.
- ↑ "Met Office: Scottish Climate". Met Office. Archived from the original on 27 May 2007. Retrieved 4 August 2007.
- ↑ "UK climate - Extremes - Met Office". Archived from the original on 20 March 2012.
- ↑ Amy T. Lennard; Neil MacDonald; Janet Hooke. "Analysis of drought characteristics for improved understanding of a water resource system" (PDF). IAHS. Archived from the original (PDF) on 3 March 2016. Retrieved 9 January 2015.
- 1 2 "Days of Thunder Annual Average". Met Office. Archived from the original on 29 September 2007. Retrieved 14 August 2007.
- ↑ "Hailstorm sparks 'absolute chaos'". BBC News. 30 October 2008. Retrieved 30 October 2009.
- ↑ "Deadly storm and tidal surge batter northern Europe". BBC News. 6 December 2013.
- ↑ Harvey J. E. Rodda, Max A. Little, Rose G. Wood, Nina MacDougall, Patrick E. McSharry (2009). A digital archive of extreme rainfalls in the British Isles from 1866 to 1968 based on British Rainfall Archived 22 November 2009 at the Wayback Machine., Weather 64(3):71-75.
- ↑ "Archived copy" (PDF). Archived from the original (PDF) on 25 May 2013. Retrieved 4 June 2013. The coastal temperature network and ferry route programme: long-term temperature and salinity observations, A. E. Joyce, Cefas.
- ↑ "Hurricanes". The BBC. Retrieved 14 April 2009.
- ↑ "TORRO - Tornado FAQ's". www.torro.org.uk.
- ↑ "Why UK is world's 'tornado alley'". 15 September 2010 – via news.bbc.co.uk.
- ↑ Nikolai Dotzek. "An updated estimate of tornado occurrence in Europe" (PDF). Archived from the original (PDF) on 7 April 2004. Retrieved 9 January 2015.
- ↑ "U.S. Tornado Climatology". National Oceanic and Atmospheric Administration. Retrieved 6 July 2014.
- 1 2 "TORRO - British & European Tornado Extremes". www.torro.org.uk.
- 1 2 Doe, Robert K. (2016). Extreme Weather: Forty Years of the Tornado and Storm Research Organisation (TORRO). Chichester: Wiley. pp. 72–74. ISBN 978-1-118-95109-5.
- ↑ Willis, J. H., (1944) Weatherwise, London, George Allen and Unwin.
- ↑ "Belfast 1931-60". Stadtklima. Retrieved 8 May 2011.
- 1 2 "Belfast 1981-2010". KNMI. Retrieved 8 May 2011.
- 1 2 "Cambridge 1931-60". Stadtklima. Retrieved 8 May 2011.
- ↑ "Cambridge 1981-2010". KNMI. Retrieved 8 May 2011.
- ↑ "Climate Records". Met Office. Retrieved 18 June 2017.
- ↑ "UKCP Map". The Met Office. Archived from the original on 5 July 2009. Retrieved 9 December 2009.
- ↑ "Updates to our decadal forecast". The Met Office. Retrieved 27 February 2013.