Atmospheric temperature
Atmospheric temperature is a measure of temperature at different levels of the Earth's atmosphere. It is governed by many factors, including incoming solar radiation, humidity and altitude. When discussing surface air temperature, the annual atmospheric temperature range at any geographical location depends largely upon the type of biome, as measured by the Köppen climate classification.
Temperature versus height

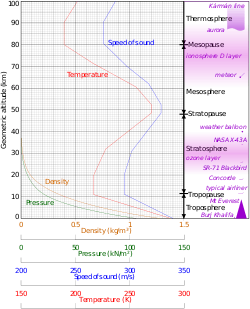
In the Earth's atmosphere, temperature varies greatly at different heights relative to the Earth's surface. The coldest temperatures lie near the mesopause, an area approximately 80 km above the surface. In contrast, some of the warmest temperatures can be found in the thermosphere, which receives strong ionizing radiation at the level of the Van Allen radiation belt.
Temperature varies as one moves vertically upwards from the Earth's surface. It also depends on the change of latitude.
Temperature range
The variation in temperature that occurs from the highs of the day to the cool of nights is called diurnal temperature variation. Temperature ranges can also be based on periods of a month, or a year.
The size of ground-level atmospheric temperature ranges depends on several factors, such as:
- The average temperature
- The average humidity
- The regime of winds (intensity, duration, variation, temperature, etc.)
- The proximity to large bodies of water, such as the sea


The figure at below-left shows an example of monthly temperatures recorded at one of such locations, the city of Campinas, state of São Paulo, Brazil, which lies approximately 60 km north of the Capricorn line (latitude of 22 degrees). Average yearly temperature is 22.4 degrees Celsius, ranging from an average minimum of 12.2 degrees to a maximum of 29.9 degrees. The average temperature range is 11.4 degrees.[2] Variability along the year is small (standard deviation of 2.31 for the maximum monthly average and 4.11 for the minimum). It is easy to see in the graph another typical phenomenon of temperature ranges, which is its increase during winter (lower average air temperature).
In Campinas, for example, the daily temperature range in July (the coolest month of the year) may vary between typically 10 and 24 degrees Celsius (range of 14), while in January, it may range between 20 and 30 degrees Celsius (range of 10).
The effect of latitude, tropical climate, constant gentle wind and sea-side locations show smaller average temperature ranges, smaller variations of temperature, and a higher average temperature (second graph, taken for the same period as Campinas, at Aracaju, capital of the state of Sergipe, also in Brazil, at a latitude of 10 degrees, nearer to the Equator). Average maximum yearly temperature is 28.7 degrees Celsius and average minimum is 21.9. The average temperature range is 5.7 degrees only. Temperature variation along the year in Aracaju is very damped (standard deviation of 1.93 for the maximum temperature and 2.72 for the minimum temperature).[2]
Uses
A location which combines an average temperature of 19 degrees Celsius, 60% average humidity and a temperature range of about 10 degrees Celsius around the average temperature (yearly temperature variation) is considered ideal in terms of comfort for the human species. Most of the places with these characteristics are located in the transition between temperate and tropical climates, approximately around the tropics, particularly in the Southern hemisphere (the tropic of Capricorn).
Lifted Minimum Temperature
The minimum temperature on calm, clear nights has been observed to occur not on the ground, but rather a few tens of centimeters above the ground. The lowest temperature layer is called Ramdas layer after L. A. Ramdas, who first reported this phenomenon in 1932 based on observations at different screen heights at six meteorological centers across India.[3][4] The phenomenon is attributed to the interaction of thermal radiation effects on atmospheric aerosols and convection transfer close to the ground.
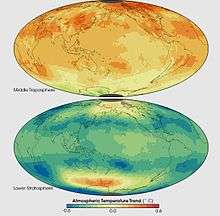
Global temperature
The concept of a global temperature is commonly used in climatology, and denotes the average temperature of the Earth based on surface,[5] near-surface or tropospheric measurements. These temperature records and measurements are typically acquired using the satellite or ground instrumental temperature measurements, then usually compiled using a database or computer model. Long-term global temperatures in paleoclimate are discerned using proxy data.
See also
References
- ↑ Geometric altitude vs. temperature, pressure, density, and the speed of sound derived from the 1962 U.S. Standard Atmosphere.
- 1 2 "Station statistics". Agritempo (in Portuguese). Archived from the original on October 12, 2013. Retrieved October 11, 2013.
- ↑ Ramdas, L.A. and Atmanathan, S., 1932. The vertical distribution of air temperature near the ground at night. Beitrage zur Geophysik, v.37, pp. 116–117.
- ↑ Lake, JV (1955). "The nocturnal heat balance". Nature. 176 (4470). Bibcode:1955Natur.176...32L. doi:10.1038/176032b0.
- ↑ Hansen, James E. "GISS Surface Temperature Analysis (GISTEMP)". National Aeronautic and Space Administration. Goddard Institute for Space Studies. Retrieved 1 September 2011.