Climate of Ireland


The climate of Ireland is mild, moist and changeable with abundant rainfall and a lack of temperature extremes. Ireland's climate is defined as a temperate oceanic climate, or Cfb on the Köppen climate classification system, a classification it shares with most of northwest Europe.[1][2] The country receives generally cool summers and mild winters. It is considerably warmer than other areas on its latitude, because it lies in the northeastern Atlantic Ocean, and as a result is warmed by the North Atlantic Current all year.
As a small island downwind of a large ocean, the climate of Ireland is profoundly impacted by that ocean. The Atlantic overturning circulation, which includes ocean currents such as the North Atlantic Current, moves heat northwards, which is then carried by the prevailing winds towards Ireland.[3]
The prevailing wind blows from the southwest, breaking on the high mountains of the west coast. Rainfall is therefore a particularly prominent part of western Irish life, with Valentia Island, off the west coast of County Kerry, getting almost twice as much annual rainfall as Dublin on the east (1,400 mm or 55.1 in vs. 762 mm or 30.0 in).
January and February are the coldest months of the year, and mean daily air temperatures fall between 4 and 7 °C (39.2 and 44.6 °F) during these months. July and August are the warmest, with mean daily temperatures of 14 to 16 °C (57.2 to 60.8 °F), whilst mean daily maximums in July and August vary from 17 to 18 °C (62.6 to 64.4 °F) near the coast, to 19 to 20 °C (66.2 to 68.0 °F) inland. The sunniest months are May and June, with an average of five to seven hours sunshine per day.[4] Though extreme weather events in Ireland are comparatively rare when compared with other countries in the European Continent, they do occur. Atlantic depressions, occurring mainly in the months of December, January and February, can occasionally bring winds of up to 160 km/h or 99 mph to Western coastal counties, with the winter of 2013/14 being the stormiest on record.[5] During the summer months, and particularly around late July/early August, thunderstorms can develop.[6][7][8]
Temperature
Ireland experiences a lack of temperature extremes compared to other areas at similar latitudes. There is regional variation, with inland areas being cooler in winter and warmer in summer than their coastal counterparts.
The warmest areas are found along the southwest coast. Valentia Island has the highest average temperature, at 10.9 °C.
The coldest areas are found inland. Mullingar has the lowest average temperature, at 9.3 °C
The highest temperature ever recorded in Ireland was 33.3 °C at Kilkenny Castle, on 26 June 1887. The lowest temperature was -19.1 °C at Markree Castle on 16 January 1881.[9]
Six of the warmest ten years in Ireland have occurred since 1990.[10] Due to climate change, it is estimated that the temperatures will rise everywhere of up to 3.4 degrees by the end of the century. [11]
Extreme heat and cold are both rare throughout the country. Summer temperatures exceed 30 °C usually once or twice every decade (2018, 2016, 2013, 2006, 2005, 2003, 1995, 1990, 1989, 1983, 1976 and 1975 are recent examples), although they commonly reach the high 20s most summers, while severe freezes occur only occasionally in winter, with temperatures below -10 °C being very uncommon in the lowlands, and temperatures below freezing uncommon in many coastal areas, although temperatures in the Wicklow Mountains are said to reach -10 °C annually.
| Climate data for Ireland | |||||||||||||
|---|---|---|---|---|---|---|---|---|---|---|---|---|---|
| Month | Jan | Feb | Mar | Apr | May | Jun | Jul | Aug | Sep | Oct | Nov | Dec | Year |
| Record high °C (°F) | 18.5 (65.3) |
18.1 (64.6) |
23.6 (74.5) |
25.8 (78.4) |
28.4 (83.1) |
33.3 (91.9) |
32.3 (90.1) |
31.5 (88.7) |
29.1 (84.4) |
25.2 (77.4) |
20.1 (68.2) |
18.1 (64.6) |
33.3 (91.9) |
| Record low °C (°F) | −19.1 (−2.4) |
−17.8 (0) |
−17.2 (1) |
−7.7 (18.1) |
−5.6 (21.9) |
−3.3 (26.1) |
−0.3 (31.5) |
−2.7 (27.1) |
−3 (27) |
−8.3 (17.1) |
−11.5 (11.3) |
−17.5 (0.5) |
−19.1 (−2.4) |
| Source #1: Met Éireann[9] | |||||||||||||
| Source #2: The Irish Times (November record high)[12] | |||||||||||||
Frost
Air frost occurs frequently in the winter, with most areas seeing over 40 days of air frost every year. In northern areas, air frost occurs on average 10.2 days every January, the month in which air frost occurs most frequently.[13] In the Sperrins and the Glens of Antrim air frost occurs around 80 days a year.[14] The pattern is similar with ground frost, with on average around 100 days of ground frost in the lowlands and over 140 in the mountains.[15]The number of frost days in Ireland have declined massively over the past decade.The largest season decrease has been known to take place in winter.
Frost is rarer along the coast, in urban areas and also in western and southern areas.
Roches Point, County Cork receives the least number of days with air frost, with an average of 7.0 days with air frost recorded annually.[16]
Kilkenny, County Kilkenny receives the highest number of days with air frost, with an average of 53.0 days with air frost recorded annually.[17]
In Dublin, Dublin Airport records air frost on average 24.3 days per year, while Casement Aerodrome (which is further inland) records air frost on average 41.3 days per year.[18][19]
Sunshine
The sunniest months are May and June. During these months sunshine duration averages between 5 and 6½ hours per day over most of the country. The southeast gets the most sunshine, averaging over 7 hours a day in early summer. December is the most overcast month, with an average daily sunshine ranging from about 1 hour in the north to almost 2 hours in the southeast. Over the year as a whole most areas get an average of between 3¼ and 3¾ hours of sunshine each day. Irish skies are completely covered by cloud roughly half of the time.
The sunniest part of the island is the southeast coast. Rosslare, County Wexford is the sunniest area, and receives on average 4.38 hours of sunshine per day (1,598.41 hours per year).[20]
| Climate data for Rosslare, County Wexford, elevation 26m, (1978-2007) | |||||||||||||
|---|---|---|---|---|---|---|---|---|---|---|---|---|---|
| Month | Jan | Feb | Mar | Apr | May | Jun | Jul | Aug | Sep | Oct | Nov | Dec | Year |
| Average high °C (°F) | 8.8 (47.8) |
8.5 (47.3) |
9.9 (49.8) |
11.3 (52.3) |
13.6 (56.5) |
16.3 (61.3) |
18.3 (64.9) |
18.5 (65.3) |
16.8 (62.2) |
14.0 (57.2) |
11.3 (52.3) |
9.5 (49.1) |
13.1 (55.5) |
| Average low °C (°F) | 4.2 (39.6) |
4.1 (39.4) |
5.1 (41.2) |
6.3 (43.3) |
8.6 (47.5) |
11 (52) |
12.7 (54.9) |
13 (55) |
11.6 (52.9) |
9.3 (48.7) |
6.7 (44.1) |
5.2 (41.4) |
8.2 (46.7) |
| Average precipitation mm (inches) | 88.4 (3.48) |
70.8 (2.787) |
69.1 (2.72) |
59.1 (2.327) |
55.7 (2.193) |
54.9 (2.161) |
49.9 (1.965) |
71.6 (2.819) |
75.0 (2.953) |
109.3 (4.303) |
100.9 (3.972) |
100.8 (3.969) |
905.5 (35.649) |
| Average precipitation days (≥ 1 mm) | 12 | 11 | 11 | 9 | 9 | 9 | 8 | 9 | 9 | 13 | 12 | 13 | 125 |
| Mean monthly sunshine hours | 60.34 | 75.72 | 114.14 | 173.88 | 214.86 | 189.9 | 199.45 | 191.1 | 146.07 | 105.53 | 73.34 | 55.2 | 1,599.53 |
| Source #1: Met Éireann | |||||||||||||
| Source #2: European Climate Assessment & Dataset,[21] | |||||||||||||
The cloudiest (i.e. least sunny) parts of the island are generally the west and northwest of the country. However, Birr, County Offaly, in the midlands, is the most cloudy (overcast) station, receiving on average 3.2 hours of sunshine per day, considerably less than the stations at Malin Head in the north or Belmullet in the west.[22] Inland areas tend to receive less sunshine than coastal areas due to the convective development of clouds over land. Cloud develops because of vertical air currents caused by thermal heating of the ground.[23]
| Climate data for Birr, County Offaly, elevation 73m, (1979-2008) | |||||||||||||
|---|---|---|---|---|---|---|---|---|---|---|---|---|---|
| Month | Jan | Feb | Mar | Apr | May | Jun | Jul | Aug | Sep | Oct | Nov | Dec | Year |
| Average high °C (°F) | 8.1 (46.6) |
8.6 (47.5) |
10.3 (50.5) |
12.6 (54.7) |
15.5 (59.9) |
17.8 (64) |
19.6 (67.3) |
19.3 (66.7) |
17.1 (62.8) |
13.6 (56.5) |
10.4 (50.7) |
8.6 (47.5) |
13.5 (56.2) |
| Average low °C (°F) | 2 (36) |
2 (36) |
3.3 (37.9) |
4.3 (39.7) |
6.6 (43.9) |
9.5 (49.1) |
11.6 (52.9) |
11.3 (52.3) |
9.3 (48.7) |
6.6 (43.9) |
4 (39) |
2.7 (36.9) |
6.1 (43) |
| Average precipitation mm (inches) | 78.8 (3.102) |
58.6 (2.307) |
67.4 (2.654) |
55.0 (2.165) |
59.5 (2.343) |
66.5 (2.618) |
59.4 (2.339) |
81.6 (3.213) |
66.4 (2.614) |
94.3 (3.713) |
74.7 (2.941) |
83.8 (3.299) |
846 (33.308) |
| Average precipitation days (≥ 1 mm) | 14 | 11 | 14 | 11 | 12 | 11 | 11 | 12 | 11 | 14 | 13 | 13 | 147 |
| Mean monthly sunshine hours | 47.31 | 63.53 | 89.17 | 136.54 | 159.73 | 134.7 | 124.33 | 125.26 | 107.66 | 88.83 | 57.57 | 42.69 | 1,177.32 |
| Source #1: Met Éireann | |||||||||||||
| Source #2: European Climate Assessment & Dataset,[24] | |||||||||||||
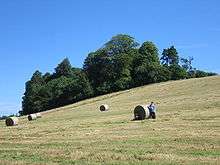
Precipitation
Precipitation
.JPG)
Rainfall is the most common form of precipitation on the island, and is extremely common throughout Ireland, although some parts of the west coast receive over four times as much rain as the east coast. Rainfall in Ireland normally comes from Atlantic frontal systems which travel northeast over the island, bringing cloud and rain. Most of the eastern half of the country has between 750 and 1,000 mm (29.5 and 39.4 in) of rainfall in the year. Rainfall in the west generally averages between 1,000 and 1,250 mm (39.4 and 49.2 in). In many mountainous districts rainfall exceeds 3,000 mm (118.1 in) per year. The wettest months almost everywhere are December and January. April is the driest month generally, but in many southern parts June is the driest.
The average number of "wet days" (days with more than 1 mm (0.039 in) of rain) ranges from about 151 days a year along the east and southeast coasts, to about 225 days a year in parts of the west.
The wettest weather station is Valentia Island, which receives 1,430.1 mm (56.30 in) of rain per year, on average.[25]
The driest weather station is Casement Aerodrome, which receives 711.4 mm (28.01 in) of rain per year, on average.[19]
The weather station with the highest number of "wet days" is Belmullet, with 193 days per year,[26] while the station with the lowest number of "wet days" is Dublin Airport, with 128 days per year.[18]
Rainfall records
Source:[27]
- The driest year recorded in Ireland was 1887, with 356.6 mm (14.04 in) of rain recorded at Glasnevin, County Dublin.
- The longest drought in Ireland occurred in Limerick between 3 April 1938 and 10 May 1938 (37 days).
- The greatest monthly total was 790.0 mm (31.10 in); recorded at the Cummeragh Mountains, County Kerry, in October 1996.
- The greatest annual total was 3,964.9 mm (156.10 in); recorded at Ballaghbeena Gap in 1960.
- The greatest hourly total was 97 mm (3.82 in); recorded at Orra Beg, County Antrim, in August 1980.
- The greatest daily total was 243.5 mm (9.59 in); recorded at Cloone Lake, County Kerry, on 18 September 1993.
Snowfall

Severe cold weather is uncommon in Ireland with the majority of winter precipitation coming in the form of rain, although hills and mountainous regions in the country can commonly see up to 30 days of snowfall annually, with the Wicklow Mountains sometimes seeing 50 or more days of snowfall annually. Most low-lying regions of the island only see a few days of lying snow per year (from December to March inclusive), or may see no snow at all during some winters.
However, there are preparations for snow and ice, including the distribution of grit, salt, and other snow-treatable minerals. In late 2011, the Irish Government set up "Winter-Ready", in order to prepare the country for such severe weather.[28]
Due to the variability of Ireland's weather (which is mainly because of the influence of the Atlantic Ocean, Gulf Stream and North Atlantic Drift, as well as Ireland's northerly latitude and vulnerability to Siberian/Arctic winds) weather during the winter months is difficult to predict, with the aforementioned factors making both extremely low temperatures and relatively mild temperatures possible.
The snowiest weather station is Clones, County Monaghan, which receives, on average, nearly 30 days of snow and/or sleet per year. Of these, 10.8 days have snow lying at 09:00.[29] The least snowy weather station is Valentia Island, County Kerry; which receives, on average, 5.6 days of snow and/or sleet per year. Of these, 0.8 days have snow lying at 09:00.[25]
Hail
Hail, like snow and sleet, is also rare in Ireland; however, it can occur at any time of the year. It is most common in spring during thunderstorms.
Malin Head, County Donegal receives the most hail, with an average of 48.4 days per year.[30]
Roches Point, County Cork receives the least hail, with an average of 8.0 days per year.[31]
Thunderstorms
Thunderstorms are quite rare in Ireland. They are more likely to happen late in summer, although they can occur at any time of the year.
Cork Airport, County Cork experiences the least thunder; receiving it 3.7 days per year on average.[32]
Valentia Island, County Kerry experiences the most thunder; receiving it 7.1 days per year on average.[25]
Wind
Generally, the coast tends to be windier than inland areas; and the west tends to be windier than the east.
The station with the highest mean wind speed is Malin Head, County Donegal; averaging at 16.3 kn (30.2 km/h; 18.8 mph). Malin Head also receives the most gale-force winds, recording them on average 66.0 days per year.[30]
The station with the lowest mean wind speed is Kilkenny, County Kilkenny; averaging at 6.5 kn (12.0 km/h; 7.5 mph).[17]
The station that records the lowest number of gale-force winds is Birr, County Offaly; recording them on average 1.2 days per year.[33]
The highest wind speed ever recorded in Ireland was 103 kn (191 km/h; 119 mph) at Fastnet Lighthouse, County Cork on 16 October 2017.[27]
Tornadoes are very rare in Ireland, with around less than ten reported every year - mostly in August.[34]
Fog
Fog is more common inland and on higher altitudes; mainly during winter and during the morning at times of high pressure.
The foggiest station is that at Cork Airport, County Cork, which has 99.5 days of fog per year.[32]
The least foggy station is that at Valentia Island, County Kerry, which has 8.9 days of fog per year.[25]
Visibility
Visibility is generally very good, because of the proximity of industry to the coast, allowing breezes to disperse any smog.[35] Mist and fog often occur, as well as coastal fog in the east,[36] but it is generally not long-lasting. However, in winter, it can be slow to clear.[35]
Climate charts
| Belmullet (1981-2010) | ||||||||||||||||||||||||||||||||||||||||||||||||||||||||||||
|---|---|---|---|---|---|---|---|---|---|---|---|---|---|---|---|---|---|---|---|---|---|---|---|---|---|---|---|---|---|---|---|---|---|---|---|---|---|---|---|---|---|---|---|---|---|---|---|---|---|---|---|---|---|---|---|---|---|---|---|---|
| Climate chart (explanation) | ||||||||||||||||||||||||||||||||||||||||||||||||||||||||||||
| ||||||||||||||||||||||||||||||||||||||||||||||||||||||||||||
| ||||||||||||||||||||||||||||||||||||||||||||||||||||||||||||
| Birr (1979-2008) | ||||||||||||||||||||||||||||||||||||||||||||||||||||||||||||
|---|---|---|---|---|---|---|---|---|---|---|---|---|---|---|---|---|---|---|---|---|---|---|---|---|---|---|---|---|---|---|---|---|---|---|---|---|---|---|---|---|---|---|---|---|---|---|---|---|---|---|---|---|---|---|---|---|---|---|---|---|
| Climate chart (explanation) | ||||||||||||||||||||||||||||||||||||||||||||||||||||||||||||
| ||||||||||||||||||||||||||||||||||||||||||||||||||||||||||||
| ||||||||||||||||||||||||||||||||||||||||||||||||||||||||||||
| Casement Aerodrome (1981-2010) | ||||||||||||||||||||||||||||||||||||||||||||||||||||||||||||
|---|---|---|---|---|---|---|---|---|---|---|---|---|---|---|---|---|---|---|---|---|---|---|---|---|---|---|---|---|---|---|---|---|---|---|---|---|---|---|---|---|---|---|---|---|---|---|---|---|---|---|---|---|---|---|---|---|---|---|---|---|
| Climate chart (explanation) | ||||||||||||||||||||||||||||||||||||||||||||||||||||||||||||
| ||||||||||||||||||||||||||||||||||||||||||||||||||||||||||||
| ||||||||||||||||||||||||||||||||||||||||||||||||||||||||||||
| Clones (1978-2007) | ||||||||||||||||||||||||||||||||||||||||||||||||||||||||||||
|---|---|---|---|---|---|---|---|---|---|---|---|---|---|---|---|---|---|---|---|---|---|---|---|---|---|---|---|---|---|---|---|---|---|---|---|---|---|---|---|---|---|---|---|---|---|---|---|---|---|---|---|---|---|---|---|---|---|---|---|---|
| Climate chart (explanation) | ||||||||||||||||||||||||||||||||||||||||||||||||||||||||||||
| ||||||||||||||||||||||||||||||||||||||||||||||||||||||||||||
| ||||||||||||||||||||||||||||||||||||||||||||||||||||||||||||
| Cork Airport (1981-2010) | ||||||||||||||||||||||||||||||||||||||||||||||||||||||||||||
|---|---|---|---|---|---|---|---|---|---|---|---|---|---|---|---|---|---|---|---|---|---|---|---|---|---|---|---|---|---|---|---|---|---|---|---|---|---|---|---|---|---|---|---|---|---|---|---|---|---|---|---|---|---|---|---|---|---|---|---|---|
| Climate chart (explanation) | ||||||||||||||||||||||||||||||||||||||||||||||||||||||||||||
| ||||||||||||||||||||||||||||||||||||||||||||||||||||||||||||
| ||||||||||||||||||||||||||||||||||||||||||||||||||||||||||||
| Dublin Airport (1981-2010) | ||||||||||||||||||||||||||||||||||||||||||||||||||||||||||||
|---|---|---|---|---|---|---|---|---|---|---|---|---|---|---|---|---|---|---|---|---|---|---|---|---|---|---|---|---|---|---|---|---|---|---|---|---|---|---|---|---|---|---|---|---|---|---|---|---|---|---|---|---|---|---|---|---|---|---|---|---|
| Climate chart (explanation) | ||||||||||||||||||||||||||||||||||||||||||||||||||||||||||||
| ||||||||||||||||||||||||||||||||||||||||||||||||||||||||||||
| ||||||||||||||||||||||||||||||||||||||||||||||||||||||||||||
| Kilkenny (1978-2007) | ||||||||||||||||||||||||||||||||||||||||||||||||||||||||||||
|---|---|---|---|---|---|---|---|---|---|---|---|---|---|---|---|---|---|---|---|---|---|---|---|---|---|---|---|---|---|---|---|---|---|---|---|---|---|---|---|---|---|---|---|---|---|---|---|---|---|---|---|---|---|---|---|---|---|---|---|---|
| Climate chart (explanation) | ||||||||||||||||||||||||||||||||||||||||||||||||||||||||||||
| ||||||||||||||||||||||||||||||||||||||||||||||||||||||||||||
| ||||||||||||||||||||||||||||||||||||||||||||||||||||||||||||
| Malin Head (1981-2010) | ||||||||||||||||||||||||||||||||||||||||||||||||||||||||||||
|---|---|---|---|---|---|---|---|---|---|---|---|---|---|---|---|---|---|---|---|---|---|---|---|---|---|---|---|---|---|---|---|---|---|---|---|---|---|---|---|---|---|---|---|---|---|---|---|---|---|---|---|---|---|---|---|---|---|---|---|---|
| Climate chart (explanation) | ||||||||||||||||||||||||||||||||||||||||||||||||||||||||||||
| ||||||||||||||||||||||||||||||||||||||||||||||||||||||||||||
| ||||||||||||||||||||||||||||||||||||||||||||||||||||||||||||
| Mullingar (1979-2008) | ||||||||||||||||||||||||||||||||||||||||||||||||||||||||||||
|---|---|---|---|---|---|---|---|---|---|---|---|---|---|---|---|---|---|---|---|---|---|---|---|---|---|---|---|---|---|---|---|---|---|---|---|---|---|---|---|---|---|---|---|---|---|---|---|---|---|---|---|---|---|---|---|---|---|---|---|---|
| Climate chart (explanation) | ||||||||||||||||||||||||||||||||||||||||||||||||||||||||||||
| ||||||||||||||||||||||||||||||||||||||||||||||||||||||||||||
| ||||||||||||||||||||||||||||||||||||||||||||||||||||||||||||
| Rosslare (1978-2007) | ||||||||||||||||||||||||||||||||||||||||||||||||||||||||||||
|---|---|---|---|---|---|---|---|---|---|---|---|---|---|---|---|---|---|---|---|---|---|---|---|---|---|---|---|---|---|---|---|---|---|---|---|---|---|---|---|---|---|---|---|---|---|---|---|---|---|---|---|---|---|---|---|---|---|---|---|---|
| Climate chart (explanation) | ||||||||||||||||||||||||||||||||||||||||||||||||||||||||||||
| ||||||||||||||||||||||||||||||||||||||||||||||||||||||||||||
| ||||||||||||||||||||||||||||||||||||||||||||||||||||||||||||
| Shannon Airport (1981-2010) | ||||||||||||||||||||||||||||||||||||||||||||||||||||||||||||
|---|---|---|---|---|---|---|---|---|---|---|---|---|---|---|---|---|---|---|---|---|---|---|---|---|---|---|---|---|---|---|---|---|---|---|---|---|---|---|---|---|---|---|---|---|---|---|---|---|---|---|---|---|---|---|---|---|---|---|---|---|
| Climate chart (explanation) | ||||||||||||||||||||||||||||||||||||||||||||||||||||||||||||
| ||||||||||||||||||||||||||||||||||||||||||||||||||||||||||||
| ||||||||||||||||||||||||||||||||||||||||||||||||||||||||||||
| Valentia Island (1981-2010) | ||||||||||||||||||||||||||||||||||||||||||||||||||||||||||||
|---|---|---|---|---|---|---|---|---|---|---|---|---|---|---|---|---|---|---|---|---|---|---|---|---|---|---|---|---|---|---|---|---|---|---|---|---|---|---|---|---|---|---|---|---|---|---|---|---|---|---|---|---|---|---|---|---|---|---|---|---|
| Climate chart (explanation) | ||||||||||||||||||||||||||||||||||||||||||||||||||||||||||||
| ||||||||||||||||||||||||||||||||||||||||||||||||||||||||||||
| ||||||||||||||||||||||||||||||||||||||||||||||||||||||||||||
See also
References
- ↑ Peel, M. C.; Finlayson B. L.; McMahon, T. A. (2007). "Updated world map of the Köppen–Geiger climate classification". Hydrol. Earth Syst. Sci. 11: 1633–1644. doi:10.5194/hess-11-1633-2007. ISSN 1027-5606. (direct: Final Revised Paper)
- ↑ "Marine Climatology". Met Éireann. Retrieved 30 January 2008.
- ↑ McCarthy, G. D., Gleeson, E. and Walsh, S. (2015) The influence of the Ocean on the Climate of Ireland. Weather. 70, 8, 242–245, http://onlinelibrary.wiley.com/doi/10.1002/wea.2543/abstract
- ↑ "Sunshine in Ireland". Met Éireann. Retrieved 23 January 2008.
- ↑ Matthews, T., C. Murphy, R. L. Wilby and S. Harrigan (2014) Stormiest winter on record for Ireland and UK. Nature Climate Change, 4, 738-740.
- ↑ "Evidence of winter storms". Independent Newspapers. Retrieved 4 February 2016.
- ↑ "Evidence of storms". Irish Examiner. Retrieved 4 February 2016.
- ↑ "July Thunderstorm" (PDF). Met Éireann. Retrieved 4 February 2016.
- 1 2 "Irish Weather Extremes". Met Éireann. Archived from the original on 16 December 2016. Retrieved 15 December 2016.
- ↑ Environmental Protection Agency (2017). "What impact will climate change have for Ireland". EPA.
- ↑ Murphy, Conor; Fealy, Rowan (2010). "Climate Change Impacts for Ireland Part 2: Changes in Key Climatic Variables" (PDF). Geographical Viewpoint. 38: 31. Retrieved 11 Jan 2018.
- ↑ Dan Griffin (2015-11-02). "Balmy start to November sees record temperatures". Irish Times. Retrieved 2015-11-02.
- ↑ "N Ireland 1971-2000 averages". Meteorological Office. Archived from the original on 27 September 2007. Retrieved 17 May 2008.
- ↑ "Days of Air Frost 1971-2000". Meteorological Office. Archived from the original on 5 July 2007. Retrieved 2008-05-18.
- ↑ "Days of Ground Frost 1971-2000". Meteorological Office. Archived from the original on 9 January 2007. Retrieved 18 May 2008.
- ↑ Met Éireann - Roches Point (30 Year Averages)
- 1 2 Met Éireann - Kilkenny (30 Year Averages)
- 1 2 Met Éireann - Dublin Airport (30 Year Averages)
- 1 2 Met Éireann - Casement Aerodrome (30 Year Averages)
- ↑
- ↑ "Climatological Information for Rosslare, Ireland". European Climate Assessment & Dataset.
- ↑
- ↑
- ↑ "Climatological Information for Birr, Ireland". European Climate Assessment & Dataset.
- 1 2 3 4 Met Éireann - Valentia Observatory (30 Year Averages)
- ↑ Met Éireann - Belmullet (30 Year Averages)
- 1 2 http://www.met.ie/climate-ireland/weather-extremes.asp
- ↑ "News". Shatter launches Winter Ready campaign. Irish Government News Service. Retrieved 1 December 2011.
- ↑ Met Éireann - Mullingar (30 Year Averages)
- 1 2 Met Éireann - Malin Head (30 Year Averages)
- ↑ Met Éireann - Roche's Point (30 Year Averages)
- 1 2 Met Éireann - Cork Airport (30 Year Averages)
- ↑ Met Éireann - Birr (30 Year Averages)
- ↑ BreakingNews.ie - Yesterday’s tornados ‘almost unheard of’
- 1 2 "Met Office:Northern Ireland climate". Meteorological Office. Archived from the original on 29 September 2007. Retrieved 2008-05-17.
- ↑ "Northern Ireland: Climate". Encyclopædia Britannica. Retrieved 2008-05-17.
External links
Weather events in Ireland | ||
|---|---|---|
| Coldwaves |  | |
| Floods |
| |
| Heat waves | ||
| Windstorms | ||