New Brunswick Southwest
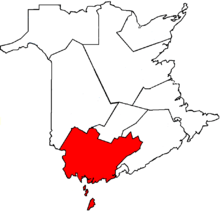 New Brunswick Southwest in relation to other New Brunswick federal electoral districts | |||
| Coordinates: | 45°30′11″N 66°49′05″W / 45.503°N 66.818°W | ||
| Federal electoral district | |||
| Legislature | House of Commons | ||
| MP |
Liberal | ||
| District created | 1996 | ||
| First contested | 1997 | ||
| Last contested | 2015 | ||
| District webpage | profile, map | ||
| Demographics | |||
| Population (2011)[1] | 66,197 | ||
| Electors (2015) | 51,004 | ||
| Area (km²)[2] | 10,770 | ||
| Pop. density (per km²) | 6.1 | ||
| Census divisions | Charlotte, Kings, Queens, Sunbury, York | ||
| Census subdivisions | Grand Bay–Westfield, St. George, St. Stephen, Kingsclear, Studholm | ||
New Brunswick Southwest (French: Nouveau-Brunswick-Sud-Ouest; formerly known as Charlotte and St. Croix—Belleisle) is a federal electoral district in New Brunswick, Canada, that has been represented in the House of Commons of Canada since 2004. Its population in 2006 was 63,232.
Geography
As the name implies, the district comprises the southwestern portion of New Brunswick. It includes all of Charlotte County and portions of York, Sunbury, Queens, Kings and Saint John Counties.
Major towns include St. Stephen, St. Andrews, St. George, Grand Bay–Westfield, McAdam, Harvey Station, Fredericton Junction, Gagetown, and the Kingsclear and Hanwell regions near Fredericton.
The neighbouring ridings are Tobique—Mactaquac, Fredericton, Fundy Royal, and Saint John.
Demographics
- According to the Canada 2011 Census; 2013 representation[3][4]
Ethnic groups: 97.1% White, 1.9% Aboriginal
Languages: 94.4% English, 4.1% French
Religions: 79.8% Christian (22.7% Catholic, 16.2% Baptist, 13.3% Anglican, 10.0% United Church, 5.8% Pentecostal, 2.2% Presbyterian, 9.6% Other), 19.8% No religion
Median income (2010): $27,133
Average income (2010): $34,743
History
"Charlotte" riding was created in 1867. In 1966, it was merged into Carleton—Charlotte.
"Charlotte" riding was re-created in 1996 primarily from Carleton—Charlotte, and incorporating parts of Fundy—Royal, Saint John, and Fredericton—York—Sunbury ridings. Shortly after the 1997 election, the riding became known as "New Brunswick Southwest".
The 2003 redistribution abolished New Brunswick Southwest. The territory of the riding was combined with the area around Belleisle Bay in south-central New Brunswick), and named "St. Croix—Belleisle". This riding was renamed "New Brunswick Southwest" in 2004.
The 2012 federal electoral redistribution will see this riding gain territory from Fredericton, and lose small portions to Fredericton and Fundy Royal.
| Historical population | ||
|---|---|---|
| Year | Pop. | ±% |
| 2001 | 63,529 | — |
| 2006 | 63,232 | −0.5% |
| 2011 | 63,618 | +0.6% |
Members of Parliament
This riding has elected the following Members of Parliament:
Election results
New Brunswick Southwest, 2013 Representation Order
This riding will gain territory from Fredericton, and lose small portions to Fredericton and Fundy Royal for the 42nd Canadian federal election.
| Canadian federal election, 2015 | ||||||||
|---|---|---|---|---|---|---|---|---|
| Party | Candidate | Votes | % | ±% | Expenditures | |||
| Liberal | Karen Ludwig | 16,656 | 43.92 | +30.36 | $58,390.36 | |||
| Conservative | John Williamson | 14,625 | 38.56 | -18.10 | $115,782.35 | |||
| New Democratic | Andrew Graham | 4,768 | 12.57 | -10.74 | $14,930.22 | |||
| Green | Gayla MacIntosh | 1,877 | 4.95 | -0.15 | $1,331.74 | |||
| Total valid votes/Expense limit | 37,926 | 100.00 | $198,596.97 | |||||
| Total rejected ballots | 220 | 0.58 | – | |||||
| Turnout | 38,146 | 74.25 | – | |||||
| Eligible voters | 51,376 | |||||||
| Liberal gain from Conservative | Swing | +24.23 | ||||||
| Source: Elections Canada[5][6] | ||||||||
| 2011 federal election redistributed results[7] | |||
|---|---|---|---|
| Party | Vote | % | |
| Conservative | 18,701 | 56.66 | |
| New Democratic | 7,693 | 23.31 | |
| Liberal | 4,476 | 13.56 | |
| Green | 1,682 | 5.10 | |
| Others | 453 | 1.37 | |
New Brunswick Southwest, 2003 Representation Order
| Canadian federal election, 2011 | ||||||||
|---|---|---|---|---|---|---|---|---|
| Party | Candidate | Votes | % | ±% | Expenditures | |||
| Conservative | John Williamson | 18,066 | 56.64 | -1.68 | $46,347.59 | |||
| New Democratic | Andrew Graham | 7,413 | 23.24 | +6.69 | $7,703.67 | |||
| Liberal | Kelly Wilson | 4,320 | 13.54 | -6.03 | $25,159.26 | |||
| Green | Janice Harvey | 1,646 | 5.16 | -0.40 | $7,546.35 | |||
| Christian Heritage | Jason Farris | 450 | 1.41 | – | $2,698.60 | |||
| Total valid votes/Expense limit | 31,895 | 100.0 | $81,201.04 | |||||
| Total rejected, unmarked and declined ballots | 188 | 0.59 | -0.01 | |||||
| Turnout | 32,083 | 64.71 | +3.54 | |||||
| Eligible voters | 49,578 | |||||||
| Conservative hold | Swing | -4.18 | ||||||
| Sources:[8][9] | ||||||||
| Canadian federal election, 2008 | ||||||||
|---|---|---|---|---|---|---|---|---|
| Party | Candidate | Votes | % | ±% | Expenditures | |||
| Conservative | Greg Thompson | 17,474 | 58.32 | +3.52 | $40,981.82 | |||
| Liberal | Nancy MacIntosh | 5,863 | 19.57 | -7.22 | $19,548.24 | |||
| New Democratic | Andrew Graham | 4,958 | 16.55 | +0.92 | $4,704.82 | |||
| Green | Robert Wayne Boucher | 1,667 | 5.56 | +2.78 | $33.90 | |||
| Total valid votes/Expense limit | 29,962 | 100.0 | $78,512 | |||||
| Total rejected, unmarked and declined ballots | 180 | 0.60 | -0.03 | |||||
| Turnout | 30,142 | 61.17 | -5.62 | |||||
| Eligible voters | 49,273 | |||||||
| Conservative hold | Swing | +5.37 | ||||||
| Canadian federal election, 2006 | ||||||||
|---|---|---|---|---|---|---|---|---|
| Party | Candidate | Votes | % | ±% | Expenditures | |||
| Conservative | Greg Thompson | 18,155 | 54.80 | +1.74 | $32,170.17 | |||
| Liberal | Stan Smith | 8,877 | 26.79 | -4.72 | $21,541.46 | |||
| New Democratic | Andrew Graham | 5,178 | 15.63 | +3.94 | 3,438.46 | |||
| Green | Erik Millett | 922 | 2.78 | -0.34 | $0.50 | |||
| Total valid votes/Expense limit | 33,132 | 100.0 | $73,312 | |||||
| Total rejected, unmarked and declined ballots | 210 | 0.63 | ||||||
| Turnout | 33,342 | 66.79 | ||||||
| Eligible voters | 49,921 | |||||||
| Conservative hold | Swing | +3.23 | ||||||
St. Croix—Belleisle, 2003 Representation Order
| Canadian federal election, 2004 | ||||||||
|---|---|---|---|---|---|---|---|---|
| Party | Candidate | Votes | % | ±% | Expenditures | |||
| Conservative | Greg Thompson | 16,339 | 53.06 | -14.48 | $41,476.00 | |||
| Liberal | Jim Dunlap | 9,702 | 31.51 | +3.25 | $55,323.96 | |||
| New Democratic | Patrick Webber | 3,600 | 11.69 | +7.49 | $81.90 | |||
| Green | Erik Millett | 960 | 3.12 | – | $797.55 | |||
| Canadian Action | David Szemerda | 194 | 0.63 | – | none listed | |||
| Total valid votes/Expense limit | 30,795 | 100.0 | $71,262 | |||||
| Total rejected, unmarked and declined ballots | 216 | 0.70 | ||||||
| Turnout | 31,011 | 62.23 | -5.12 | |||||
| Eligible voters | 49,834 | |||||||
| Conservative notional gain from Progressive Conservative | Swing | -8.86 | ||||||
| Changes from 2000 are based on redistributed results. Change for the Conservative Party is based on the combined totals of the Progressive Conservative Party and the Canadian Alliance. | ||||||||
| 2000 federal election redistributed results | |||
|---|---|---|---|
| Party | Vote | % | |
| Progressive Conservative | 14,900 | 46.23 | |
| Liberal | 9,107 | 28.26 | |
| Alliance | 6,869 | 21.31 | |
| New Democratic | 1,353 | 4.20 | |
New Brunswick Southwest, 1996 Representation Order
| Canadian federal election, 2000 | ||||||||
|---|---|---|---|---|---|---|---|---|
| Party | Candidate | Votes | % | ±% | ||||
| Progressive Conservative | Greg Thompson | 14,489 | 47.2 | +2.3 | ||||
| Liberal | Winston Gamblin | 8,442 | 27.5 | +1.8 | ||||
| Alliance | John Erbs | 6,562 | 21.4 | +0.4 | ||||
| New Democratic | Habib Kilisli | 1,173 | 3.8 | -3.6 | ||||
| Total valid votes | 30,666 | 100.0 | ||||||
Charlotte, 1996 Representation Order
| Canadian federal election, 1997 | ||||||||
|---|---|---|---|---|---|---|---|---|
| Party | Candidate | Votes | % | |||||
| Progressive Conservative | Greg Thompson | 14,533 | 44.9 | |||||
| Liberal | Harold Culbert | 8,309 | 25.7 | |||||
| Reform | Eric Banks | 6,814 | 21.0 | |||||
| New Democratic | Rob Rainer | 2,397 | 7.4 | |||||
| Natural Law | Thomas Mitchell | 280 | 0.9 | |||||
| Total valid votes | 32,333 | 100.0 | ||||||
Charlotte, historical elections
| Canadian federal election, 1965 | ||||||||
|---|---|---|---|---|---|---|---|---|
| Party | Candidate | Votes | % | ±% | ||||
| Liberal | Allan McLean | 6,279 | 50.8 | -2.2 | ||||
| Progressive Conservative | Caldwell Stewart | 5,226 | 45.2 | +0.6 | ||||
| New Democratic | George Cogswell | 462 | 4.0 | +3.0 | ||||
| Total valid votes | 11,967 | 100.0 | ||||||
| Canadian federal election, 1963 | ||||||||
|---|---|---|---|---|---|---|---|---|
| Party | Candidate | Votes | % | ±% | ||||
| Liberal | Allan McLean | 6,279 | 53.0 | +2.0 | ||||
| Progressive Conservative | Norman Buchanan | 5,284 | 44.6 | -1.1 | ||||
| Social Credit | David Cormack | 159 | 1.3 | * | ||||
| New Democratic | George Cogswell | 118 | 1.0 | -2.3 | ||||
| Total valid votes | 11,840 | 100.0 | ||||||
| Canadian federal election, 1962 | ||||||||
|---|---|---|---|---|---|---|---|---|
| Party | Candidate | Votes | % | ±% | ||||
| Liberal | Allan McLean | 6,159 | 51.0 | +3.6 | ||||
| Progressive Conservative | Caldwell Stewart | 5,518 | 45.7 | -6.9 | ||||
| New Democratic | Robert Bontaine | 396 | 3.3 | * | ||||
| Total valid votes | 12,073 | 100.0 | ||||||
| Canadian federal election, 1958 | ||||||||
|---|---|---|---|---|---|---|---|---|
| Party | Candidate | Votes | % | ±% | ||||
| Progressive Conservative | Caldwell Stewart | 5,756 | 52.6 | +5.2 | ||||
| Liberal | Wesley Stuart | 5,806 | 47.4 | -5.2 | ||||
| Total valid votes | 11,562 | 100.0 | ||||||
| Canadian federal election, 1957 | ||||||||
|---|---|---|---|---|---|---|---|---|
| Party | Candidate | Votes | % | ±% | ||||
| Liberal | Wesley Stuart | 6,393 | 52.6 | +0.2 | ||||
| Progressive Conservative | Lorne B. Groom | 5,756 | 47.4 | +3.3 | ||||
| Total valid votes | 12,149 | 100.0 | ||||||
| Canadian federal election, 1953 | ||||||||
|---|---|---|---|---|---|---|---|---|
| Party | Candidate | Votes | % | ±% | ||||
| Liberal | Wesley Stuart | 6,155 | 52.4 | +2.2 | ||||
| Progressive Conservative | Hardy N. Ganong | 5,180 | 44.1 | -5.4 | ||||
| Co-operative Commonwealth | Tom William Jones | 416 | 3.5 | * | ||||
| Total valid votes | 11,751 | 100.0 | ||||||
| Canadian federal election, 1949 | ||||||||
|---|---|---|---|---|---|---|---|---|
| Party | Candidate | Votes | % | ±% | ||||
| Liberal | Wesley Stuart | 6,197 | 50.2 | +0.1 | ||||
| Progressive Conservative | Hardy N. Ganong | 6,139 | 49.8 | -0.1 | ||||
| Total valid votes | 12,336 | 100.0 | ||||||
| Canadian federal election, 1945 | ||||||||
|---|---|---|---|---|---|---|---|---|
| Party | Candidate | Votes | % | ±% | ||||
| Liberal | Wesley Stuart | 5,486 | 50.1 | -8.0 | ||||
| Progressive Conservative | Chauncey Randall Pollard | 5,456 | 49.9 | +8.0 | ||||
| Total valid votes | 10,942 | 100.0 | ||||||
| Canadian federal election, 1940 | ||||||||
|---|---|---|---|---|---|---|---|---|
| Party | Candidate | Votes | % | ±% | ||||
| Liberal | Burton M. Hill | 6,099 | 58.1 | +6.6 | ||||
| Conservative | Walter DeWolfe | 4,391 | 41.9 | +9.8 | ||||
| Total valid votes | 10,490 | 100.0 | ||||||
| Canadian federal election, 1935 | ||||||||
|---|---|---|---|---|---|---|---|---|
| Party | Candidate | Votes | % | ±% | ||||
| Liberal | Burton M. Hill | 5,436 | 51.5 | +9.3 | ||||
| Conservative | Chauncey Randall Pollard | 3,386 | 32.1 | -25.7 | ||||
| Reconstruction | Walter Quartermain | 1,732 | 16.4 | * | ||||
| Total valid votes | 10,554 | 100.0 | ||||||
| Canadian federal election, 1930 | ||||||||
|---|---|---|---|---|---|---|---|---|
| Party | Candidate | Votes | % | ±% | ||||
| Conservative | Arthur D. Ganong | 5,595 | 57.8 | +0.3 | ||||
| Liberal | John Scovil | 4,092 | 42.2 | -0.3 | ||||
| Total valid votes | 9,687 | 100.0 | ||||||
| Canadian federal election, 1926 | ||||||||
|---|---|---|---|---|---|---|---|---|
| Party | Candidate | Votes | % | ±% | ||||
| Conservative | Robert Watson Grimmer | 4,967 | 57.5 | -4.9 | ||||
| Liberal | Elmer McLaughlin | 3,677 | 42.5 | +4.9 | ||||
| Total valid votes | 8,644 | 100.0 | ||||||
| Canadian federal election, 1925 | ||||||||
|---|---|---|---|---|---|---|---|---|
| Party | Candidate | Votes | % | ±% | ||||
| Conservative | Robert Watson Grimmer | 5,202 | 62.4 | +11.8 | ||||
| Liberal | William Albert Holt | 3,274 | 37.6 | -11.8 | ||||
| Total valid votes | 8,476 | 100.0 | ||||||
| Canadian federal election, 1921 | ||||||||
|---|---|---|---|---|---|---|---|---|
| Party | Candidate | Votes | % | ±% | ||||
| Conservative | Robert Watson Grimmer | 5,202 | 50.6 | -4.6 | ||||
| Liberal | William F. Todd | 5,069 | 49.4 | +4.6 | ||||
| Total valid votes | 10,271 | 100.0 | ||||||
| Canadian federal election, 1917 | ||||||||
|---|---|---|---|---|---|---|---|---|
| Party | Candidate | Votes | % | ±% | ||||
| Government (Unionist) | Thomas Aaron Hartt | 3,248 | 55.2 | +3.2 | ||||
| Opposition (Laurier Liberals) | William F. Todd | 2,489 | 44.8 | -3.3 | ||||
| Total valid votes | 5,737 | 100.0 | ||||||
| Canadian federal election, 1911 | ||||||||
|---|---|---|---|---|---|---|---|---|
| Party | Candidate | Votes | % | ±% | ||||
| Conservative | Thomas Aaron Hartt | 2,685 | 51.9 | +3.8 | ||||
| Liberal | William F. Todd | 2,489 | 48.1 | -3.9 | ||||
| Total valid votes | 5,174 | 100.0 | ||||||
| Canadian federal election, 1908 | ||||||||
|---|---|---|---|---|---|---|---|---|
| Party | Candidate | Votes | % | ±% | ||||
| Liberal | William F. Todd | 2,691 | 51.9 | +4.5 | ||||
| Conservative | Gilbert White Ganong | 2,491 | 48.1 | -4.5 | ||||
| Total valid votes | 5,182 | 100.0 | ||||||
| Canadian federal election, 1904 | ||||||||
|---|---|---|---|---|---|---|---|---|
| Party | Candidate | Votes | % | ±% | ||||
| Conservative | Gilbert White Ganong | 2,574 | 52.6 | -3.2 | ||||
| Liberal | Daniel Gillmor | 2,320 | 47.4 | +3.2 | ||||
| Total valid votes | 4,894 | 100.0 | ||||||
| Canadian federal election, 1900 | ||||||||
|---|---|---|---|---|---|---|---|---|
| Party | Candidate | Votes | % | ±% | ||||
| Conservative | Gilbert White Ganong | 2,785 | 55.8 | +0.5 | ||||
| Liberal | Robert Armstrong | 2,205 | 44.2 | -0.5 | ||||
| Total valid votes | 4,990 | 100.0 | ||||||
| Canadian federal election, 1896 | ||||||||
|---|---|---|---|---|---|---|---|---|
| Party | Candidate | Votes | % | ±% | ||||
| Conservative | Gilbert White Ganong | 2,453 | 55.3 | +8.7 | ||||
| Liberal | Arthur Hill Gillmor | 1,981 | 44.7 | -8.7 | ||||
| Total valid votes | 4,434 | 100.0 | ||||||
| Canadian federal election, 1891 | ||||||||
|---|---|---|---|---|---|---|---|---|
| Party | Candidate | Votes | % | ±% | ||||
| Liberal | Arthur Hill Gillmor | 1,934 | 53.4 | +2.3 | ||||
| Conservative | George J. Clarke | 1,686 | 46.6 | -2.3 | ||||
| Total valid votes | 3,620 | 100.0 | ||||||
| Canadian federal election, 1887 | ||||||||
|---|---|---|---|---|---|---|---|---|
| Party | Candidate | Votes | % | ±% | ||||
| Liberal | Arthur Hill Gillmor | 1,892 | 51.1 | -4.5 | ||||
| Conservative | John D. Chipman | 1,811 | 48.9 | +4.5 | ||||
| Total valid votes | 3,703 | 100.0 | ||||||
| Canadian federal election, 1882 | ||||||||
|---|---|---|---|---|---|---|---|---|
| Party | Candidate | Votes | % | ±% | ||||
| Liberal | Arthur Hill Gillmor | 1,558 | 55.6 | +1.4 | ||||
| Conservative | B. R. Stevenson | 1,244 | 44.4 | -1.4 | ||||
| Total valid votes | 2,802 | 100.0 | ||||||
| Canadian federal election, 1878 | ||||||||
|---|---|---|---|---|---|---|---|---|
| Party | Candidate | Votes | % | ±% | ||||
| Liberal | Arthur Hill Gillmor | 1,522 | 54.2 | -1.2 | ||||
| Conservative | John McAdam | 1,284 | 45.8 | +1.2 | ||||
| Total valid votes | 2,806 | 100.0 | ||||||
| Canadian federal election, 1874 | ||||||||
|---|---|---|---|---|---|---|---|---|
| Party | Candidate | Votes | % | ±% | ||||
| Liberal | Arthur Hill Gillmor | 1,518 | 55.4 | +9.3 | ||||
| Conservative | John McAdam | 1,551 | 44.6 | -9.3 | ||||
| Total valid votes | 3,069 | 100.0 | ||||||
| Canadian federal election, 1872 | ||||||||
|---|---|---|---|---|---|---|---|---|
| Party | Candidate | Votes | % | ±% | ||||
| Conservative | John McAdam | 1,551 | 53.9 | |||||
| Liberal | Arthur Hill Gillmor | 1,329 | 46.1 | -10.8 | ||||
| Total valid votes | 2,880 | 100.0 | ||||||
| Canadian federal election, 1867 | ||||||||
|---|---|---|---|---|---|---|---|---|
| Party | Candidate | Votes | % | |||||
| Liberal | John Bolton | 1,061 | 56.9 | |||||
| Unknown | Robert Thompson | 671 | 43.1 | |||||
| Total valid votes | 1,732 | 100.0 | ||||||
See also
References
- "(Code 13008) Census Profile". 2011 census. Statistics Canada. 2012. Retrieved 2011-03-03.
Notes
- ↑ Statistics Canada: 2012
- ↑ Statistics Canada: 2012
- ↑ http://www12.statcan.gc.ca/nhs-enm/2011/dp-pd/prof/details/page.cfm?Lang=E&Geo1=FED2013&Code1=13008&Data=Count&SearchText=New%20Brunswick%20Southwest&SearchType=Begins&SearchPR=01&A1=All&B1=All&Custom=&TABID=1
- ↑ http://www12.statcan.gc.ca/nhs-enm/2011/dp-pd/prof/details/page.cfm?Lang=E&Geo1=FED2013&Code1=13008&Data=Count&SearchText=New%20Brunswick%20Southwest&SearchType=Begins&SearchPR=01&A1=All&B1=All&Custom=&TABID=1#tabs2
- ↑ Elections Canada – Confirmed candidates for New Brunswick Southwest, 30 September 2015
- ↑ Elections Canada – Preliminary Election Expenses Limits for Candidates
- ↑ Pundits' Guide to Canadian Elections
- ↑ Elections Canada – Official voting results, Forty-first general election, 2011
- ↑ Elections Canada – Candidate's electoral campaign return, 41st general election
External links
- Riding history from the Library of Parliament:
- Charlotte 1867-1966
- Charlotte 1996-1998
- NBSW 1998-2003
- St. Croix-Belleisle 2003-2004
- NBSW 2004-present