Egmont (electoral district)
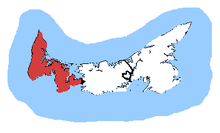 Egmont in relation to the other Prince Edward Island ridings | |||
| Coordinates: | 46°36′40″N 64°00′25″W / 46.611°N 64.007°WCoordinates: 46°36′40″N 64°00′25″W / 46.611°N 64.007°W | ||
| Federal electoral district | |||
| Legislature | House of Commons | ||
| MP |
Liberal | ||
| District created | 1966 | ||
| First contested | 1968 | ||
| Last contested | 2015 | ||
| District webpage | profile, map | ||
| Demographics | |||
| Population (2011)[1] | 34,598 | ||
| Electors (2015) | 27,751 | ||
| Area (km²)[1] | 1,527 | ||
| Pop. density (per km²) | 22.7 | ||
| Census divisions | Prince | ||
| Census subdivisions |
Cities: Summerside Towns: Alberton Miscouche O'Leary Villages: Abram Village, Linkletter, Miminegash, St. Louis, Sherbrooke, Tignish, Tyne Valley, Wellington First Nations reserves: Lennox Island 1 Lots: Lot 1, 2, 3, 4, 5, 6, 7, 8, 9, 10, 11, 12, 13, 14, 15, 16, 17 | ||
Egmont is a federal electoral district in Prince Edward Island, Canada, that has been represented in the House of Commons of Canada since 1968. Its population in 2001 was 35,208.
Demographics
Ethnic groups: 98.0% White, 1.4% Native Canadian
Languages: 87.9% English, 10.9% French
Religions: 54.1% Catholic, 38.4% Protestant, 1.8% Other Christian, 5.5% no affiliation
Average income: $22,065
- According to the Canada 2016 Census
- Languages: (2016) 89.6% English, 8.7% French, 0.4% Tagalog, 0.1% Arabic, 0.1% Spanish, 0.1% German, 0.1% Albanian, 0.1% Mandarin, 0.1% Vietnamese, 0.1% Cantonese, 0.1% Dutch[2]
Geography
The district includes the part of Prince County located in Summerside and west of Summerside. Communities include Summerside, Alberton, Tignish, O'Leary, Miscouche and Sherbrooke. The area is 1,527 km2.
History
The electoral district was created in 1966 from Prince riding. There has been no boundary changes as a result of the 2012 federal electoral redistribution.
Members of Parliament
This riding has elected the following Members of Parliament:
| Parliament | Years | Member | Party | |
|---|---|---|---|---|
| Egmont Riding created from Prince |
||||
| 28th | 1968–1972 | David MacDonald | Progressive Conservative | |
| 29th | 1972–1974 | |||
| 30th | 1974–1979 | |||
| 31st | 1979–1980 | |||
| 32nd | 1980–1984 | George Henderson | Liberal | |
| 33rd | 1984–1988 | |||
| 34th | 1988–1993 | Joe McGuire | ||
| 35th | 1993–1997 | |||
| 36th | 1997–2000 | |||
| 37th | 2000–2004 | |||
| 38th | 2004–2006 | |||
| 39th | 2006–2008 | |||
| 40th | 2008–2011 | Gail Shea | Conservative | |
| 41st | 2011–2015 | |||
| 42nd | 2015–Present | Bobby Morrissey | Liberal | |
Election results
Egmont, 2013 Representation Order
| Canadian federal election, 2015 | ||||||||
|---|---|---|---|---|---|---|---|---|
| Party | Candidate | Votes | % | ±% | Expenditures | |||
| Liberal | Bobby Morrissey | 10,521 | 49.25 | +17.94 | $67,240.83 | |||
| Conservative | Gail Shea | 6,185 | 28.95 | –25.70 | $110,058.32 | |||
| New Democratic | Herb Dickieson | 4,097 | 19.18 | +6.81 | $34,718.49 | |||
| Green | Nils Ling | 559 | 2.62 | +0.95 | $4,895.27 | |||
| Total valid votes/Expense limit | 21,362 | 100.0 | $169,928.60 | |||||
| Total rejected ballots | 87 | 0.41 | –0.39 | |||||
| Turnout | 21,449 | 77.29 | +5.62 | |||||
| Eligible voters | 27,751 | |||||||
| Liberal gain from Conservative | Swing | +21.82 | ||||||
| Source: Elections Canada[3][4] | ||||||||
Egmont, 2003 Representation Order
| Canadian federal election, 2011 | ||||||||
|---|---|---|---|---|---|---|---|---|
| Party | Candidate | Votes | % | ±% | Expenditures | |||
| Conservative | Gail Shea | 10,467 | 54.65 | +10.72 | $57,565.04 | |||
| Liberal | Guy Gallant | 5,997 | 31.31 | -12.32 | $34,428.58 | |||
| New Democratic | Jacquie Robichaud | 2,369 | 12.37 | +3.32 | $1,780.97 | |||
| Green | Carl Anthony | 320 | 1.67 | -1.72 | $250.00 | |||
| Total valid votes/Expense limit | 19,153 | 100.0 | $69,831.16 | |||||
| Total rejected, unmarked and declined ballots | 155 | 0.80 | +0.18 | |||||
| Turnout | 19,308 | 71.67 | +3.52 | |||||
| Eligible voters | 26,941 | |||||||
| Conservative hold | Swing | +11.52 | ||||||
| Sources:[5][6] | ||||||||
| Canadian federal election, 2008 | ||||||||
|---|---|---|---|---|---|---|---|---|
| Party | Candidate | Votes | % | ±% | Expenditures | |||
| Conservative | Gail Shea | 8,110 | 43.93 | +12.97 | $51,795.67 | |||
| Liberal | Keith Milligan | 8,055 | 43.63 | -9.54 | $45,007.86 | |||
| New Democratic | Orville Lewis | 1,670 | 9.05 | -0.50 | $2,245.18 | |||
| Green | Rebecca Ridlington | 626 | 3.39 | -1.80 | $2,678.98 | |||
| Total valid votes/Expense limit | 18,461 | 100.0 | $67,686 | |||||
| Total rejected, unmarked and declined ballots | 115 | 0.62 | +0.01 | |||||
| Turnout | 18,576 | 68.15 | -3.57 | |||||
| Eligible voters | 27,256 | |||||||
| Conservative gain from Liberal | Swing | +11.26 | ||||||
| Canadian federal election, 2006 | ||||||||
|---|---|---|---|---|---|---|---|---|
| Party | Candidate | Votes | % | ±% | Expenditures | |||
| Liberal | Joe McGuire | 10,288 | 53.17 | -2.28 | $35,567.52 | |||
| Conservative | Edward Guergis | 5,991 | 30.96 | +1.87 | $58,124.34 | |||
| New Democratic | Regena Kaye Russell | 1,847 | 9.55 | -2.03 | $3,843.89 | |||
| Green | Ron Matsusaki | 1,005 | 5.19 | +1.30 | $2,768.32 | |||
| Independent | Michael Nesbitt | 219 | 1.13 | – | $2,449.39 | |||
| Total valid votes/Expense limit | 19,350 | 100.0 | $62,678 | |||||
| Total rejected, unmarked and declined ballots | 119 | 0.61 | -0.11 | |||||
| Turnout | 19,469 | 71.72 | +4.31 | |||||
| Eligible voters | 27,146 | |||||||
| Liberal hold | Swing | -2.08 | ||||||
| Canadian federal election, 2004 | ||||||||
|---|---|---|---|---|---|---|---|---|
| Party | Candidate | Votes | % | ±% | Expenditures | |||
| Liberal | Joe McGuire | 10,220 | 55.44 | +5.48 | $35,746.29 | |||
| Conservative | Reg Harper | 5,363 | 29.09 | -14.77 | $32,667.92 | |||
| New Democratic | Regena Kaye Russell | 2,133 | 11.57 | +5.39 | $10,211.62 | |||
| Green | Irené Novaczek | 717 | 3.89 | – | $1,199.66 | |||
| Total valid votes/Expense limit | 18,433 | 100.0 | $61,338 | |||||
| Total rejected, unmarked and declined ballots | 134 | 0.72 | ||||||
| Turnout | 18,567 | 67.41 | ||||||
| Eligible voters | 27,545 | |||||||
| Liberal notional hold | Swing | +10.03 | ||||||
| Changes from 2000 are based on redistributed results. Change for the Conservatives is based on the combined totals of the Progressive Conservatives and the Canadian Alliance. | ||||||||
| 2000 federal election redistributed results | |||
|---|---|---|---|
| Party | Vote | % | |
| Liberal | 8,999 | 49.96 | |
| Progressive Conservative | 6,994 | 38.83 | |
| New Democratic | 1,114 | 6.18 | |
| Alliance | 907 | 5.03 | |
Previous elections
| Canadian federal election, 2000 | ||||||||
|---|---|---|---|---|---|---|---|---|
| Party | Candidate | Votes | % | ±% | ||||
| Liberal | Joe McGuire | 9,227 | 50.05 | +1.63 | ||||
| Progressive Conservative | John Griffin | 7,116 | 38.60 | -5.58 | ||||
| New Democratic | Nancy Wallace | 1,139 | 6.18 | -1.23 | ||||
| Alliance | Jeff Sullivan | 952 | 5.16 | |||||
| Total valid votes | 18,434 | 100.00 | ||||||
| Canadian federal election, 1997 | ||||||||
|---|---|---|---|---|---|---|---|---|
| Party | Candidate | Votes | % | ±% | ||||
| Liberal | Joe McGuire | 8,498 | 48.42 | -9.29 | ||||
| Progressive Conservative | John J. MacDonald | 7,754 | 44.18 | +6.70 | ||||
| New Democratic | Adelard Pitre | 1,300 | 7.41 | +2.60 | ||||
| Total valid votes | 17,552 | 100.00 | ||||||
| Canadian federal election, 1993 | ||||||||
|---|---|---|---|---|---|---|---|---|
| Party | Candidate | Votes | % | ±% | ||||
| Liberal | Joe McGuire | 10,547 | 57.71 | +4.62 | ||||
| Progressive Conservative | Basil Stewart | 6,850 | 37.48 | -1.92 | ||||
| New Democratic | Basil Brian Dumville | 880 | 4.81 | -2.71 | ||||
| Total valid votes | 18,277 | 100.00 | ||||||
| Canadian federal election, 1988 | ||||||||
|---|---|---|---|---|---|---|---|---|
| Party | Candidate | Votes | % | ±% | ||||
| Liberal | Joe McGuire | 10,158 | 53.09 | +3.31 | ||||
| Progressive Conservative | Prowse Chappell | 7,538 | 39.40 | -5.18 | ||||
| New Democratic | Irene N. Dyment | 1,438 | 7.52 | +1.88 | ||||
| Total valid votes | 19,134 | 100.00 | ||||||
| Canadian federal election, 1984 | ||||||||
|---|---|---|---|---|---|---|---|---|
| Party | Candidate | Votes | % | ±% | ||||
| Liberal | George Henderson | 8,777 | 49.78 | -2.59 | ||||
| Progressive Conservative | George Dewar | 7,859 | 44.58 | +1.95 | ||||
| New Democratic | Wain Munro | 994 | 5.64 | +0.64 | ||||
| Total valid votes | 17,630 | 100.00 | ||||||
| Canadian federal election, 1980 | ||||||||
|---|---|---|---|---|---|---|---|---|
| Party | Candidate | Votes | % | ±% | ||||
| Liberal | George Henderson | 8,639 | 52.37 | +12.93 | ||||
| Progressive Conservative | David MacDonald | 7,033 | 42.63 | -13.44 | ||||
| New Democratic | Vincent Gallant | 824 | 5.00 | +0.51 | ||||
| Total valid votes | 16,496 | 100.00 | ||||||
| Canadian federal election, 1979 | ||||||||
|---|---|---|---|---|---|---|---|---|
| Party | Candidate | Votes | % | ±% | ||||
| Progressive Conservative | David MacDonald | 8,861 | 56.07 | +3.82 | ||||
| Liberal | Bill Reese | 6,233 | 39.44 | -4.81 | ||||
| New Democratic | Vincent Gallant | 710 | 4.49 | +0.98 | ||||
| Total valid votes | 15,804 | 100.00 | ||||||
| Canadian federal election, 1974 | ||||||||
|---|---|---|---|---|---|---|---|---|
| Party | Candidate | Votes | % | ±% | ||||
| Progressive Conservative | David MacDonald | 7,583 | 52.25 | -3.53 | ||||
| Liberal | Bill Reese | 6,422 | 44.25 | +3.97 | ||||
| New Democratic | Cletus Shea | 509 | 3.51 | -0.04 | ||||
| Total valid votes | 14,514 | 100.00 | ||||||
| Canadian federal election, 1972 | ||||||||
|---|---|---|---|---|---|---|---|---|
| Party | Candidate | Votes | % | ±% | ||||
| Progressive Conservative | David MacDonald | 7,868 | 55.78 | +2.26 | ||||
| Liberal | George W. Olscamp | 5,681 | 40.28 | -4.02 | ||||
| New Democratic | Carroll L. Kadey | 501 | 3.55 | +1.37 | ||||
| Social Credit | Hugh G. Ryan | 55 | 0.39 | |||||
| Total valid votes | 14,105 | 100.00 | ||||||
| Canadian federal election, 1968 | ||||||||
|---|---|---|---|---|---|---|---|---|
| Party | Candidate | Votes | % | |||||
| Progressive Conservative | David MacDonald | 7,182 | 53.52 | |||||
| Liberal | J. Melville Campbell | 5,945 | 44.30 | |||||
| New Democratic | Harvey Dawson | 292 | 2.18 | |||||
| Total valid votes | 13,419 | 100.00 | ||||||
Student Vote results
2011 election
In 2011, a Student Vote was conducted at participating Canadian schools to parallel the 2011 Canadian federal election results. The vote was designed to educate students and simulate the electoral process for persons who have not yet reached the legal majority. Schools with a large student body that reside in another electoral district had the option to vote for candidates outside of the electoral district then where they were physically located.[7]
| Canadian federal election, 2011 | ||||||||
|---|---|---|---|---|---|---|---|---|
| Party | Candidate | Votes | % | |||||
| Conservative | Gail Shea | 475 | 29.87 | |||||
| Liberal | Guy Gallant | 407 | 25.60 | |||||
| Green | Carl Anthony | 391 | 24.59 | |||||
| New Democratic | Jacquie Robichaud | 317 | 19.94 | |||||
| Total valid votes | 1,590 | 100.00 | ||||||
See also
References
- "(Code 11003) Census Profile". 2011 census. Statistics Canada. 2012. Retrieved 2011-03-03.
- Riding history for Egmont (1966–) from the Library of Parliament
- Campaign expense data from Elections Canada
Notes
- 1 2 Statistics Canada: 2012
- ↑ https://www12.statcan.gc.ca/census-recensement/2016/dp-pd/dt-td/Rp-eng.cfm?LANG=E&APATH=3&DETAIL=0&DIM=0&FL=A&FREE=0&GC=0&GID=0&GK=0&GRP=1&PID=109979&PRID=10&PTYPE=109445&S=0&SHOWALL=0&SUB=888&Temporal=2016,2017&THEME=118&VID=0&VNAMEE=&VNAMEF=
- ↑ "October 19, 2015 Election Results — Egmont (Validated results)". Elections Canada. 21 October 2015. Retrieved 24 October 2015.
- ↑ Elections Canada – Preliminary Election Expenses Limits for Candidates Archived August 15, 2015, at the Wayback Machine.
- ↑ Elections Canada – Official voting results, Forty-first general election, 2011
- ↑ Elections Canada – Candidate's electoral campaign return, 41st general election
- ↑ "School by School results". Student Vote Canada. Retrieved 2013-06-12.