Tobique—Mactaquac New Brunswick electoral district New Brunswick electoral district |
|---|
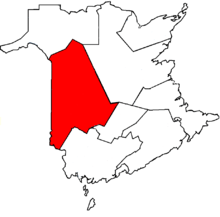 Tobique-Mactaquac in relation to other New Brunswick federal electoral districts |
| Coordinates: |
46°31′52″N 67°14′13″W / 46.531°N 67.237°W / 46.531; -67.237Coordinates: 46°31′52″N 67°14′13″W / 46.531°N 67.237°W / 46.531; -67.237 |
|---|
| Federal electoral district |
|---|
| Legislature |
House of Commons |
|---|
| MP |
T. J. Harvey
Liberal |
|---|
| District created |
1996 |
|---|
| First contested |
1997 |
|---|
| Last contested |
2015 |
|---|
| District webpage |
profile, map |
|---|
| Demographics |
|---|
| Population (2011)[1] |
70,632 |
|---|
| Electors (2015) |
53,129 |
|---|
| Area (km²)[2] |
15,130 |
|---|
| Pop. density (per km²) |
4.7 |
|---|
| Census divisions |
Carleton, Victoria, York |
|---|
| Census subdivisions |
Grand Falls / Grand-Sault, Fredericton, Woodstock, Bright, Douglas, Drummond, Kent, Saint Marys, Wakefield |
|---|
Tobique—Mactaquac is a federal electoral district in New Brunswick, Canada, that has been represented in the House of Commons of Canada since 1997.
History
The electoral district was created in 1996 from portions of the old ridings of Carleton—Charlotte, Fredericton—York—Sunbury, and Madawaska—Victoria. Its creation was very controversial, as it included areas with both large anglophone and francophone populations, while neighbouring communities were placed in other ridings. This seemingly went against the "communities of interest" criterion in drawing electoral boundaries.
On two separate occasions Tobique—Mactaquac has been involved in party nomination controversies. In the 1997 election, the Liberals were alleged to have rigged their meeting to choose Pierrette Ringuette-Maltais, the Member of Parliament for the defunct Madawaska—Victoria riding. The meeting was held in Grand Falls, near her hometown and at the far northern end of the riding. Because of sound problems, only her speech was carried over the loudspeakers. Ringuette-Maltais lost the election to Gilles Bernier of the Progressive Conservatives.
In the 2004 election, the Conservative Party selected Adam Richardson, who had run for the Canadian Alliance in the 2000 election, but national head office refused to sign his nomination papers, apparently because of Richardson's demands that Stephen Harper apologize for comments about Atlantic Canadians. The eventual Conservative candidate, Mike Allen, lost to Liberal incumbent Andy Savoy.
As per the 2012 federal electoral distribution, this riding will gain territory from Fredericton and lose a small territory to the new riding of Miramichi—Grand Lake.
| Historical population |
|---|
| Year | Pop. | ±% |
|---|
| 2001 | 70,105 | — |
|---|
| 2006 | 68,352 | −2.5% |
|---|
| 2011 | 68,709 | +0.5% |
|---|
Election results
Tobique—Mactaquac, 2013 Representation Order
This riding gained territory from Fredericton and lost territory to Miramichi—Grand Lake for the 42nd Canadian federal election.
| Canadian federal election, 2015 |
| Party |
Candidate |
Votes | % | ±% | Expenditures |
|
Liberal | T. J. Harvey | 17,909 | 46.61 | +30.38 | $67,600.14 |
|
Conservative | Richard Bragdon | 14,225 | 37.02 | -25.12 | $57,487.20 |
|
New Democratic | Robert Kitchen | 4,334 | 11.28 | -7.86 | $6,199.56 |
|
Green | Terry Wishart | 1,959 | 5.10 | +2.62 | $3,275.40 |
| Total valid votes/Expense limit |
38,427 | 100.00 | | $204,512.49 |
| Total rejected ballots |
248 | 0.64 | – |
| Turnout |
38,675 | 71.79 | – |
| Eligible voters |
53,870 |
|
Liberal gain from Conservative |
Swing |
+27.75
|
| Source: Elections Canada[3][4] |
Tobique—Mactaquac, 2003 Representation Order
| Canadian federal election, 2011 |
| Party |
Candidate |
Votes | % | ±% | Expenditures |
|
Conservative | Mike Allen | 21,108 | 62.70 | +5.21 | $44,047.06 |
|
New Democratic | Pierre Cyr | 6,388 | 18.98 | +3.61 | $4,796.14 |
|
Liberal | Charles Chiasson | 5,337 | 15.85 | -5.70 | $29,831.59 |
|
Green | Rish McGlynn | 831 | 2.47 | -3.29 | $5.82 |
| Total valid votes/Expense limit |
33,664 | 100.0 | | $84,385.35 |
| Total rejected, unmarked and declined ballots |
256 | 0.75 | -0.33 |
| Turnout |
33,920 | 63.91 | +4.18 |
| Eligible voters |
53,073 |
|
Conservative hold |
Swing |
+0.80
|
| Sources:[6][7] |
| Canadian federal election, 2008 |
| Party |
Candidate |
Votes | % | ±% | Expenditures |
|
Conservative | Mike Allen | 18,071 | 57.49 | +13.70 | $61,678.30 |
|
Liberal | Sally McGrath | 6,773 | 21.55 | -21.32 | $26,392.40 |
|
New Democratic | Alice Finnamore | 4,830 | 15.37 | +3.87 | $8,535.56 |
|
Green | Mark Glass | 1,810 | 5.76 | +3.89 | $1,492.00 |
| Total valid votes/Expense limit |
31,433 | 100.0 | | $81,901 |
| Total rejected, unmarked and declined ballots |
343 | 1.08 | +0.04 |
| Turnout |
31,776 | 59.73 | -8.02 |
| Eligible voters |
53,203 |
|
Conservative hold |
Swing |
+17.51
|
| Canadian federal election, 2006 |
| Party |
Candidate |
Votes | % | ±% | Expenditures |
|
Conservative | Mike Allen | 15,894 | 43.79 | +4.20 | $66,976.92 |
|
Liberal | Andy Savoy | 15,558 | 42.87 | -5.36 | $70,900.54 |
|
New Democratic | Alice Finnamore | 4,172 | 11.50 | +3.00 | $9,442.17 |
|
Green | Robert Bérubé Jr. | 679 | 1.87 | -1.81 | none listed |
| Total valid votes/Expense limit |
36,292 | 100.0 | | $76,462 |
| Total rejected, unmarked and declined ballots |
383 | 1.04 |
| Turnout |
36,675 | 67.75 | +3.75 |
| Eligible voters |
54,135 |
|
Conservative gain from Liberal |
Swing |
+4.78
|
| Canadian federal election, 2004 |
| Party |
Candidate |
Votes | % | ±% | Expenditures |
|
Liberal | Andy Savoy | 16,787 | 48.23 | +15.82 | $74,481.32 |
|
Conservative | Mike Allen | 13,779 | 39.59 | -24.32 | $60,455.56 |
|
New Democratic | Jason Mapplebeck | 2,957 | 8.50 | +4.82 | $1,645.00 |
|
Green | Scott Jones | 1,282 | 3.68 | – | $882.20 |
| Total valid votes/Expense limit |
34,805 | 100.0 | | $74,648 |
| Total rejected, unmarked and declined ballots |
349 | 1.0 |
| Turnout |
35,154 | 64.00 | -2.29 |
| Eligible voters |
54,931 |
|
Liberal notional gain from Progressive Conservative |
Swing |
+20.07 |
| Changes from 2000 are based on redistributed results. Conservative Party change is based on the combination of Canadian Alliance and Progressive Conservative Party totals. |
Tobique—Mactaquac, 1996 Representation Order