South Shore—St. Margarets
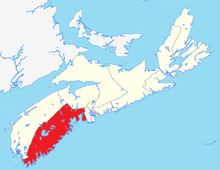 South Shore—St. Margaret's in relation to the other Nova Scotia federal electoral districts | |||
| Federal electoral district | |||
| Legislature | House of Commons | ||
| MP |
Liberal | ||
| District created | 1966 | ||
| First contested | 1968 | ||
| Last contested | 2015 | ||
| District webpage | profile, map | ||
| Demographics | |||
| Population (2016)[1] | 91,830 | ||
| Electors (2015) | 75,904 | ||
| Area (km²)[1] | 8,475 | ||
| Pop. density (per km²) | 10.8 | ||
| Census divisions | HRM, Lunenburg County, Queens County, Shelburne County | ||
| Census subdivisions | Bridgewater, Clark's Harbour, Chester, Liverpool, Lunenburg, Mahone Bay, Shelburne | ||
South Shore—St. Margarets (formerly South Shore—St. Margaret's and South Shore) is a federal electoral district in Nova Scotia, Canada, that has been represented in the House of Commons of Canada since 1968. It covers the South Shore region of Nova Scotia.
It was created in 1966 mostly from Queens—Lunenburg and Shelburne—Yarmouth—Clare. In 2003, the district added portions of Halifax West.
Demographics
| Historical population | ||
|---|---|---|
| Year | Pop. | ±% |
| 2001 | 83,694 | — |
| 2006 | 82,855 | −1.0% |
| 2011 (2003 redist.) | 82,254 | −0.7% |
| 2011 (2013 redist.) | 92,561 | +12.5% |
| 2016 | 91,830 | −0.8% |
From the 2006 census [2]
Ethnic groups:
- White: 97.1%
- First Nations: 1.5%
- Black: 0.6%
Languages:
Religions:
- Protestant: 71.5%
- Catholic: 11.5%
- Other Christian: 1.1%
- No affiliation: 15.4%
Education:
- No certificate, diploma or degree: 34.5%
- High school certificate: 21.2%
- Apprenticeship or trade certificate or diploma: 12.2%
- Community college, CEGEP or other non-university certificate or diploma: 17.4%
- University certificate or diploma: 14.7%
Median Age:
- 45.2
Median total income:
- $20,580
Average total income:
- $27,987
Median household income:
- $44,108
Average household income:
- $53,111
Median family income:
- $52,772
Average family income:
- $61,279
Unemployment:
- 10.3%
Geography
It consists of:
- the counties of Shelburne, Queens and Lunenburg;
and
- the western part of the Halifax Regional Municipality, i.e., the part lying west of a line drawn south from the intersection of the boundary between the regional municipality and the County of Hants with the western shoreline of Pockwock Lake along the shoreline to the western extremity of Ponhook Cove, then south in a straight line for approximately 2.7 km to the mouth of the Pockwock River at Wrights Lake, southeast in a straight line for approximately 3.8 km to the northern extremity of Stillwater Lake, south along that lake, southwest along Route 213 (Hammonds Plains Road) to Trunk 3, southeast in a straight line for approximately 18.6 km to the mouth of the Nine Mile River, southwest along Shad Bay (passing west of Cochrans Island) to the Atlantic Ocean.
History
After the 2012 federal electoral redistribution, the riding gained 11% of its new territory from Halifax West.
Members of Parliament
This riding has elected the following Members of Parliament:
| Parliament | Years | Member | Party | |
|---|---|---|---|---|
| South Shore Riding created from Queens—Lunenburg and Shelburne—Yarmouth—Clare |
||||
| 28th | 1968–1972 | Lloyd Crouse | Progressive Conservative | |
| 29th | 1972–1974 | |||
| 30th | 1974–1979 | |||
| 31st | 1979–1980 | |||
| 32nd | 1980–1984 | |||
| 33rd | 1984–1988 | |||
| 34th | 1988–1993 | Peter McCreath | ||
| 35th | 1993–1997 | Derek Wells | Liberal | |
| 36th | 1997–2000 | Gerald Keddy | Progressive Conservative | |
| 37th | 2000–2003 | |||
| 2003–2004 | Conservative | |||
| South Shore—St. Margaret's | ||||
| 38th | 2004–2006 | Gerald Keddy | Conservative | |
| 39th | 2006–2008 | |||
| 40th | 2008–2011 | |||
| 41st | 2011–2015 | |||
| South Shore—St. Margarets | ||||
| 42nd | 2015–Present | Bernadette Jordan | Liberal | |
Election results
South Shore—St. Margarets, 2013 Representation Order
| Canadian federal election, 2015 | ||||||||
|---|---|---|---|---|---|---|---|---|
| Party | Candidate | Votes | % | ±% | Expenditures | |||
| Liberal | Bernadette Jordan | 30,045 | 56.93 | +38.97 | $74,989.98 | |||
| Conservative | Richard Clark | 11,905 | 22.56 | –19.42 | $77,116.91 | |||
| New Democratic | Alex Godbold | 8,883 | 16.83 | –19.24 | $119,217.64 | |||
| Green | Richard Biggar | 1,534 | 2.91 | –1.09 | $126.74 | |||
| Independent | Trevor Bruhm | 257 | 0.49 | – | $1,450.37 | |||
| Communist | Ryan Barry | 151 | 0.20 | – | – | |||
| Total valid votes/Expense limit | 52,775 | 100.00 | $217,269.80 | |||||
| Total rejected ballots | 226 | 0.43 | ||||||
| Turnout | 53,001 | 69.83 | ||||||
| Eligible voters | 75,904 | |||||||
| Liberal gain from Conservative | Swing | +29.20 | ||||||
| Source: Elections Canada[3][4] | ||||||||
| 2011 federal election redistributed results[5] | |||
|---|---|---|---|
| Party | Vote | % | |
| Conservative | 19,709 | 41.98 | |
| New Democratic | 16,939 | 36.08 | |
| Liberal | 8,431 | 17.96 | |
| Green | 1,875 | 3.99 | |
South Shore—St. Margaret's, 2003 Representation Order
| Canadian federal election, 2011 | ||||||||
|---|---|---|---|---|---|---|---|---|
| Party | Candidate | Votes | % | ±% | Expenditures | |||
| Conservative | Gerald Keddy | 17,948 | 43.14 | +7.15 | $65,637.06 | |||
| New Democratic | Gordon Earle | 15,033 | 36.14 | +2.79 | $79,480.73 | |||
| Liberal | Derek Wells | 7,037 | 16.92 | -6.93 | $57,461.22 | |||
| Green | Kris MacLellan | 1,579 | 3.80 | -1.43 | $41.21 | |||
| Total valid votes/Expense limit | 41,597 | 100.0 | $86,455.81 | |||||
| Total rejected, unmarked and declined ballots | 282 | 0.67 | +0.20 | |||||
| Turnout | 41,879 | 62.23 | +2.03 | |||||
| Eligible voters | 67,296 | |||||||
| Conservative hold | Swing | +2.18 | ||||||
| Sources:[6][7] | ||||||||
| Canadian federal election, 2008 | ||||||||
|---|---|---|---|---|---|---|---|---|
| Party | Candidate | Votes | % | ±% | Expenditures | |||
| Conservative | Gerald Keddy | 14,388 | 35.99 | -0.79 | $64,451.93 | |||
| New Democratic | Gordon Earle | 13,456 | 33.65 | +5.20 | $80,797.19 | |||
| Liberal | Bill Smith | 9,536 | 23.85 | -4.64 | $54,540.83 | |||
| Green | Michael Oddy | 2,090 | 5.23 | +2.32 | $105.90 | |||
| Christian Heritage | Joseph Larkin | 513 | 1.28 | -2.08 | $1,140.54 | |||
| Total valid votes/Expense limit | 39,983 | 100.0 | $83,679 | |||||
| Total rejected, unmarked and declined ballots | 190 | 0.47 | +0.05 | |||||
| Turnout | 40,173 | 60.20 | -0.36 | |||||
| Eligible voters | 66,733 | |||||||
| Conservative hold | Swing | -3.00 | ||||||
| Canadian federal election, 2006 | ||||||||
|---|---|---|---|---|---|---|---|---|
| Party | Candidate | Votes | % | ±% | Expenditures | |||
| Conservative | Gerald Keddy | 15,108 | 36.85 | -1.05 | $54,773.43 | |||
| New Democratic | Gordon Earle | 11,689 | 28.51 | +2.81 | $40,850.21 | |||
| Liberal | Darian Huskilson | 11,629 | 28.36 | -3.72 | $40,530.60 | |||
| Christian Heritage | James Hnatiuk | 1,376 | 3.36 | – | $8,815.18 | |||
| Green | Kate Morris Boudreau | 1,198 | 2.92 | -1.39 | $2,624.42 | |||
| Total valid votes/Expense limit | 41,000 | 100.0 | $78,403 | |||||
| Total rejected, unmarked and declined ballots | 173 | 0.42 | ||||||
| Turnout | 41,173 | 60.56 | +0.04 | |||||
| Eligible voters | 67,983 | |||||||
| Conservative hold | Swing | -1.93 | ||||||
| Canadian federal election, 2004 | ||||||||
|---|---|---|---|---|---|---|---|---|
| Party | Candidate | Votes | % | ±% | Expenditures | |||
| Conservative | Gerald Keddy | 14,954 | 37.90 | -12.58 | $55,398.71 | |||
| Liberal | John Chandler | 12,658 | 32.08 | -3.04 | $47,623.99 | |||
| New Democratic | Gordon Earle | 10,140 | 25.70 | +11.33 | $40,934.28 | |||
| Green | Kate Boudreau | 1,700 | 4.31 | – | $1,478.43 | |||
| Total valid votes/Expense limit | 39,452 | 100.0 | $75,387 | |||||
| Total rejected, unmarked and declined ballots | 182 | 0.46 | ||||||
| Turnout | 39,634 | 60.52 | -1.08 | |||||
| Eligible voters | 65,487 | |||||||
| Conservative notional gain from Progressive Conservative | Swing | -4.77 | ||||||
| Changes from 2000 are based on redistributed results. Change for the Conservative Party is based on the combined totals of the Progressive Conservative Party and the Canadian Alliance. | ||||||||
| 2000 federal election redistributed results | |||
|---|---|---|---|
| Party | Vote | % | |
| Progressive Conservative | 15,083 | 37.89 | |
| Liberal | 13,979 | 35.12 | |
| New Democratic | 5,718 | 14.37 | |
| Alliance | 5,013 | 12.59 | |
| Others | 12 | 0.03 | |
Previous elections
| Canadian federal election, 2000 | ||||||||
|---|---|---|---|---|---|---|---|---|
| Party | Candidate | Votes | % | ±% | ||||
| Progressive Conservative | Gerald Keddy | 14,328 | 39.69 | 3.70 | ||||
| Liberal | Derek Wells | 12,677 | 35.12 | 6.10 | ||||
| Alliance | Evan Walters | 4,697 | 13.01 | -0.49 | ||||
| New Democratic | Bill Zimmerman | 4,394 | 12.17 | -8.55 | ||||
| Total valid votes | 36,096 | 100.00 | ||||||
| Canadian federal election, 1997 | ||||||||
|---|---|---|---|---|---|---|---|---|
| Party | Candidate | Votes | % | ±% | ||||
| Progressive Conservative | Gerald Keddy | 14,136 | 36.00 | +3.38 | ||||
| Liberal | Derek Wells | 11,397 | 29.02 | -17.92 | ||||
| New Democratic | Blandford Nickerson | 8,137 | 20.72 | +15.72 | ||||
| Reform | Anne Matthiasson | 5,302 | 13.50 | -0.02 | ||||
| Natural Law | Terry Harnish | 298 | 0.76 | -0.02 | ||||
| Total valid votes | 39,270 | 100.00 | ||||||
| Canadian federal election, 1993 | ||||||||
|---|---|---|---|---|---|---|---|---|
| Party | Candidate | Votes | % | ±% | ||||
| Liberal | Derek Wells | 17,351 | 46.94 | +4.37 | ||||
| Progressive Conservative | Peter McCreath | 12,058 | 32.62 | -13.84 | ||||
| Reform | Anne Matthiasson | 4,999 | 13.52 | |||||
| New Democratic | Eric Hustvedt | 1,847 | 5.00 | -5.15 | ||||
| National | A. James Donahue | 422 | 1.14 | |||||
| Natural Law | Richard Robertson | 287 | 0.78 | |||||
| Total valid votes | 36,964 | 100.00 | ||||||
| Canadian federal election, 1988 | ||||||||
|---|---|---|---|---|---|---|---|---|
| Party | Candidate | Votes | % | ±% | ||||
| Progressive Conservative | Peter McCreath | 18,547 | 46.46 | -10.23 | ||||
| Liberal | Mike Delory | 16,995 | 42.57 | 13.55 | ||||
| New Democratic | Bill Zimmerman | 4,052 | 10.15 | -4.14 | ||||
| Libertarian | David Morgan | 329 | 0.82 | |||||
| Total valid votes | 39,923 | 100.00 | ||||||
| Canadian federal election, 1984 | ||||||||
|---|---|---|---|---|---|---|---|---|
| Party | Candidate | Votes | % | ±% | ||||
| Progressive Conservative | Lloyd Crouse | 22,347 | 56.69 | 12.30 | ||||
| Liberal | Paul Blades | 11,439 | 29.02 | -9.29 | ||||
| New Democratic | Bill Zimmerman | 5,633 | 14.29 | -1.82 | ||||
| Total valid votes | 39,419 | 100.00 | ||||||
| Canadian federal election, 1980 | ||||||||
|---|---|---|---|---|---|---|---|---|
| Party | Candidate | Votes | % | ±% | ||||
| Progressive Conservative | Lloyd Crouse | 16,139 | 44.39 | -12.74 | ||||
| Liberal | Jim Kinley | 13,926 | 38.31 | +6.36 | ||||
| New Democratic | John Yates | 5,856 | 16.11 | +5.19 | ||||
| Rhinoceros | Martha Tudor | 433 | 1.19 | |||||
| Total valid votes | 36,354 | 100.00 | ||||||
| Canadian federal election, 1979 | ||||||||
|---|---|---|---|---|---|---|---|---|
| Party | Candidate | Votes | % | ±% | ||||
| Progressive Conservative | Lloyd Crouse | 20,867 | 57.14 | +2.60 | ||||
| Liberal | Ted McFetridge | 11,666 | 31.94 | -7.02 | ||||
| New Democratic | John Yates | 3,988 | 10.92 | +5.08 | ||||
| Total valid votes | 36,521 | 100.00 | ||||||
| Canadian federal election, 1974 | ||||||||
|---|---|---|---|---|---|---|---|---|
| Party | Candidate | Votes | % | ±% | ||||
| Progressive Conservative | Lloyd Crouse | 18,206 | 54.54 | -2.77 | ||||
| Liberal | Bill Martin | 13,006 | 38.96 | +3.32 | ||||
| New Democratic | Bob Manthorne | 1,950 | 5.84 | -1.22 | ||||
| Social Credit | Edward Peterson | 222 | 0.66 | |||||
| Total valid votes | 33,384 | 100.00 | ||||||
| Canadian federal election, 1972 | ||||||||
|---|---|---|---|---|---|---|---|---|
| Party | Candidate | Votes | % | ±% | ||||
| Progressive Conservative | Lloyd Crouse | 18,653 | 57.30 | -1.23 | ||||
| Liberal | John Kinley | 11,602 | 35.64 | -3.28 | ||||
| New Democratic | Richard Stuart | 2,297 | 7.06 | +4.51 | ||||
| Total valid votes | 32,552 | 100.00 | ||||||
| Canadian federal election, 1968 | ||||||||
|---|---|---|---|---|---|---|---|---|
| Party | Candidate | Votes | % | |||||
| Progressive Conservative | Lloyd Crouse | 17,547 | 58.53 | |||||
| Liberal | John Kinley | 11,668 | 38.92 | |||||
| New Democratic | Aubrey Harding | 764 | 2.55 | |||||
| Total valid votes | 29,979 | 100.00 | ||||||
See also
References
- "(Code 12009) Census Profile". 2011 census. Statistics Canada. 2012. Retrieved 2011-03-03.
- Riding history for South Shore–St. Margaret's (2003– ) from the Library of Parliament
- Campaign expenses from Elections Canada website
Notes
- 1 2 Statistics Canada: 2012
- ↑ http://www.bcstats.gov.bc.ca/data/cen06/profiles/detail_b/FED12009.pdf South Shore-St. Margaret's census profile
- ↑ "October 19, 2015 Election Results — South Shore—St. Margarets (Validated results)". Elections Canada. 21 October 2015. Retrieved 24 October 2015.
- ↑ Elections Canada – Preliminary Election Expenses Limits for Candidates
- ↑ Pundits' Guide to Canadian Elections
- ↑ Elections Canada – Official voting results, Forty-first general election, 2011
- ↑ Elections Canada – Candidate's electoral campaign return, 41st general election
External links
Candidate info from their own or the political parties websites: