Labrador Newfoundland and Labrador electoral district Newfoundland and Labrador electoral district |
|---|
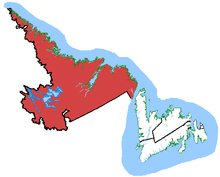 Labrador in relation to other Newfoundland and Labrador ridings (2003 boundaries) |
| Federal electoral district |
|---|
| Legislature |
House of Commons |
|---|
| MP |
Yvonne Jones
Liberal |
|---|
| District created |
1949 |
|---|
| First contested |
1949 |
|---|
| Last contested |
2015 |
|---|
| District webpage |
profile, map |
|---|
| Demographics |
|---|
| Population (2011)[1] |
26,728 |
|---|
| Electors (2015) |
19,917 |
|---|
| Area (km²)[1] |
294,330 |
|---|
| Pop. density (per km²) |
0.09 |
|---|
| Census divisions |
Division No. 10, Division No. 11 |
|---|
| Census subdivisions |
Cartwright, Charlottetown, Division No. 10, Subdivision A, Division No. 10, Subdivision B, Division No. 10, Subdivision C, Division No. 10, Subdivision D, Division No. 10, Subdivision E, Division No. 11, Subdivision C, Division No. 11, Subdivision E, Forteau, Happy Valley-Goose Bay, Hopedale, Labrador City, L'Anse-au-Clair, L'Anse-au-Loup, Makkovik, Mary's Harbour, Nain, Natuashish, North West River, Pinware, Port Hope Simpson, Postville, Red Bay, Rigolet, Sheshatshiu, St. Lewis, Wabush, West St. Modeste |
|---|
Labrador (formerly known as Grand Falls—White Bay—Labrador and Grand Falls—White Bay) is a federal electoral district in Newfoundland and Labrador, Canada, that has been represented in the House of Commons of Canada since 1949.
The riding covers all of Labrador and with just 26,000 people located in the riding it is the least populous in Canada.[2] From 2005 to 2011, the riding was represented by Liberal MP Todd Russell. He was defeated by Conservative Peter Penashue in the 2011 federal election. Following allegations of irregularities in his campaign spending, Penashue announced on March 14, 2013 that he would resign his seat and run again as a candidate in a new by-election.[3][4] Penashue subsequently lost the by-election to Liberal candidate Yvonne Jones.
It was the only riding of the 338 during the 2015 election that did not have a Green Party candidate.
Demographics
This riding is the least populous in Canada. Citing the region's highly distinct identity and seeing it as a community of interest they have the legal duty to respect, successive electoral boundary commissions have used their ability to make exceptions to the general electoral quotient to maintain Labrador as a separate riding.
In earlier representation orders, it was joined with communities on the Great Northern Peninsula of the island of Newfoundland.
Ethnic groups: 65.1% White, 34.9% Native Canadian
Languages (2016): 86.4% English, 5.6% Innu, 2.3% Naskapi, 1.5% French, 1.4% Inuktitut, 1.3% Tagalog, 0.1% German, 0.1% Panjabi, 0.1% Spanish[5]
Religions: 67.4% Protestant, 28.4% Catholic, 3.4% No affiliation
Average income: $27 138
History
The electoral district was created in 1949 upon the admission of Newfoundland to Canada. Between 1949 and 1988, this district was attached to the Island of Newfoundland, where more than half of its electorate resided. Liberal MP Bill Rompkey held the seat from 1972 till his appointment to the Senate of Canada in 1995. Lawrence O'Brien was later elected in a by-election and held the district until his death in 2004.
A by-election was held on May 24, 2005, with the result tipping the balance of the evenly split 38th Parliament. The Liberal candidate, Todd Russell, who was heavily favoured, ended up winning, but with a reduced percentage from the 2004 election.
On December 16, 2004, MP Lawrence O'Brien died of cancer, the next year Prime Minister Paul Martin called a by-election for May 24, 2005. There was a possibility the by-election would not be held because of a non-confidence vote the week prior. The non-confidence vote would have toppled the government sending Canadians to the polls, which would have superseded the by-election. However, the motion failed by one vote, ensuring the by-election.
The seat has traditionally been a Liberal stronghold, and O'Brien always carried the riding with comfortable pluralities. However, the federal Liberals had lost popularity in Atlantic Canada since the 2004 federal election largely because of disputes with the Progressive Conservative provincial governments of these provinces, especially that of Newfoundland and Labrador over the relationship between offshore oil revenues and equalization payments.
Historically, governing parties fare poorly in federal by-elections. However, this by-election was especially significant because of the make-up of the 38th Canadian Parliament. Following the 2004 election, the Liberals and the New Democratic Party held 154 seats together, or exactly half of the 308-seat House of Commons. After Liberal MP Carolyn Parrish was expelled from that party, the two parties' combined total (prior to O'Brien's death) had been reduced to 153 (or 152 who are eligible to vote since the Speaker was elected as a Liberal). The Liberals were anxious to retain the seat, as its loss would have left the opposition Conservative Party of Canada or the Bloc Québécois as the only viable partners for the Liberals to get legislation passed in the House. Former Liberal MP David Kilgour had left the party, further reducing its strength.
Since the general election, it had been suggested that the New Democratic Party refrain from contesting by-elections in seats where the Liberals were strong but the NDP are not, to avoid splitting the vote and thus help improve the chances securing a better position for the NDP in the House. Labrador would certainly be a prime example of such a seat — the NDP finished a distant fourth in the 2004 election. However, historically the NDP has been adamant in contesting all by-elections, and NDP leader Jack Layton showed little interest in any such proposal. The NDP nominated Frances Fry on April 23 feeling it had a chance in this seat because of the Liberal fall in polls and the fact that the provincial NDP had one of its two seats in Labrador.
In the end, the Liberals picked up an easy victory, as expected, but while their actual vote total did not go down by much, their percentage of the vote went down over 10 points from the previous election as turnout was over 9% more than in the 2004 election. This high turnout is virtually unheard of for by-elections which normally have extremely poor turnouts. The additional voters appear to have been brought out by the tense national political situation and mostly voted for the Conservatives who picked up nearly 17 percentage points and the New Democrats who also increased their vote total.
Election results
Labrador, 2013 Representation Order
The 2012 federal electoral boundaries redistribution concluded that the electoral boundaries of Labrador should be preserved with no boundary changes for future elections.[6]
| Canadian federal election, 2015 |
| Party |
Candidate |
Votes | % | ±% | Expenditures |
|
Liberal | Yvonne Jones | 8,878 | 71.75 | +23.76 (+32.69) | $95,326.13 |
|
New Democratic | Edward Rudkowski | 1,779 | 14.38 | –4.81 (-5.45) | $47,898.82 |
|
Conservative | Peter Penashue | 1,716 | 13.87 | –18.53 (-25.94) | $24,186.27 |
| Total valid votes/Expense limit |
12,373 | 100.00 | | $204,663.38 |
| Total rejected ballots |
53 | 0.43 | –0.42 |
| Turnout |
12,426 | 62.39 | +4.40 |
| Eligible voters |
19,917 |
|
Liberal hold |
Swing |
+14.29
|
| Source: Elections Canada[7][8] |
^ Change is from by-election. Change from 2011 in brackets.
Labrador, 2003 Representation Order
| Canadian federal by-election, May 13, 2013 |
| Party |
Candidate |
Votes | % | ±% | Expenditures |
|
Liberal | Yvonne Jones | 5,812 | 47.99 | +8.92 | $76,859.63 |
|
Conservative | Peter Penashue | 3,924 | 32.40 | −7.41 | $70,866.91 |
|
New Democratic | Harry Borlase | 2,324 | 19.19 | −0.64 | $81,475.53 |
|
Libertarian | Norman Andrews | 50 | 0.41 | | $236.16 |
| Total valid votes/Expense Limit |
12,110 | 100.0 | – | $ 89,852.84 |
| Total rejected, declined and unmarked ballots |
27 | 0.22 | −0.26 | |
| Turnout |
12,137 | 59.93 | +6.49 | |
| Eligible voters |
20,251 | | | |
|
Liberal gain from Conservative |
Swing |
+8.17 |
| Called on the resignation of Peter Penashue, March 14, 2013 |
| Source: "By-election May 13, 2013". Elections Canada. May 13, 2013. Retrieved December 14, 2013.
|
| Canadian federal election, 2011 |
| Party |
Candidate |
Votes | % | ±% | Expenditures |
|
Conservative | Peter Penashue | 4,256 | 39.81 | +31.84 | $89,997.05 |
|
Liberal | Todd Russell | 4,177 | 39.07 | −31.21 | $30,016.49 |
|
New Democratic | Jacob Larkin | 2,120 | 19.83 | +1.98 | $29,968.41 |
|
Green | George C.R. Barrett | 139 | 1.30 | −2.61 | $0.00 |
| Total valid votes/Expense Limit |
10,692 | 100.0 | – | $84,468.09 |
| Total rejected, declined and unmarked ballots |
52 | 0.48 | −0.37 |
| Turnout |
10,744 | 52.91 | +14.31 |
| Eligible voters |
20,305 |
|
Conservative gain from Liberal |
Swing |
+31.52 |
| Conservative candidate Peter Penashue was found to have spent above the mandated expense limit, precipitating his resignation and subsequent by-election. |
| Sources:[9] [10] |
| Canadian federal election, 2008 |
| Party |
Candidate |
Votes | % | ±% | Expenditures |
|
Liberal | Todd Russell | 5,426 | 70.28 | +19.75 | $26,887 |
|
New Democratic | Phyllis Artiss | 1,378 | 17.85 | +8.77 | $5,886 |
|
Conservative | Lacey Lewis | 615 | 7.97 | -31.70 | $15,728 |
|
Green | Nyssa Christine McLeod | 302 | 3.91 | +3.19 | none listed |
| Total valid votes/Expense limit |
7,721 | 100.0 | – | $81,667 |
| Total rejected, declined and unmarked ballots |
66 | 0.85 | +0.40 |
| Turnout |
7,787 | 38.60 | -19.8 |
| Eligible voters |
20,175 |
|
Liberal hold |
Swing |
+5.49
|
| Canadian federal election, 2006 |
| Party |
Candidate |
Votes | % | ±% | Expenditures |
|
Liberal | Todd Russell | 5,768 | 50.53 | -0.95 | $40,903.10 |
|
Conservative | Joe Goudie | 4,528 | 39.67 | +7.34 | $36,381.98 |
|
New Democratic | Jacob Edward Larkin | 1,037 | 9.08 | -0.81 | $164.95 |
|
Green | Gail Zwicker | 82 | 0.72 | +0.08 | none listed |
| Total valid votes/Expense limit |
11,415 | 100.0 | – | $75,653 |
| Total rejected, declined and unmarked ballots |
52 | 0.45 | -0.10 |
| Turnout |
11,467 | 57.99 | +4.55 |
| Eligible voters |
19,774 |
|
Liberal hold |
Swing |
-4.14
|
| Changes are from the 2005 by-election |
| Canadian federal by-election, May 24, 2005 |
| Party |
Candidate |
Votes | % | ±% | Expenditures |
|
Liberal | Todd Russell | 5,438 | 51.48 | -10.75 | $53,970.30 |
|
Conservative | Graham Letto | 3,415 | 32.33 | +16.56 | $73,509.62 |
|
New Democratic | Frances Fry | 1,045 | 9.89 | +0.25 | $26,121.42 |
|
Independent | Ern Condon | 598 | 5.66 | -4.69 | $254.00 |
|
Green | Jason Crummey | 68 | 0.64 | -1.37 | $78.45 |
| Total valid votes/Expense limit |
10,564 | 100.0 | – | $74,995 |
| Total rejected, declined and unmarked ballots |
58 | 0.55 | +0.03 |
| Turnout |
10,622 | 53.44 | +8.62 |
| Eligible voters |
19,876 |
|
Liberal hold |
Swing |
-13.6
|
| Called on the death of Lawrence O'Brien, 16 December 2004 |
| Canadian federal election, 2004 |
| Party |
Candidate |
Votes | % | ±% | Expenditures |
|
Liberal | Lawrence O'Brien | 5,524 | 62.23 | -6.76 | $35,586.52 |
|
Conservative | Merrill Strachan | 1,400 | 15.77 | -2.85 | $17,120.09 |
|
Independent | Ern Condon | 919 | 10.35 | – | $62.50 |
|
New Democratic | Shawn Crann | 856 | 9.64 | -2.74 | none listed |
|
Green | Lori-Ann Martino | 178 | 2.01 | – | $135.00 |
| Total valid votes/Expense limit |
8,877 | 100.0 | – | $73,792 |
| Total rejected, declined and unmarked ballots |
46 | 0.52 |
| Turnout |
8,923 | 44.82 |
| Eligible voters |
19,909 |
|
Liberal hold |
Swing |
-1.96
|
| Change for the Conservatives is based on the combined totals of the Progressive Conservatives and the Canadian Alliance. |
Grand Falls—White Bay—Labrador, 1952–1987
Grand Falls—White Bay, 1949–1952