Saint John—Rothesay
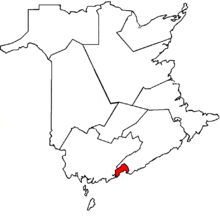 Saint John in relation to other New Brunswick federal electoral districts (2003 boundaries) | |||
| Coordinates: | 45°17′31″N 66°02′02″W / 45.292°N 66.034°WCoordinates: 45°17′31″N 66°02′02″W / 45.292°N 66.034°W | ||
| Federal electoral district | |||
| Legislature | House of Commons | ||
| MP |
Liberal | ||
| District created | 1914 | ||
| First contested | 1917 | ||
| Last contested | 2015 | ||
| District webpage | profile, map | ||
| Demographics | |||
| Population (2011)[1] | 82,129 | ||
| Electors (2015) | 61,223 | ||
| Area (km²)[1] | 457 | ||
| Pop. density (per km²) | 179.7 | ||
| Census divisions | Kings, Saint John | ||
| Census subdivisions | Rothesay, Saint John, Simonds, The Brothers 18 | ||
Saint John—Rothesay (formerly Saint John) is a federal electoral district in southern New Brunswick, Canada. With its predecessor ridings, St. John—Albert and Saint John—Lancaster, the area has been represented in the House of Commons of Canada since 1917.
The district has always included the city of Saint John, and various suburbs and bedroom communities have been added or removed from it over the years. Presently the district also includes the town of Rothesay, the Indian reserve of Brothers 18 and part of Simonds Parish.
The neighbouring ridings are Fundy Royal and New Brunswick Southwest.
History
Originally, Saint John had a special setup for representation in Parliament. The "City of St. John" returned one member, while the "City and County of St. John", which included the County of Saint John returned one as well. Between 1872 and 1896, the "City and County" riding elected two Members of Parliament. In effect, the city itself had two or even three Members of Parliament. This practice continued until 1914.
After 1914, the counties of Saint John and Albert were joined. The two existing ridings were merged into a new riding, called "St. John—Albert", that also incorporated parts of King's and Albert riding. The new riding returned two Members of Parliament until 1935.
In 1966, St. John—Albert was abolished when Albert County was moved to the Fundy—Royal riding. A new riding, "Saint John—Lancaster", was created.
Saint John—Lancaster was abolished in the 1976 redistribution, and a new riding with substantially the same boundaries was created and named "Saint John". The City of Lancaster had been amalgamated into Saint John.
In recent years, the Progressive Conservative Party has had the most success in the city: its members were elected in all but four elections since 1953: 1974, 1980, 2004, and 2006. Well-known Members of Parliament from the area include Father of Confederation Samuel Leonard Tilley, former Veterans Affairs Minister Gerald Merrithew and popular former mayor Elsie Wayne.
As per the 2012 federal electoral redistribution, this riding was renamed Saint John—Rothesay and lost a small portion of territory to Fundy Royal.
| Historical population | ||
|---|---|---|
| Year | Pop. | ±% |
| 2001 | 83,463 | — |
| 2006 | 82,078 | −1.7% |
| 2011 | 84,670 | +3.2% |
Members of Parliament
These ridings have elected the following Members of Parliament:
Election results
Saint John—Rothesay, 2013 representation order
| Canadian federal election, 2015 | ||||||||
|---|---|---|---|---|---|---|---|---|
| Party | Candidate | Votes | % | ±% | Expenditures | |||
| Liberal | Wayne Long | 20,634 | 48.80 | +32.81 | $54,324.17 | |||
| Conservative | Rodney Weston | 12,915 | 30.55 | -19.17 | $89,182.85 | |||
| New Democratic | AJ Griffin | 7,411 | 17.53 | -13.20 | $49,014.91 | |||
| Green | Sharon Murphy | 1,321 | 3.12 | +0.37 | $2,811.24 | |||
| Total valid votes/Expense limit | 42,281 | 100.00 | $196,401.18 | |||||
| Total rejected ballots | 205 | 0.48 | – | |||||
| Turnout | 42,486 | 69.38 | – | |||||
| Eligible voters | 61,236 | |||||||
| Liberal gain from Conservative | Swing | +25.99 | ||||||
| Source: Elections Canada[2][3] | ||||||||
| 2011 federal election redistributed results[4] | |||
|---|---|---|---|
| Party | Vote | % | |
| Conservative | 17,881 | 49.72 | |
| New Democratic | 11,052 | 30.73 | |
| Liberal | 5,750 | 15.99 | |
| Green | 992 | 2.76 | |
| Others | 288 | 0.80 | |
Saint John, 2003 Representation Order
| Canadian federal election, 2011 | ||||||||
|---|---|---|---|---|---|---|---|---|
| Party | Candidate | Votes | % | ±% | Expenditures | |||
| Conservative | Rodney Weston | 18,456 | 49.73 | +10.18 | $79,348.63 | |||
| New Democratic | Rob Moir | 11,382 | 30.67 | +14.71 | $23,584.68 | |||
| Liberal | Stephen Chase | 5,964 | 16.07 | -22.06 | $42,496.31 | |||
| Green | Sharon Murphy-Flatt | 1,017 | 2.74 | -2.68 | $2,700.77 | |||
| Independent | Arthur Watson Jr. | 294 | 0.79 | – | $251.37 | |||
| Total valid votes/Expense limit | 37,113 | 100.0 | $82,011.29 | |||||
| Total rejected, unmarked and declined ballots | 176 | 0.47 | ||||||
| Turnout | 37,289 | 58.02 | +4.01 | |||||
| Eligible voters | 64,264 | |||||||
| Conservative hold | Swing | -2.26 | ||||||
| Sources:[5][6] | ||||||||
| Canadian federal election, 2008 | ||||||||
|---|---|---|---|---|---|---|---|---|
| Party | Candidate | Votes | % | ±% | Expenditures | |||
| Conservative | Rodney Weston | 13,782 | 39.55 | +0.25 | $73,497.84 | |||
| Liberal | Paul Zed | 13,285 | 38.13 | -4.79 | $69,234.99 | |||
| New Democratic | Tony Mowery | 5,560 | 15.96 | +0.32 | $2,720.91 | |||
| Green | Mike Richardson | 1,888 | 5.42 | +3.28 | $1,008.49 | |||
| Marijuana | Michael Moffat | 330 | 0.95 | – | none listed | |||
| Total valid votes/Expense limit | 34,845 | 100.0 | $79,702 | |||||
| Total rejected, unmarked and declined ballots | 187 | 0.53 | ±0 | |||||
| Turnout | 35,032 | 54.01 | -7.38 | |||||
| Eligible voters | 64,868 | |||||||
| Conservative gain from Liberal | Swing | +2.52 | ||||||
| Canadian federal election, 2006 | ||||||||
|---|---|---|---|---|---|---|---|---|
| Party | Candidate | Votes | % | ±% | Expenditures | |||
| Liberal | Paul Zed | 17,202 | 42.92 | -0.36 | $55,428.82 | |||
| Conservative | John Wallace | 15,753 | 39.30 | +5.68 | $65,915.16 | |||
| New Democratic | Terry Albright | 6,267 | 15.64 | -3.42 | $6,294.91 | |||
| Green | Vern Garnett | 858 | 2.14 | -0.08 | none listed | |||
| Total valid votes/Expense limit | 40,080 | 100.0 | $74,214 | |||||
| Total rejected, unmarked and declined ballots | 214 | 0.53 | ||||||
| Turnout | 40,294 | 61.39 | +6.36 | |||||
| Eligible voters | 65,639 | |||||||
| Liberal hold | Swing | -3.02 | ||||||
| Canadian federal election, 2004 | ||||||||
|---|---|---|---|---|---|---|---|---|
| Party | Candidate | Votes | % | ±% | Expenditures | |||
| Liberal | Paul Zed | 15,725 | 43.28 | +13.12 | $60,257.89 | |||
| Conservative | Bob McVicar | 12,212 | 33.62 | -25.88 | $59,750.72 | |||
| New Democratic | Terry Albright | 6,926 | 19.06 | +10.34 | $13,450.03 | |||
| Green | Jonathan Cormier | 807 | 2.22 | +1.92 | $1,401.24 | |||
| Marijuana | Jim Wood | 369 | 1.02 | -0.38 | none listed | |||
| Independent | Tom Oland | 290 | 0.80 | – | $235.21 | |||
| Total valid votes/Expense limit | 36,329 | 100.0 | $73,296 | |||||
| Total rejected, unmarked and declined ballots | 224 | 0.61 | ||||||
| Turnout | 36,553 | 55.03 | -5.46 | |||||
| Eligible voters | 66,423 | |||||||
| Liberal notional gain from Progressive Conservative | Swing | +19.50 | ||||||
| Changes from 2000 are based on redistributed results. Change for the Conservative Party is based on the combined total of the Progressive Conservative Party and the Canadian Alliance. | ||||||||
| 2000 federal election redistributed results | |||
|---|---|---|---|
| Party | Vote | % | |
| Progressive Conservative | 19,236 | 49.05 | |
| Liberal | 11,829 | 30.16 | |
| Alliance | 4,099 | 10.45 | |
| New Democratic | 3,421 | 8.72 | |
| Others | 635 | 1.62 | |
Saint John, 1996 Representation Order
| Canadian federal election, 2000 | ||||||||
|---|---|---|---|---|---|---|---|---|
| Party | Candidate | Votes | % | ±% | ||||
| Progressive Conservative | Elsie Wayne | 16,751 | 50.9 | -12.2 | ||||
| Liberal | Paul Zed | 9,535 | 29.0 | +13.1 | ||||
| New Democratic | Rod Hill | 2,989 | 9.1 | -1.3 | ||||
| Alliance | Peter Touchbourne | 2,980 | 9.1 | -0.7 | ||||
| Marijuana | Jim Wood | 461 | 1.4 | +1.4 | ||||
| Green | Vern Garnett | 131 | 0.3 | +0.3 | ||||
| Natural Law | Miville Couture | 52 | 0.2 | -0.5 | ||||
| Total valid votes | 32,899 | 100.0 | ||||||
| Canadian federal election, 1997 | ||||||||
|---|---|---|---|---|---|---|---|---|
| Party | Candidate | Votes | % | ±% | ||||
| Progressive Conservative | Elsie Wayne | 22,227 | 63.1 | +19.8 | ||||
| Liberal | Diana Alexander | 5,612 | 15.9 | -17.7 | ||||
| New Democratic | Larry Hanley | 3,679 | 10.4 | +6.3 | ||||
| Reform | George Richardson | 3,467 | 9.8 | +3.6 | ||||
| Natural Law | Christopher B. Collrin | 232 | 0.7 | n/c | ||||
| Total valid votes | 35,217 | 100.0 | ||||||
Saint John, previous elections
| Canadian federal election, 1993 | ||||||||
|---|---|---|---|---|---|---|---|---|
| Party | Candidate | Votes | % | ±% | ||||
| Progressive Conservative | Elsie Wayne | 15,123 | 43.3 | +0.2 | ||||
| Liberal | Pat Landers | 11,736 | 33.6 | -5.0 | ||||
| Independent | Joe Boyce | 3,685 | 10.6 | +10.6 | ||||
| Reform | John Erbs | 2,171 | 6.2 | +6.2 | ||||
| New Democratic | Shirley Brown | 1,443 | 4.1 | -8.4 | ||||
| Canada Party | Jim Webb | 368 | 1.1 | +1.1 | ||||
| Natural Law | Christopher Collrin | 252 | 0.7 | +0.7 | ||||
| National | Joy Hobson | 146 | 0.4 | +0.4 | ||||
| Total valid votes | 34,924 | 100.0 | ||||||
| Canadian federal election, 1988 | ||||||||
|---|---|---|---|---|---|---|---|---|
| Party | Candidate | Votes | % | ±% | ||||
| Progressive Conservative | Gerry Merrithew | 16,798 | 43.1 | -9.1 | ||||
| Liberal | Joe Boyce | 15,067 | 38.6 | +13.1 | ||||
| New Democratic | Judith Meinert | 4,883 | 12.5 | -8.7 | ||||
| Confederation of Regions | Jim Webb | 1,806 | 4.6 | +4.6 | ||||
| Libertarian | Thomas Gamblin | 289 | 0.7 | -0.1 | ||||
| Independent | Gary Zatzman | 162 | 0.4 | +0.4 | ||||
| Total valid votes | 39,005 | 100.0 | ||||||
| Canadian federal election, 1984 | ||||||||
|---|---|---|---|---|---|---|---|---|
| Party | Candidate | Votes | % | ±% | ||||
| Progressive Conservative | Gerry Merrithew | 16,604 | 52.2 | +13.2 | ||||
| Liberal | Cliff Warner | 8,109 | 25.5 | -15.9 | ||||
| New Democratic | Mary Palmer | 6,752 | 21.2 | +2.3 | ||||
| Libertarian | Peter Jones | 242 | 0.8 | +0.6 | ||||
| Social Credit | Gordon Simons | 102 | 0.3 | +0.3 | ||||
| Total valid votes | 31,809 | 100.0 | ||||||
| Canadian federal election, 1980 | ||||||||
|---|---|---|---|---|---|---|---|---|
| Party | Candidate | Votes | % | ±% | ||||
| Liberal | Mike Landers | 13,122 | 41.4 | +1.8 | ||||
| Progressive Conservative | Eric Ferguson | 12,363 | 39.0 | -2.6 | ||||
| New Democratic | David M. Brown | 5,978 | 18.9 | n/c | ||||
| Independent | Marilynn Fox | 103 | 0.3 | +0.3 | ||||
| Libertarian | Peter Jones | 66 | 0.2 | +0.2 | ||||
| Marxist–Leninist | Gilles DesRosiers | 35 | 0.1 | +0.1 | ||||
| Total valid votes | 31,667 | 100.0 | ||||||
| Canadian federal election, 1979 | ||||||||
|---|---|---|---|---|---|---|---|---|
| Party | Candidate | Votes | % | ±% | ||||
| Progressive Conservative | Eric Ferguson | 13,989 | 41.6 | +0.6 | ||||
| Liberal | Mike Landers | 13,316 | 39.6 | -6.5 | ||||
| New Democratic | Eldon Richardson | 6,358 | 18.9 | +6.5 | ||||
| Total valid votes | 33,663 | 100.0 | ||||||
Saint John—Lancaster, 1966–1976
| Canadian federal election, 1974 | ||||||||
|---|---|---|---|---|---|---|---|---|
| Party | Candidate | Votes | % | ±% | ||||
| Liberal | Mike Landers | 12,860 | 46.1 | +3.9 | ||||
| Progressive Conservative | Tom Bell | 11,419 | 41.0 | -12.9 | ||||
| New Democratic | Eldon Richardson | 3,457 | 12.4 | +9.9 | ||||
| Marxist–Leninist | Jay Baxter | 118 | 0.4 | +0.4 | ||||
| Total valid votes | 27,854 | 100.0 | ||||||
| Canadian federal election, 1972 | ||||||||
|---|---|---|---|---|---|---|---|---|
| Party | Candidate | Votes | % | ±% | ||||
| Progressive Conservative | Tom Bell | 16,350 | 53.9 | +0.9 | ||||
| Liberal | William Ryan | 12,783 | 42.2 | +1.2 | ||||
| New Democratic | Joe Drummond | 788 | 2.5 | -2.6 | ||||
| Social Credit | Tom Enright | 394 | 1.3 | +1.3 | ||||
| Total valid votes | 30,315 | 100.0 | ||||||
| Canadian federal election, 1968 | ||||||||
|---|---|---|---|---|---|---|---|---|
| Party | Candidate | Votes | % | ±% | ||||
| Progressive Conservative | Tom Bell | 15,756 | 53.0 | +1.6 | ||||
| Liberal | William Ryan | 12,160 | 41.0 | +4.4 | ||||
| New Democratic | Eldon Richardson | 1,508 | 5.1 | -6.8 | ||||
| Independent | Mildred Crawford | 268 | 0.9 | +0.9 | ||||
| Total valid votes | 29,692 | 100.0 | ||||||
St. John—Albert 1914–1966
| Canadian federal election, 1965 | ||||||||
|---|---|---|---|---|---|---|---|---|
| Party | Candidate | Votes | % | ±% | ||||
| Progressive Conservative | Tom Bell | 21,909 | 51.4 | -0.3 | ||||
| Liberal | Arthur Whelly | 15,609 | 36.6 | -3.3 | ||||
| New Democratic | Eldon Richardson | 5,081 | 11.9 | +7.4 | ||||
| Total valid votes | 42,599 | 100.0 | ||||||
| Canadian federal election, 1963 | ||||||||
|---|---|---|---|---|---|---|---|---|
| Party | Candidate | Votes | % | ±% | ||||
| Progressive Conservative | Tom Bell | 21,584 | 51.7 | -0.1 | ||||
| Liberal | Arthur Whelly | 16,669 | 39.9 | +1.4 | ||||
| New Democratic | John Simonds | 1,869 | 4.5 | -1.6 | ||||
| Social Credit | Paul Sherwood | 1,606 | 3.8 | +0.1 | ||||
| Total valid votes | 41,728 | 100.0 | ||||||
| Canadian federal election, 1962 | ||||||||
|---|---|---|---|---|---|---|---|---|
| Party | Candidate | Votes | % | ±% | ||||
| Progressive Conservative | Tom Bell | 22,586 | 51.8 | -12.1 | ||||
| Liberal | George Urquhart | 16,790 | 38.5 | +5.6 | ||||
| New Democratic | Eldon Richardson | 2,641 | 6.1 | +2.8 | ||||
| Social Credit | Harvey Lainson | 1,608 | 3.7 | +3.7 | ||||
| Total valid votes | 43,625 | 100.0 | ||||||
| Canadian federal election, 1958 | ||||||||
|---|---|---|---|---|---|---|---|---|
| Party | Candidate | Votes | % | ±% | ||||
| Progressive Conservative | Tom Bell | 21,983 | 63.9 | +10.3 | ||||
| Liberal | George McLeod | 13,917 | 32.9 | -13.5 | ||||
| Co-operative Commonwealth | Eldon Richardson | 1,394 | 3.3 | +3.3 | ||||
| Total valid votes | 37,294 | 100.0 | ||||||
| Canadian federal election, 1957 | ||||||||
|---|---|---|---|---|---|---|---|---|
| Party | Candidate | Votes | % | ±% | ||||
| Progressive Conservative | Tom Bell | 21,983 | 53.6 | +4.1 | ||||
| Liberal | Daniel Riley | 19,047 | 46.4 | -1.7 | ||||
| Total valid votes | 41,030 | 100.0 | ||||||
| Canadian federal election, 1953 | ||||||||
|---|---|---|---|---|---|---|---|---|
| Party | Candidate | Votes | % | ±% | ||||
| Progressive Conservative | Tom Bell | 18,881 | 49.5 | +4.8 | ||||
| Liberal | Daniel Riley | 18,338 | 48.1 | -0.8 | ||||
| Co-operative Commonwealth | Raymond McAfee | 933 | 2.4 | -4.0 | ||||
| Total valid votes | 38,152 | 100.0 | ||||||
| Canadian federal election, 1949 | ||||||||
|---|---|---|---|---|---|---|---|---|
| Party | Candidate | Votes | % | ±% | ||||
| Liberal | Daniel Riley | 18,691 | 48.9 | +7.8 | ||||
| Progressive Conservative | Douglas King Hazen | 17,052 | 44.7 | -2.1 | ||||
| Co-operative Commonwealth | Raymond McAfee | 2,445 | 6.4 | -5.6 | ||||
| Total valid votes | 38,188 | 100.0 | ||||||
| Canadian federal election, 1945 | ||||||||
|---|---|---|---|---|---|---|---|---|
| Party | Candidate | Votes | % | ±% | ||||
| Progressive Conservative | Douglas King Hazen | 16,205 | 46.8 | -3.5 | ||||
| Liberal | David Lawrence MacLaren | 14,248 | 41.1 | -6.1 | ||||
| Co-operative Commonwealth | William Arrowsmith | 761 | 12.0 | +9.5 | ||||
| Total valid votes | 31,214 | 100.0 | ||||||
| Canadian federal election, 1940 | ||||||||
|---|---|---|---|---|---|---|---|---|
| Party | Candidate | Votes | % | ±% | ||||
| National Government | Douglas King Hazen | 15,110 | 50.3 | +13.4 | ||||
| Liberal | Allan McAvity | 14,197 | 47.2 | -0.8 | ||||
| Co-operative Commonwealth | James Fritch | 761 | 2.5 | +2.5 | ||||
| Total valid votes | 30,068 | 100.0 | ||||||
Note: popular vote is compared to 1935 general election.
| By-election on February 21, 1938
On William Ryan's death, April 1, 1938 | |||||
| Party | Candidate | Votes | |||
|---|---|---|---|---|---|
| Liberal | Allan McAvity | acclaimed | |||
| Canadian federal election, 1935 | ||||||||
|---|---|---|---|---|---|---|---|---|
| Party | Candidate | Votes | % | ±% | ||||
| Liberal | William Ryan | 15,125 | 48.0 | +13.9 | ||||
| Conservative | Douglas King Hazen | 11,643 | 36.9 | -19.0 | ||||
| Reconstruction | Paul Cross | 4,094 | 13.0 | |||||
| Independent Liberal | Howe Cowan | 672 | 2.1 | |||||
| Total valid votes | 31,534 | 100.0 | ||||||
Note: popular vote is compared to the party's total share of the popular vote in the 1930 general election.
| Canadian federal election, 1930 | ||||||||
|---|---|---|---|---|---|---|---|---|
| Party | Candidate | Votes | % | Elected | ||||
| Conservative | Murray MacLaren | 16,454 | 33.0 | |||||
| Conservative | Thomas Bell | 16,395 | 32.9 | |||||
| Liberal | Allan McAvity | 8,595 | 17.3 | |||||
| Liberal | William Ryan | 8,371 | 16.8 | |||||
| Total valid votes | 49,815 | 100.0 | ||||||
Total Conservative vote: 32,849, or 65.9% of the total, an increase of 4.2% from the 1926 general election.
Total Liberal vote: 16,966, or 34.1%, a decrease of 4.2% from the 1926 general election.
| Canadian federal election, 1926 | ||||||||
|---|---|---|---|---|---|---|---|---|
| Party | Candidate | Votes | % | Elected | ||||
| Conservative | Murray MacLaren | 12,441 | 31.0 | |||||
| Conservative | Thomas Bell | 12,310 | 30.7 | |||||
| Liberal | William Michael Ryan | 8,007 | 20.0 | |||||
| Liberal | Robert Thomas Hayes | 7,356 | 18.3 | |||||
| Total valid votes | 40,114 | 100.0% | ||||||
Total Conservative vote: 24,751, or 61.7% of the total, a decrease of 0.2% from the 1925 general election.
Total Liberal vote: 15,363, or 38.3% of the total, an increase of 0.2% from the 1925 general election.
| Canadian federal election, 1925 | ||||||||
|---|---|---|---|---|---|---|---|---|
| Party | Candidate | Votes | % | Elected | ||||
| Conservative | Murray MacLaren | 14,623 | 31.3 | |||||
| Conservative | Thomas Bell | 14,250 | 30.5 | |||||
| Liberal | Walter Edward Foster | 9,348 | 20.0 | |||||
| Liberal | Robert Thomas Hayes | 8,435 | 18.1 | |||||
| Total valid votes | 46,656 | 100.0 | ||||||
Total Conservative vote: 28,873, or 61.9% of the total, an increase of 11.6% from the 1921 general election.
Total Liberal vote: 17,783, or 38.1% of the total, a decrease of 6.7% from the 1921 general election.
| Canadian federal election, 1921 | ||||||||
|---|---|---|---|---|---|---|---|---|
| Party | Candidate | Votes | % | Elected | ||||
| Conservative | John Babington Baxter | 11,646 | 26.0 | |||||
| Conservative | Murray MacLaren | 10,901 | 24.3 | |||||
| Liberal | Harry Richards McLellan | 10,531 | 23.5 | |||||
| Liberal | William Patrick Broderick | 9,546 | 21.3 | |||||
| Progressive | Frederick Alexander Campbell | 1,224 | 2.7 | |||||
| Progressive | William Mayhew Calhoun | 985 | 2.2 | |||||
| Total valid votes | 44,833 | 100.0 | ||||||
Total Conservative vote: 22,547, or 50.3% of the total, an increase of 0.3% from the 1920 by-election.
Total Liberal vote: 20,077, or 44.8% of the total, a decrease of 5.2% from the 1920 by-election.
Total Progressive vote: 2,209, or 4.9% of the total.
| By-election on September 20, 1920 | ||||||
| Party | Candidate | Votes | % | ±% | ||
|---|---|---|---|---|---|---|
| Conservative | Rupert Wilson Wigmore | 13,611 | 50.0 | -20.8 | ||
| Liberal | Alban Frederick Emery | 13,594 | 50.0 | +20.8 | ||
| Total valid votes | 27,205 | 100.0 | ||||
Note: Conservative vote is compared to Government vote in 1917 election, and Liberal vote is compared to Opposition vote. Popular vote is compared to the party's total share of the popular vote in the 1917 general election.
| Canadian federal election, 1917 | ||||||||
|---|---|---|---|---|---|---|---|---|
| Party | Candidate | Votes | % | Elected | ||||
| Government (Unionist) | Rupert Wilson Wigmore | 13,611 | 35.4 | |||||
| Government (Unionist) | Stanley Edward Elkin | 13,594 | 35.4 | |||||
| Liberal | William Patrick Broderick | 5,694 | 14.8 | |||||
| Liberal | Alban Frederick Emery | 5,530 | 14.4 | |||||
| Total valid votes | 38,429 | 100.0 | ||||||
Total Conservative vote: 27,205, or 70.8% of the total.
Total Liberal vote: 11,224, or 29.2% of the total.
See also
References
- "(Code 13009) Census Profile". 2011 census. Statistics Canada. 2012. Retrieved 2011-03-03.
Notes
- 1 2 Statistics Canada: 2011
- ↑ Elections Canada – Confirmed candidates for Saint John—Rothesay, 30 September 2015
- ↑ Elections Canada – Preliminary Election Expenses Limits for Candidates
- ↑ Pundits' Guide to Canadian Elections
- ↑ Elections Canada – Official voting results, Forty-first general election, 2011
- ↑ Elections Canada – Candidate's electoral campaign return, 41st general election
External links
- Riding history from the Library of Parliament:
- "History of Federal Electoral Ridings Since 1867". Library of Parliament. Retrieved August 5, 2004.