Sydney—Victoria Nova Scotia electoral district Nova Scotia electoral district |
|---|
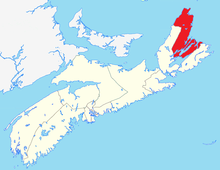 Sydney–Victoria in relation to the other Nova Scotia federal electoral districts (2003 boundaries) |
| Federal electoral district |
|---|
| Legislature |
House of Commons |
|---|
| MP |
Mark Eyking
Liberal |
|---|
| District created |
1996 |
|---|
| First contested |
1997 |
|---|
| Last contested |
2015 |
|---|
| District webpage |
profile, map |
|---|
| Demographics |
|---|
| Population (2016)[1] |
72,148 |
|---|
| Electors (2015) |
59,761 |
|---|
| Area (km²)[1] |
4,313 |
|---|
| Pop. density (per km²) |
16.7 |
|---|
| Census divisions |
Cape Breton, Inverness, Victoria |
|---|
| Census subdivisions |
Cape Breton, Eskasoni 3, Inverness Subd. A, Membertou 28B, Victoria, Subd. A, Victoria, Subd. B, Wagmatcook 1 |
|---|
Sydney—Victoria is a federal electoral district in Nova Scotia, Canada, that has been represented in the House of Commons of Canada since 1997.
It was created in 1996 from parts of Cape Breton—The Sydneys, Cape Breton—East Richmond and Cape Breton Highlands—Canso ridings.
Cape Breton—Canso is the only adjacent riding.
Demographics
| Historical population |
|---|
| Year | Pop. | ±% |
|---|
| 2001 | 79,294 | — |
|---|
| 2006 | 76,801 | −3.1% |
|---|
| 2011 | 73,328 | −4.5% |
|---|
| 2016 | 72,148 | −1.6% |
|---|
- According to the Canada 2011 Census; 2013 representation[2][3]
Ethnic groups: 88.5 White, 8.9% Aboriginal, 1.1% Black
Languages: 92.9% English, 4.6% Mi'kmaq, 1.2% French
Religions: 90.7% Christian (62.8% Catholic, 8.3% United Church, 7.5% Anglican, 4.0% Presbyterian, 1.9% Baptist, 6.2% Other), 8.0% No religion
Median income (2010): $23,704
Average income (2010): $30,202
- According to the Canada 2016 Census
- Languages: (2016) 93.3% English, 4.1% Mi’kmaq, 0.9% French, 0.3% Mandarin, 0.1% Arabic, 0.1% Urdu, 0.1% German, 0.1% Tagalog, 0.1% Dutch, 0.1% Cantonese, 0.1% Italian, 0.1% Scottish Gaelic[4]
Geography
It consists of:
- The County of Victoria;
- the northern part of the County of Inverness, i.e., the part lying north of the southern boundary of Cape Breton Highlands National Park; and
- the northwestern part of the Cape Breton Regional Municipality, i.e., the part lying northwest of a line drawn northeast from Bras d'Or Lake to the northeast extremity of East Bay, due north to Portage Brook, northeast along Portage Brook, Blacketts Lake, the Sydney River, Highway 125, Trunk 4 (Grand Lake Road), Northwest Brook, the western shoreline of Grand Lake, the DEVCO Railway, and its northern branch (running towards the Community of Dominion) to its second intersection with Northwest Brook (north of Grand Lake), and then north and northeast along that brook, Lingan Bay and Indian Bay to the Atlantic Ocean.
This riding will maintain its boundaries as per the 2012 federal electoral redistribution.
Election results
Sydney—Victoria, 2013 Representation Order
| Canadian federal election, 2015 |
| Party |
Candidate |
Votes | % | ±% | Expenditures |
|
Liberal | Mark Eyking | 29,995 | 73.20 | +33.29 | – |
|
New Democratic | Monika Dutt | 5,351 | 13.06 | –5.97 | $32,027.50 |
|
Conservative | John Douglas Chiasson | 4,360 | 10.64 | –27.21 | $41,720.11 |
|
Green | Adrianna MacKinnon | 1,026 | 2.50 | –0.71 | – |
|
Libertarian | Wayne James Hiscock | 242 | 0.59 | – | – |
| Total valid votes/Expense limit |
40,974 | 100.00 | | $195,473.50 |
| Total rejected ballots |
236 | 0.57 |
| Turnout |
41,210 | 68.96 |
| Eligible voters |
59,761 |
|
Liberal hold |
Swing |
+19.63
|
| Source: Elections Canada[5][6] |
Sydney—Victoria, 2003 Representation Order
| Canadian federal election, 2011 |
| Party |
Candidate |
Votes | % | ±% | Expenditures |
|
Liberal | Mark Eyking | 14,788 | 39.91 | -9.49 | $67,454.53 |
|
Conservative | Cecil Clarke | 14,023 | 37.85 | +17.23 | $77,334.98 |
|
New Democratic | Kathy MacLeod | 7,049 | 19.02 | -5.42 | $17,238.77 |
|
Green | Chris Milburn | 1,191 | 3.21 | -2.33 | $0.00 |
| Total valid votes/Expense limit |
37,051 | 100.0 | | $80,666.28 |
| Total rejected, unmarked and declined ballots |
279 | 0.75 | +0.03 |
| Turnout |
37,330 | 61.48 | +4.07 |
| Eligible voters |
60,719 |
|
Liberal hold |
Swing |
-13.36
|
| Sources:[7][8] |
| Canadian federal election, 2008 |
| Party |
Candidate |
Votes | % | ±% | Expenditures |
|
Liberal | Mark Eyking | 17,303 | 49.40 | -0.48 | $60,561.52 |
|
New Democratic | Wayne McKay | 8,559 | 24.44 | -4.06 | $15,485.05 |
|
Conservative | Kristen Rudderham | 7,223 | 20.62 | +2.28 | $60,092.18 |
|
Green | Collin Harker | 1,941 | 5.54 | +2.25 | $1,966.54 |
| Total valid votes/Expense limit |
35,026 | 100.0 | | $78,337 |
| Total rejected, unmarked and declined ballots |
254 | 0.72 | +0.16 |
| Turnout |
35,280 | 57.41 | -5.89 |
| Eligible voters |
61,448 |
|
Liberal hold |
Swing |
+1.79
|
| Canadian federal election, 2006 |
| Party |
Candidate |
Votes | % | ±% | Expenditures |
|
Liberal | Mark Eyking | 20,277 | 49.88 | -2.25 | $47,473.95 |
|
New Democratic | John Hugh Edwards | 11,587 | 28.50 | +0.79 | $28,987.58 |
|
Conservative | Howie MacDonald | 7,455 | 18.34 | +2.47 | $26,033.71 |
|
Green | Chris Milburn | 1,336 | 3.29 | +0.99 | $537.60 |
| Total valid votes/Expense limit |
40,655 | 100.0 | | $73,953 |
| Total rejected, unmarked and declined ballots |
227 | 0.56 | -0.23 |
| Turnout |
40,882 | 63.30 | +2.72 |
| Eligible voters |
64,589 |
|
Liberal hold |
Swing |
-1.52
|
| Canadian federal election, 2004 |
| Party |
Candidate |
Votes | % | ±% | Expenditures |
|
Liberal | Mark Eyking | 19,372 | 52.13 | +2.14 | $51,343.95 |
|
New Democratic | John Hugh Edwards | 10,298 | 27.71 | -8.50 | $24,957.69 |
|
Conservative | Howie MacDonald | 5,897 | 15.87 | +2.08 | $48,515.46 |
|
Green | Chris Milburn | 855 | 2.30 | – | $580.41 |
|
Marijuana | Cathy Thériault | 474 | 1.28 | – | none listed |
|
Independent | B. Chris Gallant | 264 | 0.71 | – | $165.54 |
| Total valid votes/Expense limit |
37,160 | 100.0 | | $71,187 |
| Total rejected, unmarked and declined ballots |
297 | 0.79 |
| Turnout |
37,457 | 60.58 |
| Eligible voters |
61,826 |
|
Liberal notional hold |
Swing |
+5.32
|
| Changes from 2000 are based on redistributed results. Conservative Party change is based on the combination of Canadian Alliance and Progressive Conservative Party totals. |