Ayr, Carrick and Cumnock (UK Parliament constituency)
Coordinates: 55°18′04″N 4°37′05″W / 55.301°N 4.618°W
| Ayr, Carrick and Cumnock | |
|---|---|
|
County constituency for the House of Commons | |
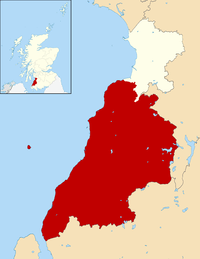
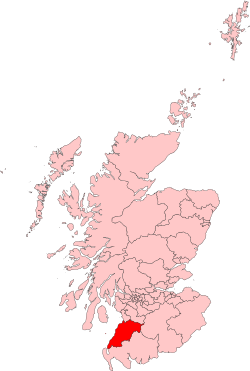 Boundary of Ayr, Carrick and Cumnock in Scotland for the 2005 general election. | |
| Subdivisions of Scotland |
East Ayrshire, South Ayrshire |
| Population | 93,308 (2011 census) |
| Electorate | 69,299 (2015) |
| Current constituency | |
| Created | 2005 |
| Member of parliament | Bill Grant (Conservative) |
| Created from |
Ayr, Carrick, Cumnock & Doon Valley |
| Overlaps | |
| Scottish Parliament |
Ayr, Carrick, Cumnock & Doon Valley, South Scotland |
| European Parliament constituency | Scotland |
Ayr, Carrick, and Cumnock is a county constituency represented in the House of Commons of the Parliament of the United Kingdom. It was created for the 2005 general election from parts of the old Ayr and Carrick, Cumnock and Doon Valley constituencies. It has been represented since 2017 by Bill Grant of the Scottish Conservative Party.
Boundaries
2005 onwards
As defined by the Fifth Review of UK Parliament constituencies, the constituency covers the South Ayrshire electoral wards of Ayr Whitletts; Ayr Lochside; Ayr Newton; Ayr Craigie; Ayr Central; Ayr Fort; Ayr Forehill; Ayr Masonhill; Ayr Belmont; Ayr Old Belmont; Ayr Rozelle; Ayr Doonfoot and Seafield; Coylton and Minishant; North Carrick and Maybole West; North Carrick and Maybole East; South Carrick; Girvan Ailsa and Girvan Glendoune plus the East Ayrshire electoral wards of Patna and Dalrymple; Dalmellington; Drongan, Stair and Rankinston; Ochiltree, Skares, Netherthird and Craigens; New Cumnock; Cumnock East and Cumnock West.
The constituency covers approximately three-fifths of the South Ayrshire council area and one-fifth of the East Ayrshire council area, with the remaining portion of the South Ayrshire council area being covered by the Central Ayrshire constituency. The remainder of East Ayrshire is covered as part of Kilmarnock and Loudoun.
Constituency profile
Demographics
The 2011 UK Census revealed that the Ayr, Carrick and Cumnock constituency had an above-average unemployment rate at 5.6% compared to the Scottish average of 4.8%, with a significant proportion of residents living in local authority housing at 20.2% compared to the Scottish average of 13.2%. The constituency also had a high proportion of retired people and Church of Scotland Protestants at the Census relative to elsewhere in Scotland, with 19% of those living in the constituency retired (14.9% across Scotland) and 43.3% of constituents recognising their religion as Church of Scotland (32.4% across Scotland). 90% of residents identified their ethnicity as White British, with 99% recognising their ethnicity as White.[1] On indicators such as health, educational attainment, income and social class, the constituency can be understood as a relatively deprived area, particularly around Girvan, Maybole, Cumnock, New Cumnock and Doon Valley.[2][3]
Constituency
Ayr is a large coastal resort town located to the north-west of the constituency, consisting of a mixture of council estates and affluent middle-class areas. The town has traditionally been the strongest part of the constituency for the Conservative Party, with Labour, and more recently the SNP, performing well towards the more industrialised area north of the town and the Conservatives performing stronger in the suburbs in the south of the town.
To the south-west of the constituency is the fairly deprived rural region of Carrick, running down the Ayrshire coast between Ayr and Galloway. This area has traditionally been more hospitable to the Labour Party, and more recently the SNP, in comparison to Ayr, with the Conservatives performing better in rural areas. To the north of Carrick, the village of Coylton has returned a strong vote for Conservative candidates in previous elections.
Further east, the constituency stretches into the south of the East Ayrshire Council area to cover a set of deprived former mining communities around Cumnock and Doon Valley - a very deprived area which has traditionally returned a much stronger vote for the Labour Party and weaker Conservative vote in comparison to elsewhere in the Ayr, Carrick and Cumnock constituency.[4][5][6][2]
Voting patterns
UK Parliament
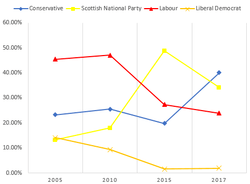
In 2005, approximately two-thirds of the former Carrick, Cumnock and Doon Valley constituency was attached to half of the former marginal seat of Ayr to form the Ayr, Carrick and Cumnock constituency. Carrick, Cumnock and Doon Valley had been represented in the UK Parliament by the Labour Party since the 1935 general election, whilst Ayr was represented by the Conservative Party from the 1906 general election until Labour gained the seat during their 1997 landslide electoral victory, from which point onwards the constituency was represented by Labour, with the Conservatives coming in a close second place.
The newly formed Ayr, Carrick and Cumnock constituency was won by Labour's Sandra Osborne at the 2005 general election with a majority of 9,997 votes (22.2%) ahead of the Conservatives. This was reduced slightly to 9,911 votes (21.6%) in 2010, before the constituency fell to the SNP at the 2015 SNP landslide, with SNP candidate Corri Wilson overturning incumbent Labour MP Sandra Osborne's 13,356 vote lead over the SNP (29.1%), securing the constituency with a majority of 11,265 votes (21.6%). Bill Grant of the Conservatives gained the seat at the 2017 snap general election with a majority of 2,774 votes (6.0%) over Corri Wilson of the SNP.
Scottish Parliament
The constituency overlaps the Scottish Parliamentary constituencies of Ayr and Carrick, Cumnock and Doon Valley. Ayr has been represented by Conservative MSP John Scott since a by-election in 2000. Carrick, Cumnock and Doon Valley has been represented by the SNP since the 2011 Scottish Parliamentary election. The current MSP for Carrick, Cumnock and Doon Valley is Jeane Freeman.
Local Council elections
The Conservatives have been the largest party on South Ayrshire Council since 2003, taking control of the Council in 2006. The Ayr West ward has traditionally been the strongest part of the Council for the Conservative party, with Ayr East also returning a considerable Conservative vote. More recently, the party have also gained votes in the more rural area of Carrick to the south of Ayr, with the SNP forming the largest party in the Ayr North ward.
The SNP have formed the largest party on East Ayrshire Council since 2012, however, Labour remain the largest party in Cumnock and Doon Valley, the part of East Ayrshire covered by the Ayr, Carrick and Cumnock parliamentary constituency.
Members of Parliament
| Portrait | Name | In office | Party | ||
|---|---|---|---|---|---|
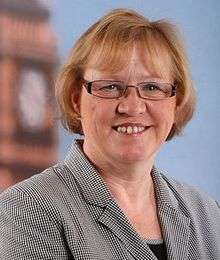 |
Sandra Osborne | 1 May 1997 | 30 March 2015 | Labour | |
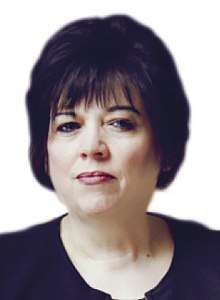 |
Corri Wilson | 8 May 2015 | 3 May 2017 | Scottish National Party | |
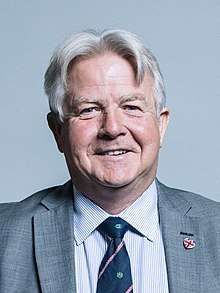 |
Bill Grant | 4 May 2017 | Incumbent | Conservative | |
Election results
2017
| Party | Candidate | Votes | % | ± | |
|---|---|---|---|---|---|
| Conservative | Bill Grant | 18,550 | 40.1 | +20.3 | |
| SNP | Corri Wilson | 15,776 | 34.1 | -14.7 | |
| Labour | Carol Mochan | 11,024 | 23.9 | -3.4 | |
| Liberal Democrat | Callum Leslie | 872 | 1.9 | +0.2 | |
| Majority | 2,774 | 6.0 | N/A | ||
| Turnout | 46,296 | 64.9 | -6.6 | ||
| Conservative gain from SNP | Swing | +17.5 | |||
2015
| Party | Candidate | Votes | % | ± | |
|---|---|---|---|---|---|
| SNP | Corri Wilson | 25,492 | 48.8 | +30.8 | |
| Labour | Sandra Osborne | 14,227 | 27.3 | −19.9 | |
| Conservative | Lee Lyons | 10,355 | 19.8 | −5.7 | |
| UKIP | Joseph Adam-Smith[10] | 1,280 | 2.5 | N/A | |
| Liberal Democrat | Richard Brodie | 855 | 1.6 | −7.7 | |
| Majority | 11,265 | 21.6 | N/A | ||
| Turnout | 52,209 | 71.5 | +8.9 | ||
| SNP gain from Labour | Swing | +25.4 | |||
2010
| Party | Candidate | Votes | % | ± | |
|---|---|---|---|---|---|
| Labour | Sandra Osborne | 21,632 | 47.1 | +1.8 | |
| Conservative | Bill Grant | 11,721 | 25.5 | +2.4 | |
| SNP | Chic Brodie | 8,276 | 18.0 | +4.9 | |
| Liberal Democrat | James Taylor | 4,264 | 9.3 | −4.8 | |
| Majority | 9,911 | 21.6 | -0.6 | ||
| Turnout | 45,893 | 62.6 | +0.7 | ||
| Labour hold | Swing | −0.3 | |||
2005
| Party | Candidate | Votes | % | ± | |
|---|---|---|---|---|---|
| Labour | Sandra Osborne | 20,433 | 45.4 | N/A | |
| Conservative | Mark Jones | 10,436 | 23.2 | N/A | |
| Liberal Democrat | Colin Waugh | 6,341 | 14.1 | N/A | |
| SNP | Chic Brodie | 5,932 | 13.2 | N/A | |
| Scottish Senior Citizens | Donald Sharp | 592 | 1.3 | N/A | |
| Scottish Socialist | Murray Steele | 554 | 1.2 | N/A | |
| Socialist Labour | James McDaid | 395 | 0.9 | N/A | |
| UKIP | Bryan McCormack | 365 | 0.8 | N/A | |
| Majority | 9,997 | 22.2 | |||
| Turnout | 45,048 | 61.3 | |||
| Labour win (new seat) | |||||
References
- ↑ http://www.scotlandscensus.gov.uk/ods-web/area.html 'Ayr, Carrick and Cumnock'
- 1 2 http://simd.scot/2016/ 'Scottish Index of Multiple Deprivation 2016'
- ↑ http://www.electoralcalculus.co.uk/datamap.html 'Data Map'
- ↑ http://www.electionscentre.co.uk/wp-content/uploads/2015/10/Scottish-Council-Elections-2003.pdf 'Scottish Council Elections 2003'
- ↑ http://www.south-ayrshire.gov.uk/council-election/results2017.aspx 'South Ayrshire Council Election 2017 results'
- ↑ https://www.east-ayrshire.gov.uk/news/article/scottish-local-government-elections-2017-results 'East Ayrshire Scottish Local Government Elections 2017 results'
- ↑
- ↑ "Election Data 2015". Electoral Calculus. Archived from the original on 17 October 2015. Retrieved 17 October 2015.
- ↑ http://www.south-ayrshire.gov.uk/documents/ayr%20carrick%20cumnock%20results.pdf
- ↑ http://ukpollingreport.co.uk/2015guide/ayrcarrickandcumnock/
- ↑ "Election Data 2010". Electoral Calculus. Archived from the original on 17 October 2015. Retrieved 17 October 2015.
- ↑ "Election Data 2005". Electoral Calculus. Archived from the original on 15 October 2011. Retrieved 18 October 2015.
- ↑ "Election 2005". BBC. Retrieved 28 December 2016.