Australian federal election, 2001
|
| ||||||||||||||||||||||||||||||||||
| ||||||||||||||||||||||||||||||||||
All 150 seats in the House of Representatives 76 seats were needed for a majority in the House 40 (of the 76) seats in the Senate | ||||||||||||||||||||||||||||||||||
|---|---|---|---|---|---|---|---|---|---|---|---|---|---|---|---|---|---|---|---|---|---|---|---|---|---|---|---|---|---|---|---|---|---|---|
| Registered | 12,054,664 | |||||||||||||||||||||||||||||||||
| Turnout | 94.9% | |||||||||||||||||||||||||||||||||
| ||||||||||||||||||||||||||||||||||
| ||||||||||||||||||||||||||||||||||
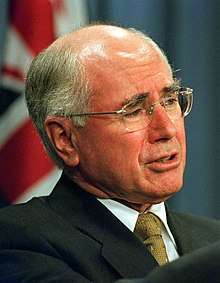
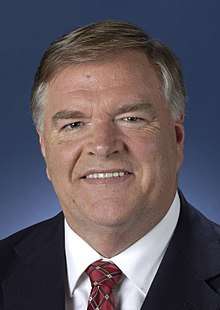
Federal elections were held in Australia on 10 November 2001. All 150 seats in the House of Representatives and 40 seats in the 76-member Senate were up for election. The incumbent Liberal Party of Australia led by Prime Minister of Australia John Howard and coalition partner the National Party of Australia led by John Anderson defeated the opposition Australian Labor Party led by Kim Beazley.
Results
House of Representatives results

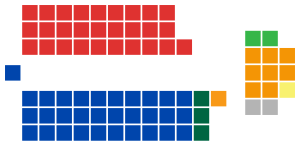
Coalition
Liberal (68)
National (13)
CLP (1)
Opposition (65)
Labor (65)
Crossbench (3)
Independent (3)
| Party | Votes | % | Swing | Seats | Change | |||
|---|---|---|---|---|---|---|---|---|
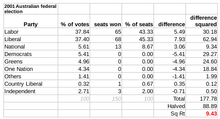
| Australian Labor Party | 4,341,420 | 37.84 | −2.26 | 65 | −2 | |||
| Coalition | ||||||||
| Liberal Party of Australia | 4,244,072 | 37.40 | +3.18 | 68 | +4 | |||
| National Party of Australia | 643,926 | 5.61 | +0.32 | 13 | −3 | |||
| Country Liberal Party | 36,961 | 0.32 | +0.0 | 1 | +1 | |||
| Australian Democrats | 620,197 | 5.41 | +0.28 | 0 | 0 | |||
| Australian Greens | 569,074 | 4.96 | +2.82 | 0 | 0 | |||
| One Nation Party | 498,032 | 4.34 | −4.09 | 0 | 0 | |||
| Christian Democratic Party | 69,294 | 0.60 | +0.02 | 0 | 0 | |||
| Unity Party | 24,653 | 0.21 | −0.58 | 0 | 0 | |||
| Citizens Electoral Council | 18,352 | 0.16 | +0.09 | 0 | 0 | |||
| liberals for forests | 16,042 | 0.14 | * | 0 | 0 | |||
| No GST Party | 14,164 | 0.12 | +0.10 | 0 | 0 | |||
| Australians Against Further Immigration | 12,033 | 0.10 | * | 0 | 0 | |||
| Save the ADI Site Party | 6,029 | 0.05 | * | 0 | 0 | |||
| Progressive Labour Party | 4,467 | 0.04 | −0.02 | 0 | 0 | |||
| Lower Excise Fuel and Beer Party | 4,292 | 0.04 | * | 0 | 0 | |||
| Help End Marijuana Prohibition | 3,277 | 0.03 | * | 0 | 0 | |||
| Curtin Labor Alliance | 2,496 | 0.02 | * | 0 | 0 | |||
| Non-Custodial Parents Party | 769 | 0.01 | * | 0 | 0 | |||
| The Fishing Party | 720 | 0.01 | * | 0 | 0 | |||
| Tasmania First Party | 621 | 0.01 | −0.03 | 0 | 0 | |||
| Outdoor Recreation Party | 485 | 0.00 | * | 0 | 0 | |||
| Independents | 311,121 | 2.71 | +0.95 | 3 | +2 | |||
| Not Affiliated | 20,997 | 0.18 | +0.05 | 0 | 0 | |||
| Total | 11,474,074 | 150 | ||||||
| Two-party-preferred vote | ||||||||
| Liberal/National Coalition | WIN | 50.95 | +1.93 | 82 | +2 | |||
| Australian Labor Party | 49.05 | −1.93 | 65 | -2 | ||||
Independents: Peter Andren, Tony Windsor, Bob Katter
Senate results
Coalition
Liberal (31)
National (3)
CLP (1)
Opposition (28)
Labor (28)
Crossbench (12)
Democrats (8)
Greens (2)
One Nation (1)
Independent (2)
| Party | Votes | % | Swing | Seats Won | Seats Held | |
|---|---|---|---|---|---|---|
| Australian Labor Party | 3,990,997 | 34.42 | -2.99 | 14 | 28 | |
| Liberal/National (Joint Ticket) | 2,776,052 | 23.88 | +2.00 | 6 | ||
| Liberal Party of Australia | 1,824,745 | 15.69 | +2.06 | 12 | 31 | |
| Australian Democrats | 843,130 | 7.25 | -1.20 | 4 | 8 | |
| One Nation | 644,364 | 5.54 | -3.44 | 0 | 1 | |
| Australian Greens | 574,543 | 4.94 | +2.22 | 2 | 2 | |
| National Party of Australia | 222,860 | 1.92 | +0.06 | 1 | 3 | |
| Christian Democratic Party | 129,966 | 1.12 | +0.03 | 0 | 0 | |
| liberals for forests | 87,672 | 0.75 | * | 0 | 0 | |
| Progressive Labour Party | 76,150 | 0.65 | * | 0 | 0 | |
| Democratic Labor Party | 66,547 | 0.57 | +0.30 | 0 | 0 | |
| Help End Marijuana Prohibition | 63,648 | 0.55 | * | 0 | 0 | |
| No GST Party | 50,053 | 0.43 | +0.29 | 0 | 0 | |
| Country Liberal Party | 40,680 | 0.35 | +0.03 | 1 | 1 | |
| Phil Cleary – Independent Australia | 36,122 | 0.31 | * | 0 | 0 | |
| Unity Party | 30,193 | 0.26 | -0.57 | 0 | 0 | |
| The Fishing Party | 27,591 | 0.24 | * | 0 | 0 | |
| Lower Excise Fuel and Beer Party | 23,767 | 0.20 | * | 0 | 0 | |
| Australians Against Further Immigration | 21,012 | 0.18 | +0.11 | 0 | 0 | |
| Republican Party of Australia | 9,939 | 0.09 | +0.08 | 0 | 0 | |
| Citizens Electoral Council | 8,896 | 0.08 | +0.00 | 0 | 0 | |
| Reform the Legal System | 8,199 | 0.07 | * | 0 | 0 | |
| Helen Caldicott – Our Common Future | 5,358 | 0.05 | * | 0 | 0 | |
| Nuclear Disarmament Party | 4,596 | 0.04 | -0.05 | 0 | 0 | |
| Non-Custodial Parents Party | 4,071 | 0.04 | * | 0 | 0 | |
| Tasmania First Party | 3,895 | 0.03 | -0.01 | 0 | 0 | |
| Curtin Labor Alliance | 3,494 | 0.03 | * | 0 | 0 | |
| Hope Party Australia | 2,947 | 0.03 | * | 0 | 0 | |
| Advance Australia Party | 1,936 | 0.02 | * | 0 | 0 | |
| Taxi Operators' Political Service | 670 | 0.01 | +0.01 | 0 | 0 | |
| Other | 43,712 | 0.38 | +0.08 | 0 | 0 | |
| Harradine Group | * | * | * | 0 | 1 | |
| Shayne Murphy | * | * | * | 0 | 1 | |
| Total | 11,627,529 | 40 | 76 | |||
House of Representatives preference flows
- The Nationals had candidates in 14 seats where three-cornered-contests existed, with 87.34% of preferences favouring the Liberal Party.
- The Democrats contested 145 electorates with preferences favouring Labor (64.13%).
- The Greens contested 145 electorates with preferences strongly favouring Labor (74.83%).
- One Nation contested 120 electorates with preferences slightly favouring the Liberal/National Coalition (55.87%).
Seats changing hands
The following table indicates seats that changed hands from one party to another at this election. It compares the election results with the previous margins, taking into account redistributions in New South Wales, Western Australia, South Australia, Tasmania and both territories. As a result, it includes the seats of Macarthur and Parramatta, which were held by Liberal members but had notional Labor margins. The table does not include the new seat of Hasluck (retained by Labor); the abolished Northern Territory, which was divided into Lingiari (retained by Labor) and Solomon (retained by the CLP); or Paterson, a Labor seat made Liberal by the redistribution
| Seat | Pre-2001 | Swing | Post-2001 | ||||||
|---|---|---|---|---|---|---|---|---|---|
| Party | Member | Margin[1] | Margin | Member | Party | ||||
| Ballarat, Vic | Liberal | Michael Ronaldson | 2.77 | 5.50 | 2.73 | Catherine King | Labor | ||
| Canning, WA | Labor | Jane Gerick | 0.04 | 0.42 | 0.38 | Don Randall | Liberal | ||
| Dickson, Qld | Labor | Cheryl Kernot | 0.12 | 6.09 | 5.97 | Peter Dutton | Liberal | ||
| Dobell, NSW | Labor | Hon Michael Lee | 1.53 | 1.91 | 0.38 | Ken Ticehurst | Liberal | ||
| Farrer, NSW | National | Tim Fischer | 14.18 | N/A | 16.37 | Sussan Ley | Liberal | ||
| Kennedy, Qld | National | Bob Katter | 11.19 | N/A | 19.69 | Bob Katter | Independent | ||
| Macarthur, NSW | Labor | notional | 1.69 | 8.65 | 6.96 | Pat Farmer | Liberal | ||
| New England, NSW | National | Stuart St. Clair | 13.66 | N/A | 8.30 | Tony Windsor | Independent | ||
| Parramatta, NSW | Labor | notional | 2.49 | 3.64 | 1.15 | Ross Cameron | Liberal | ||
| Ryan, Qld | Labor | Leonie Short* | 0.17 | 8.79 | 8.62 | Michael Johnson | Liberal | ||
- *Leonie Short was elected to Ryan in a by-election earlier in 2001.
Background
Throughout much of 2001, the Coalition had been trailing Labor in opinion polls, thanks to dissatisfaction with the government's economic reform programme and high petrol prices. The opposition Australian Labor Party had won a majority of the two-party-preferred vote at the previous election and had won a series of state and territory elections. Labor also recorded positive swings in two by-elections, taking the Queensland seat of Ryan and coming close in Aston.
The September 11 attacks and the Children Overboard and Tampa affairs were strong influences in the minds of voters at this election, focusing debate around the issues of border protection and national security. Polls swung strongly toward the coalition after the "Tampa" controversy but before the 11 September attacks. Another major issue was the collapse of the country's second biggest airline Ansett Australia and whether it should be given a bailout; the Coalition was opposed to the bailout because it was not the government's fault. However, Labor was for a bailout because the company's collapse was about to result in the biggest mass job loss in Australian history, whilst also arguing that the government was partially responsible for allowing Ansett to be taken over by Air New Zealand who had caused Ansett's failure.[2] Although the two-party preferred result was reasonably close, the ALP recorded its lowest primary vote since 1934.[3]
Political scientists have suggested that television coverage has subtly transformed the political system, with a spotlight on leaders rather than parties, thereby making for more of an American presidential-style system. In this election television news focused on international issues, especially terrorism and asylum seekers. Minor parties were largely ignored as the two main parties monopolized the camera's attention. The election was depicted as a horse race between Howard and Beazley; Howard ran ahead and was therefore given more coverage than his Labor rival.[4]
The election-eve Newspoll reported the Liberal/National Coalition on a 53 percent two-party-preferred vote.[5]
See also
References
- ↑ "Electoral Newsfile 97: Seat Status including notional seat status for SA, NSW, Tas, WA and NT Divisions". Australian Electoral Commission. 2001.
- ↑ "Tampa issue improves Coalition election prospects: ABC 7.30 report 4/9/2001". Abc.net.au. Retrieved 2010-06-13.
- ↑ "australianpolitics.com". australianpolitics.com. Retrieved 2010-06-13.
- ↑ David Denemark, Ian Ward, and Clive Bean, Election Campaigns and Television News Coverage: The Case of the 2001 Australian Election. Australian Journal of Political Science. (2007) 42#1 pp: 89-109 online
- ↑ "Newspoll archive since 1987". Polling.newspoll.com.au.tmp.anchor.net.au. Retrieved 2016-07-30.
External links
- Australian Electoral Commission Results
- University of WA election results in Australia since 1890
- AEC 2PP vote
- AustralianPolitics.com election details
- Preference flows – ABC
| Federal elections | |
|---|---|
| Referendums | |
| Surveys | |
| |