Gallagher index
The Gallagher index "measures an electoral system’s relative disproportionality between votes received and seats allotted in a legislature."[1][2] As such, it measures the difference between the percentage of votes each party gets and the percentage of seats each party gets in the resulting legislature, and it also measures this disproportionality from all parties collectively in any one given election. That collective disproportionality from the election is given a precise score, which can then be used in comparing various levels of proportionality among various elections from various electoral systems.[3]
Michael Gallagher, who created the index, referred to it as a "least squares index", inspired by the sum of squared residuals used in the method of least squares. The index is therefore commonly abbreviated as "LSq" even though the measured allocation is not necessarily a least squares fit. The Gallagher index is computed by taking the square root of half the sum of the squares of the difference between percent of votes ( ) and percent of seats ( ) for each of the political parties ( ).[4]


The index weighs the deviations by their own value, creating a responsive index, ranging from 0 to 100. The larger the differences between the percentage of the votes and the percentage of seats summed over all parties, the larger the Gallagher index. The larger the index value the larger the disproportionality and vice versa. Michael Gallagher included "other" parties as a whole category, and Arend Lijphart modified it, excluding those parties. Unlike the well-known Loosemore–Hanby index, the Gallagher index is less sensitive to small discrepancies.[6]
Attention gained in Canada
The Gallagher index gained considerable attention in Canada in December 2016 in the context of efforts to reform Canada's electoral system.[7][8] The Special Committee on Electoral Reform (a Parliamentary Committee) recommended "that the Government should, as it develops a new electoral system, use the Gallagher index in order to minimize the level of distortion between the popular will of the electorate and the resultant seat allocations in Parliament." The committee recommended that "the government should seek to design a system that achieves a Gallagher score of 5 or less."[9][10] In the 2015 Canadian federal election, the Gallagher index was 12.02, where 0 would be a perfectly proportional election outcome.[11]

Examples of calculating disproportionality
New Zealand
This table uses the New Zealand 2005 election result.[12] Note that since New Zealand uses the MMP voting system, voters have two votes. This list uses the party vote, which determines the proportionality of the House; the electorate vote determines the local member.
| party | % of votes | % of seats | difference | difference squared |
|---|---|---|---|---|
| Labour | 41.10 | 41.32 | 0.22 | 0.0484 |
| National | 39.10 | 39.67 | 0.57 | 0.3249 |
| NZ First | 5.72 | 5.79 | 0.07 | 0.0049 |
| Greens | 5.30 | 4.96 | 0.34 | 0.1156 |
| Māori | 2.12 | 3.30 | 1.18 | 1.3924 |
| United Future | 2.67 | 2.48 | 0.19 | 0.0361 |
| ACT | 1.51 | 1.65 | 0.14 | 0.0196 |
| Progressives | 1.16 | 0.82 | 0.34 | 0.1156 |
| Destiny | 0.62 | 0 | 0.62 | 0.3844 |
| Legalise Cannabis | 0.25 | 0 | 0.25 | 0.0625 |
| Christian Heritage | 0.12 | 0 | 0.12 | 0.0144 |
| Alliance | 0.07 | 0 | 0.07 | 0.0049 |
| Family Rights | 0.05 | 0 | 0.05 | 0.0025 |
| Democrats | 0.05 | 0 | 0.05 | 0.0025 |
| Libertarianz | 0.04 | 0 | 0.04 | 0.0016 |
| Direct Democracy | 0.03 | 0 | 0.04 | 0.0016 |
| 99MP | 0.03 | 0 | 0.03 | 0.0009 |
| OneNZ | 0.02 | 0 | 0.02 | 0.0004 |
| Republicans | 0.02 | 0 | 0.02 | 0.0004 |
| total of squares of differences | 2.5336 | |||
| total / 2 | 1.2668 | |||
| square root of (total / 2) | 1.13 | |||
Thus the disproportionality of the 2005 New Zealand election is 1.13, which is very low by international standards.[13]
Note that the Māori Party has the highest difference, which is significantly above the others. This is due to New Zealand's system of reserved seats for Māori. The Māori seats are allocated by votes on a separate electoral roll, and while any party can contest these seats, they have historically been won by either the Māori Party, the Labour Party, or New Zealand First.
Australia
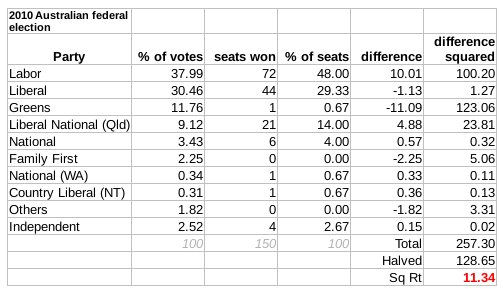
This table uses for example the 2012 Queensland state election, one of the largest landslides in Australian electoral history. Though Australia and New Zealand have somewhat similar political histories, Australia uses preferential voting in a single member system, which tends to result in far less proportionality compared to New Zealand's MMP system (or other proportional electoral systems), especially for larger minor parties, such as The Greens or, historically, the Australian Democrats. The 2012 Queensland election had an extremely high Gallagher Index, at 31.16, due to the massive landslide in seats for the victorious LNP; most recent Australian state and federal elections however score between 10 and 12.

For comparison, the 2010 Australian Federal Election was more typical of Australian state and federal politics:
Sweden
.png)
Other indices
The Sainte-Laguë method is considered by Gallagher to be "probably the soundest of all the measures."[14] This is closely related to the Pearson's chi-squared test which has better statistical underpinning.

Notes
- ↑ Special Committee on Electoral Reform (a Canadian Parliamentary Committee) (December 1, 2016). Report 3: Strengthening Democracy in Canada : Principles, Process and Public Engagement for Electoral Reform (Report). Parliament of Canada. p. 69 (or p. 83 in PDF search). Retrieved December 26, 2016.
One tool that has been developed to measure an electoral system's relative disproportionality between votes received and seats allotted in a legislature is the Gallagher Index, which was developed by Michael Gallagher (who appeared before the Committee).
- ↑ O'Malley, Kady (December 1, 2016). "Read the full electoral reform committee report, plus Liberal and NDP/Green opinions". Ottawa Citizen. Ottawa Citizen. Retrieved December 26, 2016.
- ↑ This is discussed in simple English at "Gallagher Index Made Easy".
- ↑ Gallagher, Michael (1991). "Proportionality, Disproportionality and Electoral Systems". Electoral Studies. 10: 33–51. doi:10.1016/0261-3794(91)90004-c.
- ↑ Gallagher 1991, p. 40.
- ↑ Gallagher 1991, p. 41.
- ↑ Cash, Colby (December 2, 2016). "Colby Cosh: Did Maryam Monsef actually read the whole electoral reform report?". National Post. Retrieved 10 December 2016.
- ↑ Wherry, Aaron (December 1, 2016). "Minister 'disappointed' as electoral reform committee recommends referendum on proportional representation". CBC News. Retrieved 10 December 2016.
- ↑ O'Malley, Kady (December 1, 2016). "Read the full electoral reform committee report, plus Liberal and NDP/Green opinions". Ottawa Citizen. Ottawa Citizen. Retrieved 10 December 2016.
- ↑ "Is Canada Fair?". Measuring Unfairness — Calculating Canada's Gallagher Index. (This website includes the Gallagher Index in adjustable table format. It initially shows the data for Canada's 2015 federal election, but some variables in some table cells are adjustable by the visitor to the website, and then the rest of the table is automatically adjusted to reflect this visitor's new input.). Retrieved 10 December 2016.
- ↑ The rules for federal elections in Canada require that certain provinces always get a certain quantity of seats – on a province by province basis. If so, then Byron Weber Becker proposed that the Gallagher index for Canada ought to ALSO reflect that. In other words, the Gallagher data should be collected on a province by province basis; and the Gallagher score should be calculated on a province by province basis. Only after that is done, can we then add up all of those provincial scores and then average them out to get the true national "composite Gallagher index" score. If we do that, then the illustrated table calculation of 12 for Canada is incorrect. It should instead show a "composite Gallagher index" of 17.1. Byron Weber Becker developed this "composite" index. See citation here: Special Committee on Electoral Reform (a Canadian Parliamentary Committee) (December 1, 2016). Report 3: Strengthening Democracy in Canada : Principles, Process and Public Engagement for Electoral Reform (Report). Parliament of Canada. p. 69 (or p. 83 in PDF search). Retrieved December 26, 2016.
...Professor Becker developed the “Gallagher Index Composite” for the Committee’s study...
- ↑ "Official Count Results -- Electorate Status". Chief Electoral Office- New Zealand. 1 October 2005. Retrieved 9 August 2013.
- ↑ Gallagher, Michael (2013). "Election indices" (PDF). Trinity College, Dublin. Retrieved 9 August 2013.
- ↑ Gallagher 1991, p. 47.
References
- Benoit, Kenneth (2000). "Which Electoral Formula Is the Most Proportional? A New Look with New Evidence". Political Analysis. 8: 381–388. doi:10.1093/oxfordjournals.pan.a029822. Retrieved 10 August 2013.
- Gallagher, Michael (1991). "Proportionality, Disproportionality and Electoral Systems". Electoral Studies. 10: 33–51. doi:10.1016/0261-3794(91)90004-c.
- Gallagher, Michael (1992). "Comparing Proportional Representation Electoral Systems: Quotas, Thresholds, Paradoxes and Majorities". British Journal of Political Science. 22: 469–496. doi:10.1017/s0007123400006499.
- Gallagher, Michael; Mitchell, P, eds. (2005). The Politics of Electoral Systems. Oxford: Oxford University Press. Appendix B. ISBN 0-19-925756-6.
- Kestelman, Philip (March 1999). "Quantifying Representativity". Voting matters. 10. Retrieved 10 August 2013.
External links
- Gallagher Index Made Easy
- The Gallagher Index: A Measure of Disproportionality
- Various Gallagher Indexes at Wikimedia Commons
- Website: Measuring Unfairness — Calculating Canada's Gallagher Index (This website includes the Gallagher Index in adjustable table format. It initially shows the data for Canada's 2015 federal election, but some variables in some table cells are adjustable by the visitor to the website, and then the rest of the table is automatically adjusted to reflect this visitor's new input.)