Australian federal election, 1996
|
| ||||||||||||||||||||||||||||||||||
| ||||||||||||||||||||||||||||||||||
All 148 seats in the House of Representatives 75 seats were needed for a majority in the House 40 (of the 76) seats in the Senate | ||||||||||||||||||||||||||||||||||
|---|---|---|---|---|---|---|---|---|---|---|---|---|---|---|---|---|---|---|---|---|---|---|---|---|---|---|---|---|---|---|---|---|---|---|
| ||||||||||||||||||||||||||||||||||
| ||||||||||||||||||||||||||||||||||
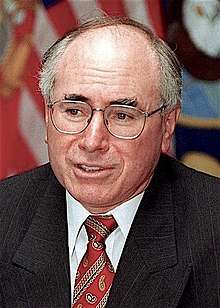
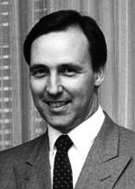
The 1996 Australian federal election was held to determine the members of the 38th Parliament of Australia. It was held on 2 March 1996. All 148 seats of the House of Representatives and 40 seats of the 76-seat Senate were up for election. The centre-right Liberal/National Coalition led by Opposition Leader John Howard of the Liberal Party and coalition partner Tim Fischer of the National Party defeated the incumbent centre-left Australian Labor Party government led by Prime Minister Paul Keating.
The election marked the end of the 13 year Hawke-Keating Government that began in 1983. John Howard was sworn in as the 25th Prime Minister of Australia on 11 March 1996, along with the First Howard Ministry.
This was the first federal election that future Prime Minister Tony Abbott contested as a member of parliament, having entered parliament at the 1994 Warringah by-election. Future opposition leader Brendan Nelson entered parliament at this election.
Background
John Howard, who had previously led the Liberal Party from 1985 to 1989, had returned to the leadership in January 1995 following a disastrous 8 months under the leadership of Alexander Downer. Downer and Peter Costello had succeeded Dr. John Hewson and Michael Wooldridge early in 1994 and were touted as the leaders of the new-generation Liberals. In the end, the party opted for the seasoned Howard, perhaps an acknowledgment that he was the only one left standing after a decade of party infighting.
Howard approached the campaign with a determination to present as small a target as possible. Throughout 1995, he refused to detail specific policy proposals, focusing the Coalition's attacks mainly on the longevity and governing record of the Labor government. By 1996, however, it was clear that the electorate had tired of Labor and Paul Keating in particular. "The recession we had to have" line resonated with deadly force throughout the electorate. Although Keating's big picture approach to republicanism, reconciliation and engagement with Asia galvanised support within Labor's urban constituencies, Howard was able to attract support amongst disaffected mainstream Australians – including traditionally Labor-voting blue-collar workers and middle-class suburban residents. He also promised to retain Medicare and hold a constitutional convention to decide whether Australia would become a republic.
The election-eve Newspoll reported the Liberal/National Coalition held an estimated 53.5 percent two-party-preferred vote.[1]
Result
House of Representatives results

Coalition
Liberal (75)
National (18)
CLP (1)
Opposition (49)
Labor (49)
Crossbench (5)
Independent (5)
| Party | Votes | % | Swing | Seats | Change | |||
|---|---|---|---|---|---|---|---|---|
| Liberal–National coalition | 5,142,161 | 47.25 | +2.98 | 94 | +29 | |||
| Liberal | 4,210,689 | 38.69 | +1.92 | 75 | +26 | |||
| National | 893,170 | 8.21 | +1.04 | 18 | +2 | |||
| Country Liberal | 38,302 | 0.35 | +0.02 | 1 | +1 | |||
| Labor | 4,217,765 | 38.75 | −6.17 | 49 | −31 | |||
| Democrats | 735,848 | 6.76 | +3.01 | 0 | 0 | |||
| Greens* | 317,654 | 2.92 | +1.09 | 0 | 0 | |||
| Against Further Immigration | 73,023 | 0.67 | +0.64 | 0 | 0 | |||
| Call to Australia | 43,183 | 0.40 | −0.08 | 0 | 0 | |||
| Natural Law | 41,573 | 0.38 | −0.36 | 0 | 0 | |||
| No Aircraft Noise | 18,626 | 0.17 | +0.17 | 0 | 0 | |||
| Indigenous Peoples | 12,507 | 0.11 | +0.08 | 0 | 0 | |||
| Reclaim Australia | 6,457 | 0.06 | +0.06 | 0 | 0 | |||
| Women's | 6,173 | 0.06 | +0.06 | 0 | 0 | |||
| One Australia | 3,159 | 0.03 | +0.03 | 0 | 0 | |||
| Grey Power | 2,815 | 0.03 | +0.01 | 0 | 0 | |||
| Pensioner & CIR Alliance | 332 | 0.00 | +0.00 | 0 | 0 | |||
| Republican | 156 | 0.00 | +0.00 | 0 | 0 | |||
| Independents | 262,420 | 2.41 | −0.73 | 5 | +3 | |||
| Total | 10,883,852 | 148 | +1 | |||||
| Two-party-preferred vote | ||||||||
| Liberal–National coalition | WIN | 53.63 | +5.07 | 94 | +29 | |||
| Labor | 46.37 | −5.07 | 49 | −31 | ||||
- Note: the federal Australian Greens were founded in 1992, but not all local organisations immediately affiliated. The Greens total includes Australian Greens (188,994), Greens Western Australia (53,101), Victorian Greens (52,810), Tasmanian Greens (19,689), Central Coast Green Party (1,887), and Richmond/Clarence Greens (1,173).
- Independents: Peter Andren, Pauline Hanson, Allan Rocher, Graeme Campbell, Paul Filing
Senate results

Coalition
Liberal (31)
National (5)
CLP (1)
Opposition (29)
Labor (29)
Crossbench (10)
Democrats (7)
Greens (2)
Independent (1)
| Party | Votes | % | Swing | Seats Won | Seats Held | |
|---|---|---|---|---|---|---|
| Australian Labor Party | 3,940,150 | 36.15 | −7.35 | 14 | 29 | |
| Liberal/National (Joint Ticket) | 2,669,377 | 24.49 | +0.09 | 6 | ||
| Liberal Party of Australia | 1,770,486 | 16.24 | +0.65 | 12 | 31 | |
| Australian Democrats | 1,179,357 | 10.82 | +5.51 | 5 | 7 | |
| National Party of Australia | 312,769 | 2.87 | +0.15 | 1 | 5 | |
| Australian Greens (NSW, Qld, SA, ACT, NT) | 180,404 | 1.66 | −0.28 | 0 | 0 | |
| Australians Against Further Immigration | 137,604 | 1.26 | +0.82 | 0 | 0 | |
| Call to Australia | 117,274 | 1.08 | +0.25 | 0 | 0 | |
| Australian Shooters Party | 114,724 | 1.05 | +0.45 | 0 | 0 | |
| Australian Greens Victoria | 81,273 | 0.74 | +0.44 | 0 | 0 | |
| WA Greens | 57,006 | 0.52 | +0.02 | 0 | 1 | |
| Australian Women's Party | 49,131 | 0.45 | * | 0 | 0 | |
| Reclaim Australia: Reduce Immigration | 44,545 | 0.41 | * | 0 | 0 | |
| Country Liberal Party | 40,050 | 0.37 | +0.04 | 1 | 1 | |
| Democratic Labor Party | 36,156 | 0.33 | −0.03 | 0 | 0 | |
| Tasmanian Greens | 26,830 | 0.25 | * | 1 | 1 | |
| A Better Future for Our Children | 18,960 | 0.17 | * | 0 | 0 | |
| Natural Law Party | 17,082 | 0.16 | −0.20 | 0 | 0 | |
| No Aircraft Noise | 17,043 | 0.16 | −0.20 | 0 | 0 | |
| Grey Power | 13,401 | 0.12 | −0.04 | 0 | 0 | |
| Pensioner & CIR Alliance | 9,040 | 0.08 | −0.13 | 0 | 0 | |
| The Seniors | 8,268 | 0.08 | * | 0 | 0 | |
| Republican Party of Australia | 7,778 | 0.07 | −0.06 | 0 | 0 | |
| One Australia Party | 3,638 | 0.03 | * | 0 | 0 | |
| Australia's Indigenous Peoples Party | 2,772 | 0.03 | −0.03 | 0 | 0 | |
| Independent EFF | 2,430 | 0.02 | * | 0 | 0 | |
| Harradine Group | * | * | −0.30 | 0 | 1 | |
| Other | 41,489 | 0.38 | −0.23 | 0 | 0 | |
| Total | 10,899,037 | 40 | 76 | |||
Independents: Mal Colston (resigned from ALP in August 1996)
Analysis
Overall the coalition won 29 seats from Labor while the ALP won 4 seats from the Liberals. These 4 seats were Canberra and Namadgi in the ACT and Isaacs in Victoria and the Division of Bruce in Victoria. The ACT seats fell to Labor due to a strong return to the ALP in a traditional Labor town by public servants fearing conservative cuts. The division of Brendan Smyth's seat of Canberra into the two new (of the three) ACT seats limited his campaign to the southernmost Tuggeranong seat of Namadgi where the ACT Labor right wing stood former MLA Annette Ellis who ran a tight grassroots campaign. Isaacs fell to Labor due to demographic changes due to a redistribution of electoral boundaries.

Labor lost five percent of its two-party vote from 1993, and tallied its lowest primary vote since 1934 (an additional eight percent coming from preferences). The swing against Labor was not in and of itself enough to cause a change of government. However, Labor lost 13 of its 33 seats in New South Wales, and all but two of its 13 seats in Queensland. The 29-seat swing was the second-largest defeat, in terms of seats lost, by a sitting government in Australia. Three members of Keating's government—including Attorney-General Michael Lavarch —lost their seats. Keating resigned as Labor leader on the night of the election, and was succeeded by former Deputy Prime Minister and Finance Minister Kim Beazley.
Due in part to this large swing, Howard entered office with a 45-seat majority, the second-largest in Australian history (behind only the 55-seat majority won by Malcolm Fraser in 1975). The Liberals actually won a majority in their own right at this election with 75 seats, the most the party had ever won. Although Howard had no need for the support of the Nationals, the Coalition was retained.
Exit polling showed the Coalition winning 47 percent of the blue-collar vote, compared with Labor's 39 percent; there was a 16-point drop in Labor's vote among members of trade unions. The Coalition won 48 percent of the Catholic vote and Labor 37 percent, a reversal of the usual figures.[2]
House of Reps preference flows
- The Democrats contested 138 electorates with preferences slightly favouring Labor (54.02%)
- The Greens contested 102 electorates with preferences favouring Labor (67.10%)
Seats changing hands
- *Figure is Liberal against Nationals.
- **Figure is a swing compared to Liberal vote at the last election.
See also
References
- ↑ "Newspoll archive since 1987". Polling.newspoll.com.au.tmp.anchor.net.au. Retrieved 2016-07-30.
- ↑ John Stone (15 March 1996). "Remember, it was Paul Keating". The Australian Financial Review.
- ↑ Kelly conceded that she was incapable of being chosen as a member of the House of Representatives while serving as an officer of the RAAF and won the subsequent by-election with an increased margin: Holland, I (2004). "Section 44 of the Constitution". Parliamentary Library of Australia.
External links
- Australian Electoral Commission Results
- University of WA election results in Australia since 1890
- AEC 2PP vote
- AustralianPolitics.com election details
- Preference flows – ABC
| Federal elections | |
|---|---|
| Referendums | |
| Surveys | |
| |