Australian federal election, 1977
|
| ||||||||||||||||||||||||||||||||||
| ||||||||||||||||||||||||||||||||||
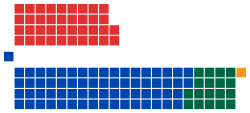
All 124 seats of the House of Representatives 63 seats were needed for a majority in the House 34 (of the 64) seats of the Senate | ||||||||||||||||||||||||||||||||||
|---|---|---|---|---|---|---|---|---|---|---|---|---|---|---|---|---|---|---|---|---|---|---|---|---|---|---|---|---|---|---|---|---|---|---|
| ||||||||||||||||||||||||||||||||||
| ||||||||||||||||||||||||||||||||||
Federal elections were held in Australia on 10 December 1977. All 124 seats in the House of Representatives and 34 of the 64 seats in the Senate were up for election.
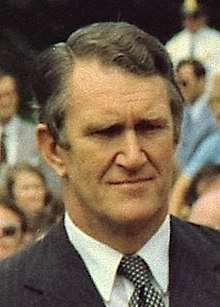
The incumbent Liberal-National Country Coalition led by Malcolm Fraser, in government since 1975, was elected to a second term over the opposition Labor Party led by Gough Whitlam. While the Coalition suffered a five-seat swing, it still had a substantial 35-seat majority in the House. The Liberals retained an outright majority, with 67 seats. Although Fraser thus had no need for the support of the National Country Party, the Coalition was retained.
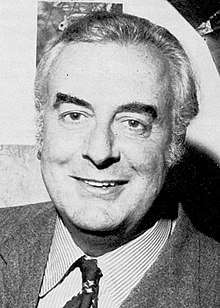
Whitlam became the first and only person to contest four federal elections as Leader of the Opposition. He was unable to recover much of the ground Labor had lost in its severe defeat two years prior, and resigned as leader shortly after the election.
Background and issues
The government offering tax cuts to voters and ran advertisements with the slogan "fistful of dollars". The tax cuts were never delivered; instead a "temporary surcharge" was imposed in 1978. The election coincided with the retirement of the Governor-General, Sir John Kerr. Kerr had appeared drunk at the Melbourne Cup in November and the public outcry resulted in the cancellation of his appointment as Ambassador to UNESCO.
The 1977 election was held a year earlier than required, partly to bring elections for the House and Senate back into line. A half-Senate election had to be held by the middle of 1978, since the double dissolution election of 1975 had resulted in the terms of senators being backdated to July 1975.
Results
House of Representatives results
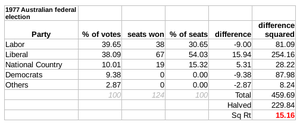
| Party | Votes | % | Swing | Seats | Change | ||
|---|---|---|---|---|---|---|---|
| Liberal–NCP coalition | 3,811,340 | 48.11 | –4.95 | 86 | –5 | ||
| Liberal | 3,017,896 | 38.09 | −3.71 | 67 | −1 | ||
| National Country | 776,982 | 9.81 | −1.44 | 18 | −4 | ||
| Country Liberal | 16,462 | 0.21 | +0.00 | 1 | 0 | ||
| Labor | 3,141,051 | 39.65 | −3.20 | 38 | +2 | ||
| Democrats | 743,365 | 9.38 | +9.38 | 0 | 0 | ||
| Democratic Labor | 113,271 | 1.43 | +0.11 | 0 | 0 | ||
| Progress | 47,567 | 0.60 | –0.18 | 0 | 0 | ||
| Communist | 14,098 | 0.18 | +0.06 | 0 | 0 | ||
| Socialist | 1,895 | 0.02 | +0.02 | 0 | 0 | ||
| Independents | 50,267 | 0.63 | –0.19 | 0 | 0 | ||
| Total | 7,922,854 | 124 | −3 | ||||
| Two-party-preferred (estimated) | |||||||
| Liberal–NCP coalition | WIN | 54.60 | −1.10 | 86 | –5 | ||
| Labor | 45.40 | +1.10 | 38 | +2 | |||
Senate results

Coalition
Liberal (27)
National (6)
CLP (1)
Opposition (27)
Labor (27)
Crossbench (3)
Democrats (2)
Independent (1)
| Party | Votes | % | Swing | Seats Won | Seats Held | Change | ||
|---|---|---|---|---|---|---|---|---|
| Liberal–NCP coalition (total) | 3,369,843 | 45.56 | –5.18 | 18 | 34 | –1 | ||
| Liberal–NCP joint ticket | 2,533,882 | 34.26 | −5.60 | 7 | * | * | ||
| Liberal | 783,878 | 10.60 | −0.48 | 10 | 27 | +1 | ||
| National Country | 36,619 | 0.50 | −0.04 | 0 | 6 | –2 | ||
| Country Liberal | 15,463 | 0.21 | −0.01 | 1 | 1 | 0 | ||
| Labor | 2,718,876 | 36.76 | −4.15 | 14 | 27 | 0 | ||
| Democrats | 823,550 | 11.13 | +11.13 | 2 | 2 | +2 | ||
| Democratic Labor | 123,192 | 1.67 | –1.00 | 0 | 0 | 0 | ||
| Progress | 88,203 | 1.19 | +0.32 | 0 | 0 | 0 | ||
| Call to Australia | 49,395 | 1.12 | +1.12 | 0 | 0 | 0 | ||
| Marijuana | 44,276 | 0.60 | +0.60 | 0 | 0 | 0 | ||
| Socialist | 42,740 | 0.58 | +0.57 | 0 | 0 | 0 | ||
| Australia | 8,283 | 0.11 | –0.37 | 0 | 0 | 0 | ||
| Independents | 127,850 | 1.73 | +0.13 | 0 | 1 | 0 | ||
| Total | 7,396,207 | 34 | 64 | |||||
- Independent: Brian Harradine (Tasmania)
- The Progress Party was the renamed "Workers Party" from the 1975 election.
Seats changing hands
| Seat | Pre-1977 | Swing | Post-1977 | ||||||
|---|---|---|---|---|---|---|---|---|---|
| Party | Member | Margin | Margin | Member | Party | ||||
| Capricornia, Qld | National Country | Colin Carige | 0.1 | 2.7 | 1.2 | Doug Everingham | Labor | ||
| Griffith, Qld | Liberal | Don Cameron | 8.0 | 5.0 | 3.5 | Ben Humphreys | Labor | ||
| Indi, Vic | National Country | Mac Holten | N/A | 22.3 | 5.1 | Ewen Cameron | Liberal | ||
- Members in italics did not contest their seat at this election.
Significance
Liberal Don Chipp had been dropped from the ministry after the 1975 election. He had formed a new political party, the Australian Democrats, and had announced his intention to run for the Senate. Liberal Movement senator Steele Hall resigned and was replaced by Janine Haines, but she lost her seat; however, the party gained Chipp in Victoria and Colin Mason in New South Wales, with Haines being re-elected at the next election as the new party's popularity grew.
The ALP made limited gains in the election. The second Fraser Government had the second-largest parliamentary majority in Australian history after the majority it won in the 1975 election. Gough Whitlam resigned as the leader of the ALP in 1978, and was replaced by Bill Hayden.
This was the last Australian federal election for the House of Representatives at which no women were elected, although there were a number of women candidates. Women have been elected at every federal election from 1980 onwards.
See also
References
- AustralianPolitics.com election details
- University of WA election results in Australia since 1890
- AEC 2PP vote
| Federal elections | |
|---|---|
| Referendums | |
| Surveys | |
| |