Australian federal election, 1955
|
| |||||||||||||||||||||||||||||||
| |||||||||||||||||||||||||||||||
All 122 seats of the House of Representatives 62 seats were needed for a majority in the House 30 (of the 60) seats of the Senate | |||||||||||||||||||||||||||||||
|---|---|---|---|---|---|---|---|---|---|---|---|---|---|---|---|---|---|---|---|---|---|---|---|---|---|---|---|---|---|---|---|
| |||||||||||||||||||||||||||||||
| |||||||||||||||||||||||||||||||

Federal elections were held in Australia on 10 December 1955. All 122 seats in the House of Representatives and 30 of the 60 seats in the Senate were up for election. An early election was called to bring the House and Senate elections back in line; the previous election in 1954 had been House-only. The incumbent Liberal–Country coalition led by Prime Minister Robert Menzies increased its majority over the opposition Labor Party, led by H. V. Evatt.
Future Prime Minister Malcolm Fraser and future opposition leader Billy Snedden both entered parliament at this election.
Results
House of Representatives
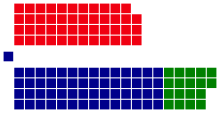
Labor: 47 seats
Liberal: 56 seats
Country: 18 seats
| Party | Votes | % | Swing | Seats | Change | ||
|---|---|---|---|---|---|---|---|
| Liberal–Country coalition | 2,093,430 | 47.67 | +0.10 | 75 | +11 | ||
| Liberal | 1,745,985 | 39.75 | +0.75 | 57 | +10 | ||
| Country | 347,445 | 7.91 | –0.66 | 18 | +1 | ||
| Labor | 1,961,359 | 44.65 | –5.42 | 47 | –10 | ||
| Anti-Communist Labor | 227,083 | 5.17 | +5.17 | 0 | 0 | ||
| Communist | 51,001 | 1.16 | –0.09 | 0 | 0 | ||
| Independents | 60,042 | 1.37 | +0.26 | 0 | 0 | ||
| Total | 4,392,915 | 122 | +1 | ||||
| Two-party-preferred (estimated) | |||||||
| Liberal–Country coalition | WIN | 54.20 | +4.90 | 75 | +11 | ||
| Labor | 45.80 | −4.90 | 47 | −10 | |||
- Ten members were elected unopposed – five Liberal and five Country. This would be the last federal election where any seat attracted only one candidate.
Senate
| Party | Votes | % | Swing | Seats Won | Seats Held | Change | ||
|---|---|---|---|---|---|---|---|---|
| Liberal–Country coalition | 2,161,460 | 48.68 | +4.25 | 17 | 30 | –1 | ||
| Liberal–Country joint ticket | 1,748,878 | 39.38 | +12.93 | 8 | N/A | N/A | ||
| Liberal | 384,732 | 8.66 | –9.32 | 8 | 24 | –2 | ||
| Country | 27,850 | 0.63 | +0.63 | 1 | 6 | +1 | ||
| Labor | 1,803,335 | 40.61 | –10.00 | 12 | 28 | –1 | ||
| Anti-Communist Labor | 271,067 | 6.10 | +6.10 | 1 | 2 | +2 | ||
| Communist | 161,869 | 3.64 | +0.59 | 0 | 0 | 0 | ||
| Henry George Justice | 3,366 | 0.08 | –0.22 | 0 | 0 | 0 | ||
| Independents | 39,928 | 0.90 | +0.36 | 0 | 0 | 0 | ||
| Total | 4,441,025 | 30 | 60 | |||||
Seats changing hands
| Seat | Pre-1955 | Swing | Post-1955 | ||||||
|---|---|---|---|---|---|---|---|---|---|
| Party | Member | Margin | Margin | Member | Party | ||||
| Ballaarat, Vic | Labor | Bob Joshua* | 2.6 | 10.7 | 7.9 | Dudley Erwin | Liberal | ||
| Hume, NSW | Labor | Arthur Fuller | 2,2 | 3.5 | 2.2 | Charles Anderson | Country | ||
| Maribyrnong, Vic | Labor | Arthur Drakeford | 16.1 | 7.5 | 0.1 | Philip Stokes | Liberal | ||
| Perth, WA | Labor | Tom Burke | 2.3 | 3.8 | 1.5 | Fred Chaney | Liberal | ||
| Philip, NSW | Labor | Joe Fitzgerald | 8.9 | 5.7 | 1.1 | William Aston | Liberal | ||
| St George, NSW | Labor | Nelson Lemmon | 2.7 | 5.8 | 3.4 | Bill Graham | Liberal | ||
- Bob Joshua contested his seat as a candidate for the Australian Labor Party (Anti-Communist).
See also
Notes
References
- University of WA election results in Australia since 1890
- AEC 2PP vote
- Prior to 1984 the AEC did not undertake a full distribution of preferences for statistical purposes. The stored ballot papers for the 1983 election were put through this process prior to their destruction. Therefore, the figures from 1983 onwards show the actual result based on full distribution of preferences.
| Federal elections | |
|---|---|
| Referendums | |
| Surveys | |
| |
This article is issued from
Wikipedia.
The text is licensed under Creative Commons - Attribution - Sharealike.
Additional terms may apply for the media files.