Transportation in Los Angeles
Los Angeles has a complex multimodal transportation infrastructure, which serves as a regional, national and international hub for passenger and freight traffic. The system includes the United States' largest port complex; an extensive freight and passenger rail infrastructure, including light rail lines and subway lines; numerous airports and bus lines; Transportation Network Companies; and an extensive freeway and road system. People in Los Angeles rely on cars as the dominant mode of transportation,[1] but since 1990 Los Angeles Metro Rail has built over one hundred miles (160 km) of light and heavy rail serving more and more parts of Los Angeles.
Intercity
Air transportation
In the Los Angeles metropolitan area, there are five commercial airports and many more general-aviation airports.
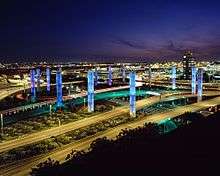
The primary Los Angeles airport is Los Angeles International Airport (LAX). The seventh busiest commercial airport in the world and the third busiest in the United States, LAX handled 61.9 million passengers, 1.884 million metric tons (2.077 million short tons; 1.854 million long tons) of cargo and 680,954 aircraft movements in 2007.[2]
Other major nearby commercial airports include: LA/Ontario International Airport (serves the Inland Empire); Bob Hope Airport (formerly known as Burbank Airport; serves the San Fernando and San Gabriel Valleys); Long Beach Airport (serves the Long Beach/Harbor area); and John Wayne Airport (serves the Orange County area).
The world's busiest general-aviation airport is also located in Los Angeles, Van Nuys Airport. Santa Monica Airport is also located near Los Angeles.
Intercity train services
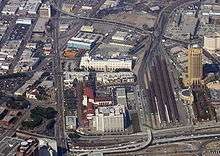
Union Station is the major regional train station for Amtrak, Metrolink and Metro Rail. The station is Amtrak's fifth busiest station, having 1,464,289 Amtrak boardings and de-boardings in 2006.[3] Amtrak operates eleven daily round trips between San Diego and Los Angeles, five of which continue to Santa Barbara via the Pacific Surfliner, the only service that runs through Los Angeles multiple times daily. Two of those trips continue to San Luis Obispo, California. The Coast Starlight provides additional service on the route and beyond to the San Francisco Bay Area, Sacramento, and on to Seattle, Washington. Amtrak motor coaches connect from Los Angeles to the San Joaquin Route in Bakersfield with frequent service through the Central Valley of California to Sacramento and Oakland, and eastward to San Bernardino and Las Vegas.
There is also daily service to Chicago, Illinois on the Southwest Chief, and three times a week to New Orleans, Louisiana on the Sunset Limited. Due to the effects from Hurricane Katrina, Sunset Limited service between New Orleans to Jacksonville, Florida has been discontinued, although Amtrak is required by current Federal Law to develop a plan to reinstate the service. The Texas Eagle is a second train to Chicago, which operates thrice weekly. Sunset Limited and Texas Eagle trains operate on the same track between Los Angeles and San Antonio, Texas before splitting off towards their respective destinations.
Amtrak Pacific Surfliner trains stop at several locations in Los Angeles County, including: Glendale, Bob Hope Airport in Burbank, Chatsworth, and Van Nuys.
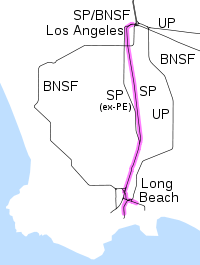
Due to the large volumes of import freight that flows into the city's port complex, Los Angeles is a major freight railroad hub. Freight is hauled by Union Pacific Railroad and BNSF Railway. The now-defunct Southern Pacific Railroad once served the Los Angeles area before merging with Union Pacific. The Alameda Corridor, a below-grade rail corridor connects the port to the city's main rail yards and to points further north and east.
Intercity highways
The major highway routes providing intercity connections are Interstate 5 (which goes north to Sacramento and south to San Diego), U.S. Route 101 (which goes north to Santa Barbara and San Francisco), and Interstate 10 (which goes west to Santa Monica and east to Phoenix, Arizona).
Intercity Bus Services
Greyhound, Megabus and various smaller bus lines provide intercity bus services. Megabus departs from Union Station and directly connects Los Angeles to San Francisco Bay Area and Las Vegas.[4] Greyhound connects directly to Bakersfield and from there into the California Central Valley, San Diego, Las Vegas, and the San Francisco Bay area. It departs from Los Angeles at its main station located in southeast downtown Los Angeles[5][6] and from a secondary terminal located in the North Hollywood neighborhood of Los Angeles.[7][8]
Harbors
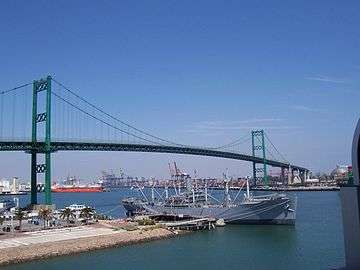
The Port of Los Angeles is located in San Pedro Bay in the San Pedro neighborhood, approximately 20 miles (30 km) south of Downtown. Also called Los Angeles Harbor and WORLDPORT L.A., the port complex occupies 7,500 acres (30 km2) of land and water along 43 miles (69 km) of waterfront. It adjoins the separate Port of Long Beach.
The sea ports of the Port of Los Angeles and Port of Long Beach together make up the Los Angeles–Long Beach Harbor. There are also smaller, non-industrial harbors along L.A.'s coastline. Most of these like Redondo Beach and Marina del Rey are used primarily by sailboats and yachts.
The Port of Los Angeles and Port of Long Beach comprise the largest seaport complex in the United States and the fifth busiest in the world. Over 11 percent of United States international trade (by value) passes through the Los Angeles region, and the Los Angeles customs district collects over 37 percent of the nation’s import duties.[9]
The port includes four bridges: the Vincent Thomas Bridge, Henry Ford Bridge, Gerald Desmond Bridge, and Commodore Schuyler F. Heim Bridge.
Ferry services
There are ferries serving the offshore island community of Avalon, California; they are mainly used for day excursions and to move supplies to Catalina Island. There is no regular vehicle ferry service to Avalon, since the city restricts the use of cars and trucks within its borders.[10]
Intracity


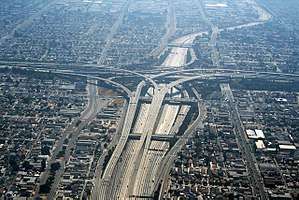
Freeways
There are a dozen major freeways that crisscross the region. California's first freeway was the Arroyo Seco Parkway segment of California State Route 110, also known as the Pasadena Freeway. It opened on January 1, 1940 and links downtown Los Angeles to downtown Pasadena. From Chavez Ravine north to Pasadena it can be quite dangerous because there is no shoulder, the lanes are narrow, the turns are sharp (not always properly banked), and the ramps are quite short and offer little room for acceleration to freeway speed; all of this is because the freeway was designed for much slower cars and much less traffic volume than exists today. Commercial vehicles over 6,000 pounds (2.7 t; 2.7 long tons) are prohibited from using this freeway. Newer freeways are straighter, wider, and allow for higher speeds.
Major freeways in Los Angeles include:

.svg.png)
.svg.png)
.svg.png)


.svg.png)


.svg.png)
.svg.png)


.svg.png)
.svg.png)
Major highways in Los Angeles include:


Angelenos are noted for referring to freeways with the definite article ("The 101"), in contrast to most other areas of the United States, who omit the article. Referring to freeways by name, for example "The San Diego Freeway", is essentially a holdover from the time when the freeways were built, and is diminishing. Nevertheless, freeways continue to be officially named; for example, State Route 118 was christened the Ronald Reagan Freeway.
Rush hour
Rush hour occurs on weekdays between 5 am and 10 am, and in the afternoon between 3 pm and 7 pm (although rush-hour traffic can occasionally spill out to 11 am and start again from 2 pm until as late as 10 pm, especially on Fridays). Traffic can occur at almost any time, particularly before major holidays (including Thanksgiving, Christmas, and three-day weekends) and even on regular weekends when one otherwise would not expect it. Experienced Angelenos recognize the need to factor traffic into their commute.
Despite the congestion in the city, the mean travel time for commuters in Los Angeles is shorter than other major cities, including New York City, Philadelphia and Chicago. Los Angeles' mean travel time for work commutes in 2006 was 29.2 minutes, similar to those of San Francisco and Washington, DC.[11]
Los Angeles has synchronized its traffic lights.[12][13][14]
Streets, street layout, the boulevards, and street problems
The city has an extensive street grid. Arterial streets (referred to as surface streets by locals, in contrast with freeways which are usually grade-separated roadways) connect freeways with smaller neighborhood streets, and are often used to bypass congested freeway routes. Consequently, most of the surface arterial streets in Los Angeles have various forms of congestion control.
Some of the more common means of maintaining surface street traffic flow is the use of loop-sensors embedded in the pavement allowing for intersection traffic signal timing adjustments to favor the more heavily delayed roadways; the use of a traffic control system allows for the synchronization of traffic signals to improve traffic flow (as of October 2009 this system is currently installed at 85% of the city's signalized intersections, more than any other US city); restrictions on vehicle turns on roadways without designated turning lanes during rush-hours; and the extensive use of rush-hour parking restrictions, allowing for an extra lane of travel in each direction during peak hours (weekdays excluding holidays generally from 7-9am thru 4-7pm, although hours vary by location) by eliminating on street parking and standing of vehicles, with violators being ticketed, and in the case of priority routes known as "anti-gridlock zones", immediately towed by specialized enforcement teams dubbed "tiger teams" at steep cost to the violator.
1st Street divides the block numbering grid north and south, and southwest of the Los Angeles River, Main Street divides the city east and west. Northeast of the river, block designations are divided east and west by Pasadena Avenue and North Figueroa Street.
From downtown Los Angeles to Long Beach, in a straight-down vertical pattern, east–west streets are numbered (starting with 1st Street in downtown, to 266th Street in Harbor City), and north–south streets are named. (1st Street is one block south of Temple.) There are many exceptions to the numbered streets, but the above pattern is generally used. This same numbered pattern is not mirrored north of Temple. Addresses are then numbered east or west stemming from Main Street (a major north south artery). Therefore, the landmark Watts Towers at 1765 E. 107th Street is approximately 107 streets south of 1st Street, and on the 17th street east of Main Street. Although the numbered streets are sequential, they do not necessarily equal the number of blocks south of 1st Street, as there are streets such as 118th Street and then 118th Place.
Many of the numbered streets also continue into neighboring cities, but some cities, such as Manhattan Beach, have made their own numbered street grid. Also, some districts of Los Angeles, such as Wilmington, San Pedro, Venice, and Playa Del Rey have their own numbered street grids.
Many arterials have been labeled as boulevards, and many of those mentioned below have been immortalized in movies, music, and literature.
Major east–west routes include: Roscoe, Victory, Ventura, Hollywood, Sunset, Santa Monica, Beverly, Wilshire, Olympic, Pico, Venice, Washington, Adams, Jefferson, Exposition, Obama Boulevard, and Martin Luther King Jr, and Century Boulevard. The major north–south routes include: Topanga Canyon, Crenshaw, Reseda, Lincoln, Sepulveda, Van Nuys, Westwood, Beverly Glen, San Vicente, Robertson, La Cienega, Laurel Canyon, Glendale, Avalon Boulevard, and Main Street.
There are many other famous L.A. streets which carry significant traffic but are not labeled as boulevards. Examples include: Broadway, Bundy Drive, Barrington Avenue, Centinela Avenue, Fountain Avenue, Mulholland Drive, Slauson Avenue, Pacific Coast Highway, Century Park East, Avenue of the Stars, Century Park West, Normandie Avenue, Highland Avenue, Melrose Avenue, Florence Avenue, Manchester Avenue, Vermont Avenue, La Brea Avenue, Fairfax Avenue, Western Avenue, Van Ness Avenue, Figueroa Street, Grand Avenue, Huntington Drive, Central Avenue, Alameda Street, and Imperial Highway. West Los Angeles has many streets named after states that run east and west. Somewhat confusingly, adjacent Santa Monica uses a few of the same state names for different streets of its own.
Potholes are a notorious problem in Los Angeles and frequently cause severe damage to all kinds of vehicles. In 2008, then-mayor Antonio Villaraigosa made "Operation Pothole" one of his top priorities for that year and pledged to fill 1 million potholes.[15] However, due to the city's poorly managed budget, the city's Bureau of Street Services has only a single dedicated pothole-repair truck to cover 275 miles (440 km) of streets (meaning that the backlog is still bad and getting worse).[16] Many city streets, such as Wilshire Boulevard, were engineered when cars, trucks, and buses were much smaller, and desperately need to be torn up and rebuilt from scratch to handle the weight of today's larger vehicles.[16]
Furthermore, due to its severe budget problems, Los Angeles is one of the few California cities that does not use raised pavement markers on its streets. Thus, Los Angeles drivers must be vigilant not only for potholes, but for other drivers drifting out of lanes due to the lack of tactile feedback normally provided by such markers.
On foot
Despite the assertion of a popular song that "nobody walks in L.A.",[17] 3.5% of Los Angeles residents commuted to work by walking in 2016[18] and Los Angeles residents walk for exercise at rates similar to those of other major U.S. cities.[19]
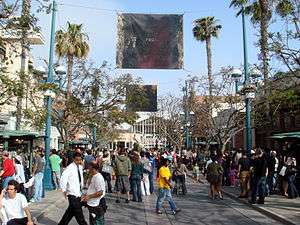
There are a number of commercial areas in nearby cities that have been redeveloped in the past two decades specifically to accommodate pedestrian traffic. Old Town Pasadena was redeveloped in the late 1980s by moving parking off Colorado Boulevard so as to make the street pedestrian-focused. Likewise, the Third Street Promenade in Santa Monica was closed off to vehicular traffic altogether in 1965 and revitalized with improved pedestrian amenities in 1988.[20]
Downtown Los Angeles has numerous public escalators and skyways, such as the Bunker Hill steps[21] to facilitate pedestrian traffic in the traffic-laden and hilly terrain. Downtown Los Angeles is one of two neighborhoods in Los Angeles ranked as a "walker's paradise" (with walk scores 90 or above) by Walkscore. The other is Mid-City West, which encompasses the area of the city immediately south of West Hollywood and east of Beverly Hills.[22]
Nevertheless, much of Los Angeles remains pedestrian unfriendly. A large percentage of sidewalks in the City of Los Angeles (43% or 4,600 miles (7,400 km) of the 10,600 total miles (17,100 km)) are in ill repair stemming from the City Council decision in 1973 to use the federal money they had to take over the responsibility from the adjacent property owners. Previously they had conformed to California law which puts the responsibility for repair of sidewalks on the property owners. As certain popular species of trees accelerated the damage caused by roots, the council failed to concurrently allocate funds for continuing city repairs of such sidewalks. Voters were unwilling to approve funding repairs with a tax or a bond measure. The city again began dedicating funds for sidewalk repairs in 2000 but defunded the program during the 2008 financial crisis.[23] In 2015, the city agreed to a landmark legal settlement that would fix the backlog of broken sidewalks and make other improvements to help those with disabilities navigate the city. The biggest agreement of its kind in U.S. history would settle a lawsuit on behalf of people in wheelchairs or others with mobility impairments who argued that crumbling, impassable sidewalks and other barriers were a violation of the Americans With Disabilities Act since they were prevented from accessing public pathways.[24][25]
Bicycle travel
Bicycling accounts for approximately 1% of Los Angeles commuting and has almost doubled in the last ten years. People in Los Angeles commute to work by bicycle about twice as frequently as the US average[26] There are extended stretches of bicycle paths such as the Los Angeles River bicycle path, which runs from Burbank to Long Beach, with only a brief hiatus through downtown.
Mass transit
The primary regional public transportation agency is the Los Angeles County Metropolitan Transportation Authority (LACMTA), commonly referred to as Metro or MTA. The agency, which operates bus, light rail and subway services, averages 1.2 million transit trips per weekday,[27] making it the third largest transit agency in the United States. Other municipal transportation agencies in Los Angeles County (LADOT, Long Beach Transit, Montebello Bus Lines, Norwalk Transit, Redondo Beach, Santa Monica's Big Blue Bus, Santa Clarita Transit, Torrance Transit[28] and Foothill Transit) have an additional 405,000 average weekday boardings.[29]
In February 2008, LACMTA introduced a new universal fare system called 'TAP' which stands for Transit Access Pass. The TAP smart card allows bus and rail passengers to tap their cards on the farebox for faster boarding. TAP readers are installed on bus fareboxes and on turnstiles and standalone validators at rail stations. Because not all Metro Rail stations have turnstiles, it operates on a proof-of-payment system: as such, Metro's fare inspectors randomly check to make sure TAP users have validated their card by using a wireless handheld unit. TAP is now accepted on a number of different transit systems in Los Angeles County.
Buses
The extensive bus system operated by LACMTA includes the Metro Local, Metro Rapid, and formerly Metro Express services. Local buses tend to be orange, rapid buses red, and express buses blue. Rapid bus route numbers usually begin with a 7 and express bus numbers begin with 4 and 5. The buses have an estimated 1.3 million boardings on the weekdays.[30] Including other municipal bus operators, Los Angeles County averages 1.7 million bus boardings per weekday,[29] accounting for approximately 5.9% of the 29 million daily trips originating in Los Angeles County.[31]
LACMTA has two bus rapid transit lines: the Orange Line and the Silver Line. The Orange Line runs from Warner Center/Woodland Hills to the North Hollywood Red Line station, began operations on October 29, 2005. For 13 of its 14-mile (23 km) stretch (21 km of its 22.5 km stretch), the 60-foot (18 m) articulated buses, built by North American Bus Industries and dubbed Metro Liners, operate on bus-only lanes that follow an old railroad right-of-way. Portions of the route parallel Chandler and Victory Boulevards, and Oxnard Street.
The Silver Line travels 26 miles (42 km) along Interstate 10 and Interstate 110 between El Monte Station and the Harbor Gateway Transit Center.
Foothill Transit also operates a bus rapid transit system called the Silver Streak, which runs from Montclair to Downtown Los Angeles along the El Monte Busway on Interstate 10.
Other bus systems:
- Culver CityBus - green (local) and grey (rapid)
- Santa Monica's Big Blue Bus
- Montebello Bus Lines
- Numerous other municipal bus systems
Metro Rail

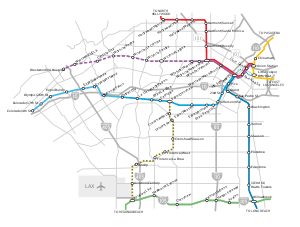
Between its light rail and heavy rail systems, Metro Rail has 83 miles (134 km) of rail, averaging 308,653 trips per weekday,[30] and accounting for approximately 1.1% of the 29 million daily trips originating in Los Angeles County.[31] The network includes four above-ground light rail lines (Gold Line, Expo Line, Blue Line, and Green Line) and one underground subway with two branches (Red Line and Purple Line). Ranked by daily ridership, the Los Angeles subway ranked as the ninth-busiest rapid transit system in the United States. Ranked by passengers per route mile, however, the system ranks sixth, transporting 8,846 passengers per route mile,[30] more than San Francisco's Bay Area Rapid Transit or the Chicago 'L'.
The Los Angeles Metro Rail system connects disperse areas of the county including Long Beach, Pasadena, Norwalk, El Segundo, North Hollywood, and Downtown Los Angeles. The Expo Line's first phase from Downtown Los Angeles to Culver City opened April 28, 2012. In June 2010, construction extending the Gold Line from Pasadena to Azusa began. There are several additional rail expansion projects currently under study. The timing of their construction will depend on the availability of funding. These projects include:
- Crenshaw/LAX Line, that will run through the Crenshaw district and City of Inglewood to LAX (now under construction)
- Connection of the Green Line and Crenshaw/LAX Line to LAX through a people mover.
- Regional Connector in Downtown Los Angeles, connecting the Expo, Blue, and Gold lines (now under construction).
- Further extensions of the Gold Line from Azusa to Pomona and East Los Angeles to Whittier
- Westward extension of the Purple Line subway to Westwood, UCLA and possible connection to the Red Line through West Hollywood and Beverly Hills (now under construction).
Commuter rail
Also serving Los Angeles and several surrounding counties is Metrolink, a regional commuter rail service. Metrolink averages 42,600 trips per weekday, the busiest line being the San Bernardino line.[29]
Los Angeles public transportation statistics
The average amount of time people spend commuting with public transit in Los Angeles, for example to and from work, on a weekday is 86 minutes. 31% of public transit riders ride for more than 2 hours every day. The average amount of time people wait at a stop or station for public transit is 20 minutes, while 38% of riders wait for over 20 minutes on average every day. The average distance people usually ride in a single trip with public transit is 6.9 mi (11.1 km), while 30% travel for over 7.5 mi (12.1 km) in a single direction.[32]
Taxi companies
Taxis in Los Angeles are regulated by the Board of Taxicab Commissioners. There are nine taxi companies in Los Angeles that operate more than 2300 taxis. Some of the largest Taxi companies in Los Angeles are LA Yellow Cab, Bell Cab and United Independent Taxi. Recently Taxi Applications have emerged in order to provide users with on demand rides with lower wait times. RideYellow, Curb and Flywheel are three of the largest taxi apps providing taxi service in Los Angeles.[33][34]
Transportation network companies
Transportation network companies arrange one-time rides on very short notice. These companies use smartphones and GPS technology to allow travelers to request a ride from wherever they happen to be, to the place they want to go. Drivers have passed background checks and their cars have also passed thorough inspections.[35] Uber and Lyft are the two largest companies in Los Angeles that are commonly referred to as ridesharing or ride-hailing services.
Commuting
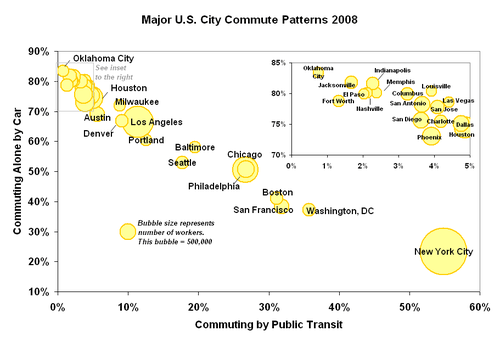
In 2006, of the 4,423,725 workers aged 16 or older in Los Angeles County, 72.0% commuted to work driving alone, 11.9% commuted by driving in a carpool and 7.0% commuted on public transportation. 64.9% of public transportation commuters were non-white, 70.2% were Hispanic and 67.6% were foreign born. 75.5% of public transportation commuters earned less than $25,000. However, only 32.7% of public transportation commuters had no vehicle available to them for their commute.[11]
In the same year, for the City of Los Angeles, of the 1,721,778 workers aged 16 or older, 63.3% commuted to work driving alone, 11.5% commuted by driving in a carpool, 11.0% commuted by public transportation, and 3.4% walked. The percentage of population using public transport in Los Angeles is lower than other large U.S. cities such as Chicago and New York, but similar to or higher than other western U.S. cities such as Portland and Denver. 63.8% of public transportation commuters in the City of Los Angeles in 2006 were non-white, 75.1% were Hispanic and 73.9% were foreign born. 79.4% of public transportation commuters earned less than $25,000 and 37.6% had no vehicle available to them for their commute.[11]
Since 2006, driving alone increased at the expense of carpooling and public transportation. According to the 2016 American Community Survey, 69.7% of working Los Angeles (city) residents commuted by driving alone, 8.7% carpooled, 9.2% used public transportation, and 3.5% walked. About 2.8% commuted by all other means, including taxi, bicycle, and motorcycle. About 6.1% worked at home.[18]
Problems
Accidents
A traffic accident happens when a vehicle crashes due to malfunction, driver error, faulty road design, weather conditions, or a combination of these factors. The vehicle and its owner involved in a traffic accident usually collide with other vehicles, people, animals or stationary obstacles which can result in property damage, injuries, and even death. The majority of accidents are caused by human errors. In the U.S., traffic accidents caused 32,700 fatalities in 2013, and driver errors are responsible for 90% of the crashes. In that same year, the World Health Organization estimated the annual fatalities worldwide due to car accident to be as many as 1.24 million.[36]
Air quality
Los Angeles is strongly predisposed to accumulation of smog, because of peculiarities of its geography and weather patterns. The millions of vehicles in the area combined with the additional effects of the Los Angeles/Long Beach complex frequently contribute to further air pollution. Los Angeles was one of the best known cities suffering from transportation smog for much of the 20th century, so much so that it was sometimes said that Los Angeles was a synonym for smog.[37] In particular, the entire area in between Los Angeles Harbor and Riverside has become known as the "Diesel Death Zone".[38]
Americans with Disabilities Act
The city has about 9,300 miles (15,000 km) of sidewalk. Many are perilous or impassable due to lack of maintenance to those who have disabilities that affect their mobility. In 2015, the city committed to spending $1.4 billion over the next 30 years to resolved a class-action lawsuit citing violations of the Americans With Disabilities Act by fixing other barriers to full and safe access to city streets.[39]
Congestion
Traffic congestion happens due to high roadway demand, where the number of automobiles that try to pass through a road section exceeds the road’s capacity, causing a slowdown in traffic flow. Traffic congestion can also be a result of poor transportation infrastructure, road construction or traffic accidents. Traffic congestion negatively affects society’s productivity. Traffic congestions cost EU 1% of its GDP, whereas an Urban Mobility report revealed that the U.S. lost 160 million dollars due to delay and fuel costs in 2014.[40]
First/Last Mile
In the modern transportation sector, the last mile refers to the way in which people get from the high capacity transportation hubs to their final destinations such as their home or workplace. This last mile can be a problem for commuters because public transportation systems do not take them to their exact destination; from the transportation hub, people usually have to walk to their destination for the “last mile,” which can be time consuming and inconvenient.[41] This logic also applies to the first mile problem, since from the starting point of travel, people have to walk equal distance as the last mile to get to the nearest transportation hub. To avoid walking, urban dwellers may find owning a car a remedy to this problem; however, if everyone drives to his or her destination instead of taking public transportation, the congestion in an urban area can become worse and the benefit of the public transportation infrastructure is lost.
See also
- Asbury Rapid Transit System (1935-1958), small, privately owned bus system
- Freeway system of Los Angeles
- Great American Streetcar Scandal, conspiracy theory on demise of Red Car system
- History of Pacific Electric (Red Car)
- Transportation in Greater Los Angeles
References
- "The City of Los Angeles". History of Transportation in Los Angeles. usp100la.weebly.com.
- Airports Council International. "Statistics World Airport Traffic 2007" (PDF). Retrieved 10 March 2009.
- Amtrak National Facts Archived 2011-05-27 at the Wayback Machine. Accessed July 2, 2008
- "Megabus Bus Stops". Megabus. Megabus. Archived from the original on December 9, 2019. Retrieved November 9, 2019.
- "Greyhound Bus Stops". Greyhound. Greyhound. Retrieved November 9, 2019.
- Google (9 November 2019). "Greyhound Los Angeles Main Bus Terminal" (Map). Google Maps. Google. Retrieved 9 November 2019.
- Google (9 November 2019). "Greyhound North Hollywood Terminal" (Map). Google Maps. Google. Retrieved 9 November 2019.
- "Greyhound North Hollywood Station". Greyhound. Greyhound. Retrieved November 9, 2019.
- Federal Highway Administration. "Southern California Regional Freight Study".
- "City of Avalon - FAQ". Archived from the original on 8 July 2011. Retrieved 1 September 2011.
- "American Community Survey 2006, Table S0802". U.S. Census Bureau. Archived from the original on 2014-11-15.
- Lovett, Ian (2013-04-01). "To Fight Gridlock, Los Angeles Synchronizes Every Red Light". The New York Times. ISSN 0362-4331. Retrieved 2017-12-21.
- "L.A. stoplights synchronized to improve traffic". CBS News. May 25, 2013. Retrieved 2017-12-21.
- Epstein, Eli (April 2, 2013). "Los Angeles syncs up all 4,500 of its traffic lights". MSN News. Archived from the original on March 13, 2014. Retrieved 2017-12-21.
- Melissa MacBride, "Pothole milestone: Mayor repairs 800,000," Archived 2010-02-21 at the Wayback Machine ABC7 Eyewitness News, 17 March 2008.
- Steven Leigh Morris, "L.A. Metro Buses Hammered By Potholes on Aging Wilshire Boulevard," LA Weekly, 5 September 2008.
- "You won't see a cop walkin' on the beat / You only see 'em drivin' cars out on the street / You won't see a kid walkin' home from school / Their mothers pick 'em up in a car pool / Nobody's walkin' walkin' walkin' walkin—nobody walks in LA" Missing Persons, "Walking in LA"
- "Means of Transportation to Work by Age". Census Reporter. Retrieved May 6, 2018.
- CDC Walking for Exercise Prevalence Statistics 2000
- History of Third Street Promenade Archived 2008-07-09 at the Wayback Machine
- "Bunker Hill Steps". Los Angeles Conservancy. Retrieved 2017-12-21.
- "Living in Los Angeles". Walkscore. Retrieved 5 April 2015.
- Zahniser, David (February 21, 2008) "City to pass the bucks on sidewalks?" Los Angeles Times
- Reyes, Emily Alpert (April 1, 2015). "L.A. agrees to spend $1.3 billion to fix sidewalks in ADA case". Los Angeles Times.
- "Willits v. City of Los Angeles Sidewalk Settlement Announced". Legal Aid Society–Employment Law Center. April 1, 2015. Retrieved 5 April 2015.
- Bureau, US Census. "1.0 percent of Workers Commute by Bike in Los Angeles".
- "Metro Ridership". isotp.metro.net. Retrieved 2018-12-26.
- "Negligence: Broken manhole cover causes accident" (PDF). Tri-Service. 17 September 2001.
-
American Public Transportation Association (1Q 2008). "Transit Ridership Report". Archived from the original on 13 May 2008. Retrieved 23 July 2008. Check date values in:
|date=(help) - "Facts at a Glance". LACMTA. 11 July 2008. Retrieved 17 July 2008.
- "2008 Long Range Transportation Plan Technical Document" (PDF). LACMTA. Archived from the original (PDF) on 4 December 2008. Retrieved 17 July 2008.
- "Los Angeles Public Transportation Statistics". Global Public Transit Index by Moovit. Retrieved June 19, 2017.

- Bustillos, Maria (December 12, 2014). "How Los Angeles's Taxi Boss Plans to Take on Uber". The New Yorker. Retrieved 24 May 2017.
- Watt, Brian (September 28, 2015). "More than 100 LA taxi drivers vote to join national union". KPCC. Retrieved 24 May 2017.
- "DECISION ADOPTING RULES AND REGULATIONS TO PROTECT PUBLIC SAFETY WHILE ALLOWING NEW ENTRANTS TO THE TRANSPORTATION INDUSTRY" (PDF). California Public Utilities Commission. December 20, 2012.
- J. N. Bajpai (2016). "Urban, Planning and Transport Research, vol. 4, no. 1, pp. 83–100".
- Roger G. Noll (1999). The Economics and Politics of the Slowdown in Regulatory Reform.
- "California's Air Pollution Causes Asthma, Allergies and Premature Births | DiscoverMagazine.com". Discover Magazine. Retrieved 2017-02-22.
- Lelyveld, Nita (October 3, 2019). "How an alarming photo of a wheelchair accident exposed L.A.'s shabby sidewalks". Los Angeles Times. Retrieved October 3, 2019.
- J. N. Bajpai (2016). "Urban, Planning and Transport Research, vol. 4, no. 1, pp. 83–100".
- Stigo, "The Last Mile - the term, the problem and the odd solutions", medium.com, 04-Oct-2017
External links
| By topic |  | |
|---|---|---|
| Government | ||