Thompson (electoral district)
Thompson is a provincial electoral division in the Canadian province of Manitoba. It was created by redistribution in 1968 from parts of Churchill and Rupertsland, and has formally existed since the provincial election of 1969.
 | |||
| Provincial electoral district | |||
| Legislature | Legislative Assembly of Manitoba | ||
| MLA |
New Democratic | ||
| District created | 1968 | ||
| First contested | 1969 | ||
| Last contested | 2019 | ||
| Demographics | |||
| Census subdivisions | Thompson | ||
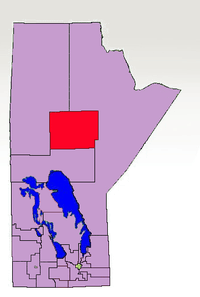
Thompson is located in the north of the province. It is bordered by Rupertsland to the north and east, Keewatinook to the north and west, and The Pas to the south. The city of Thompson was incorporated shortly before the riding's creation, and is its only major urban centre. Almost half of the riding's residents live in that community.
The riding's population in 1996 was 19,349. In 1999, the average family income was $56,402, and the unemployment rate was 12.60%. The riding's character is primarily working-class, with 17% of its economy coming from the mining sector.
Forty-two per cent of the riding's residents are aboriginal, the third highest rate in the province.
Thompson is usually considered safe for the New Democratic Party, which represented the riding almost continually since its creation. The current MLA, New Democrat Danielle Adams defeated Progressive Conservative Kelly Bindle in the 2019 election. Bindle had previously defeated longtime MLA Steve Ashton as part of his party's landslide victory in the 2016 election. Bindle was only the second Tory ever to win the seat, and the first since 1977.
List of provincial representatives
| Name | Party | Took Office | Left Office |
|---|---|---|---|
| Joseph Borowski | NDP | 1969 | 1972 |
| Independent NDP | 1972 | 1973 | |
| Ken Dillen | NDP | 1973 | 1977 |
| Ken MacMaster | PC | 1977 | 1981 |
| Steve Ashton | NDP | 1981 | 2016 |
| Kelly Bindle | PC | 2016 | 2019 |
| Danielle Adams | NDP | 2019 | present |
Electoral results
| 2019 Manitoba general election | ||||||||
|---|---|---|---|---|---|---|---|---|
| ** Preliminary results — Not yet official ** | ||||||||
| Party | Candidate | Votes | % | ±% | ||||
| New Democratic | Danielle Adams | 2,651 | 54.41 | +16.0 | ||||
| Progressive Conservative | Kelly Bindle | 1,750 | 35.92 | -4.6 | ||||
| Green | Meagan Jemmett | 294 | 6.03 | |||||
| Liberal | Darla Contois | 177 | 3.63 | -17.29 | ||||
| Total valid votes | 4,872 | 100.0 | ||||||
| Total rejected ballots | ||||||||
| Turnout | 37.1 | |||||||
| Eligible voters | ||||||||
| New Democratic gain from Progressive Conservative | Swing | +10.3 | ||||||
| 2016 provincial election redistributed results[1] | |||
|---|---|---|---|
| Party | % | ||
| Progressive Conservative | 40.5 | ||
| New Democratic | 38.4 | ||
| Liberal | 20.9 | ||
| Independent | 0.1 | ||
| 2016 Manitoba general election | ||||||||
|---|---|---|---|---|---|---|---|---|
| Party | Candidate | Votes | % | ±% | Expenditures | |||
| Progressive Conservative | Kelly Bindle | 1,712 | 44.15 | +15.99 | $11,544.03 | |||
| New Democratic | Steve Ashton | 1,527 | 39.38 | -28.82 | $17,980.87 | |||
| Liberal | Inez Vystrcil-Spence | 638 | 16.45 | +13.29 | $7,318.95 | |||
| Total valid votes/Expense limit | 3,877 | 100.0 | $32,545.00 | |||||
| Eligible voters | – | |||||||
| Source: Elections Manitoba[2][3][4] | ||||||||
| 2011 Manitoba general election | ||||||||
|---|---|---|---|---|---|---|---|---|
| Party | Candidate | Votes | % | ±% | Expenditures | |||
| New Democratic | Steve Ashton | 2,586 | 68.20 | −5.24 | $11,696.80 | |||
| Progressive Conservative | Anita Campbell | 1,068 | 28.16 | +18.10 | $16,809.87 | |||
| Liberal | Ken Dillen | 120 | 3.16 | −12.73 | $462.91 | |||
| Total valid votes | 3,774 | |||||||
| Rejected and declined votes | 18 | |||||||
| Turnout | 3,792 | 36.72 | −3.09 | |||||
| Registered voters | 10,328 | |||||||
| 2007 Manitoba general election | ||||||||
|---|---|---|---|---|---|---|---|---|
| Party | Candidate | Votes | % | ±% | Expenditures | |||
| New Democratic | Steve Ashton | 3,036 | 73.44 | $9,356.43 | ||||
| Liberal | Kenny Braun | 651 | 15.89 | – | $7,377.03 | |||
| Progressive Conservative | Cory Phillips | 416 | 10.06 | $688.99 | ||||
| Total valid votes | 4,108 | 99.37 | ||||||
| Rejected and declined votes | 26 | |||||||
| Turnout | 4,134 | 39.81 | ||||||
| Registered voters | 10,384 | |||||||
| 2003 Manitoba general election | ||||||||
|---|---|---|---|---|---|---|---|---|
| Party | Candidate | Votes | % | ±% | Expenditures | |||
| New Democratic | Steve Ashton | 3,291 | $9,804.99 | |||||
| Progressive Conservative | Bill Archer | 532 | $2,448.27 | |||||
| Liberal | Myrle Traverse | 155 | $627.36 | |||||
| Total valid votes/Expense limit | 100.0 | $ | ||||||
| Eligible voters | – | |||||||
| Source: Elections Manitoba[6][7] | ||||||||
| 1999 Manitoba general election | ||||||||
|---|---|---|---|---|---|---|---|---|
| Party | Candidate | Votes | % | ±% | Expenditures | |||
| New Democratic | Steve Ashton | 3,793 | 70.58 | $7,846.00 | ||||
| Progressive Conservative | Cecil Thorne | 1,306 | 24.03 | $20,487.52 | ||||
| Liberal | Pascal Bighetty | 244 | 4.54 | – | $2,661.92 | |||
| Total valid votes | 5,343 | 100.00 | ||||||
| Rejected and declined votes | 31 | |||||||
| Turnout | 5,374 | 57.48 | ||||||
| Registered voters | 9,879 | |||||||
| 1995 Manitoba general election | ||||||||
|---|---|---|---|---|---|---|---|---|
| Party | Candidate | Votes | % | ±% | ||||
| New Democratic | Steve Ashton | 3,619 | 61.71 | +1.78 | ||||
| Progressive Conservative | Chuck Shabe | 1,320 | 22.51 | -7.36 | ||||
| Liberal | Tim Johnston | 926 | 15.79 | +5.57 | ||||
| Total valid votes | 5,865 | 100.00 | ||||||
| Rejected votes | 19 | |||||||
| Turnout | 5,884 | 54.87 | ||||||
| Registered voters | 10,724 | |||||||
| Source: Elections Manitoba[9] | ||||||||
| 1973 Manitoba general election | ||||||||
|---|---|---|---|---|---|---|---|---|
| Party | Candidate | Votes | % | |||||
| New Democratic | Ken Dillen | 2,742 | 37.54 | |||||
| Progressive Conservative | Anna Denby | 2,480 | 33.95 | |||||
| Liberal | Blain Johnston | 2,083 | 28.51 | |||||
| Total valid votes | 7,305 | 100.00 | ||||||
| Rejected votes | 33 | |||||||
| Turnout | 7,338 | 71.30 | ||||||
| Electors on the lists | 10,292 | |||||||
Previous boundaries
References
- Marcoux, Jacques (2019-08-27). "New Manitoba election boundaries give upper hand to Progressive Conservatives, CBC News analysis finds". CBC. Retrieved 2019-09-14.
- "Candidates: 41st General Election". Elections Manitoba. 29 March 2016. Retrieved 31 March 2016.
- "41ST GENERAL ELECTION, APRIL 19, 2016 - OFFICIAL RESULTS". Elections Manitoba. 19 April 2016. Retrieved 10 November 2016.
- "Election Returns: 41st General Election". Elections Manitoba. 2016. Retrieved 10 September 2018.
- "Archived copy". Archived from the original on 2012-03-21. Retrieved 2010-11-25.CS1 maint: archived copy as title (link) - 2007 results
- "Election Returns: 38th General Election". Elections Manitoba. 2003. Retrieved 16 September 2018.
- http://www.elections.mb.ca/en/Results/38_division_results/38_thompson_summary_results.html
- "Archived copy". Archived from the original on 2011-09-28. Retrieved 2010-08-10.CS1 maint: archived copy as title (link) - 1999 Results
- "Election Returns: 36th General Election" (PDF). Elections Manitoba. 1995. Retrieved 16 October 2018.