St. Vital (electoral district)
St. Vital (French: Saint-Vital) is a provincial electoral division in the Canadian province of Manitoba.
 | |||
| Provincial electoral district | |||
| Legislature | Legislative Assembly of Manitoba | ||
| MLA |
New Democratic | ||
| District created | 1957 | ||
| First contested | 1958 | ||
| Last contested | 2019 | ||
Historical riding
The original St. Vital riding was established at the time of the province's creation in 1870, as one of twelve "francophone" constituencies. It was eliminated in 1879, after a redistribution process which reduced the level of francophone representation in the province.
List of provincial representatives
| Name | Party | Took Office | Left Office |
|---|---|---|---|
| André Beauchemin | Government/French Party | 1870 | 1874 |
| Joseph Lemay | Government/French Party | 1874 | 1878 |
| Maxime Goulet | Government/French Party | 1878 | 1879 |
| Opposition/French Party | 1878 | 1879 |
Current riding
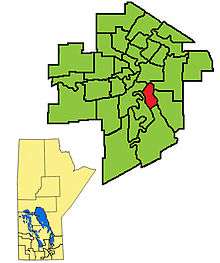
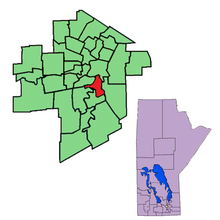
The modern St. Vital riding was created by redistribution in 1957, and has formally existed since the provincial election of 1958. The riding is located in the southeastern section of the City of Winnipeg.
St. Vital is bordered to the east by St. Boniface and Southdale, to the south by Riel, to the north by St. Boniface and to the west by Riel, Lord Roberts and Fort Garry.
The riding's population in 1996 was 20,255. Its character is mostly middle-class, although 28% of the riding's residents are categorized as low income. In 1999, the average family income was $44,868, and the unemployment rate was 7.90%. Ten per cent of the riding's residents are francophone, and 7% are aboriginal. Almost half the riding's dwellings are rental units.
The service sector accounts for 16% of St. Vital's industry, with a further 13% in the retail trade.
St. Vital was represented by members of the Progressive Conservative party from 1958 to 1971. Since then, it has generally been represented by members of the Manitoba New Democratic Party (NDP), although the Liberals held the seat for one term from 1988–1990, and the Progressive Conservatives for two terms from 1990-1999.
List of provincial representatives
| Name | Party | Took Office | Left Office |
|---|---|---|---|
| Fred Groves | PC | 1958 | 1966 |
| Donald Craik | PC | 1966 | 1969 |
| Jack Hardy | PC | 1969 | 1971 |
| Jim Walding | NDP | 1971 | 1988 |
| Bob Rose | Lib | 1988 | 1990 |
| Shirley Render | PC | 1990 | 1999 |
| Nancy Allan | NDP | 1999 | 2016 |
| Colleen Mayer | PC | 2016 | 2019 |
| Jamie Moses | NDP | 2019 | Present |
Electoral results
| 2019 Manitoba general election | ||||||||
|---|---|---|---|---|---|---|---|---|
| Party | Candidate | Votes | % | ±% | ||||
| New Democratic | Jamie Moses | 4,081 | 44.44 | +10.1 | ||||
| Progressive Conservative | Colleen Mayer | 3,211 | 34.96 | -7.8 | ||||
| Liberal | Jeffrey Anderson | 1,271 | 13.84 | -2.8 | ||||
| Green | Elizabeth Dickson | 499 | 5.43 | -0.9 | ||||
| Independent | Baljeet Sharma | 62 | 0.68 | |||||
| Manitoba First | David Sutherland | 60 | 0.65 | |||||
| Total valid votes | 9,184 | 100.0 | ||||||
| Total rejected ballots | ||||||||
| Turnout | 63.7 | |||||||
| Eligible voters | ||||||||
| New Democratic gain from Progressive Conservative | Swing | +9.0 | ||||||
| 2016 provincial election redistributed results[1] | |||
|---|---|---|---|
| Party | % | ||
| Progressive Conservative | 42.8 | ||
| New Democratic | 34.3 | ||
| Liberal | 16.6 | ||
| Green | 6.3 | ||
| 2016 Manitoba general election | ||||||||
|---|---|---|---|---|---|---|---|---|
| Party | Candidate | Votes | % | ±% | Expenditures | |||
| Progressive Conservative | Colleen Mayer | 3,229 | 39.63 | +5.23 | $24,705.52 | |||
| New Democratic | Jamie Moses | 2,831 | 34.74 | -25.34 | $26,333.60 | |||
| Liberal | Bryan Van Wilgenburg | 1,296 | 15.90 | +10.39 | $6,849.49 | |||
| Green | Kelly Whelan-Enns | 791 | 9.70 | +9.70 | $50.00 | |||
| Total valid votes/Expense limit | 8,147 | 98.69 | - | $43,267.00 | ||||
| Rejected and declined votes | 108 | 1.31 | ||||||
| Turnout | 8,255 | 63.97 | ||||||
| Registered voters | 12,905 | |||||||
| Source: Elections Manitoba[2][3][4] | ||||||||
| 2011 Manitoba general election: St. Vital | ||||||||
|---|---|---|---|---|---|---|---|---|
| Party | Candidate | Votes | % | ±% | Expenditures | |||
| New Democratic | Nancy Allan | 5,023 | 60.08 | −1.66 | $20,791.20 | |||
| Progressive Conservative | Mike Brown | 2,876 | 34.40 | +10.99 | $25,083.94 | |||
| Liberal | Harry Wolbert | 461 | 5.51 | −4.85 | $902.02 | |||
| Total valid votes | 8,360 | 99.53 | ||||||
| Rejected and declined votes | 39 | 0.46 | ||||||
| Turnout | 8,399 | 60.35 | ||||||
| Registered voters | 13,918 | |||||||
| Majority | 2,147 | 25.68 | ||||||
| Source: Elections Manitoba[5] | ||||||||
| 2007 Manitoba general election: St. Vital | ||||||||
|---|---|---|---|---|---|---|---|---|
| Party | Candidate | Votes | % | ±% | Expenditures | |||
| New Democratic | Nancy Allan | 4,611 | 61.74 | −1.79 | $16,126.19 | |||
| Progressive Conservative | Grant Cooper | 1,754 | 23.41 | −0.41 | $16,686.95 | |||
| Liberal | Harry Wolbert | 776 | 10.36 | +0.19 | $4,889.96 | |||
| Green | Kristine Koster | 351 | 4.68 | +2.10 | $248.50 | |||
| Total valid votes | 7,492 | 100.00 | ||||||
| Rejected and declined votes | 25 | |||||||
| Turnout | 7,517 | 58.46 | +6.30 | |||||
| Registered voters | 12,859 | |||||||
| 2003 Manitoba general election: St. Vital | ||||||||
|---|---|---|---|---|---|---|---|---|
| Party | Candidate | Votes | % | ±% | Expenditures | |||
| New Democratic | Nancy Allan | 4,409 | 63.43 | +12.52 | $12,969.78 | |||
| Progressive Conservative | Kirsty Reilly | 1,656 | 23.82 | -12.27 | $3,931.49 | |||
| Liberal | Justin Beaudry | 707 | 10.17 | -0.55 | $1,713.63 | |||
| Green | Nelson Morrison | 179 | 2.58 | $53.60 | ||||
| Total valid votes | 6,951 | 100.00 | ||||||
| Rejected and declined votes | 43 | |||||||
| Turnout | 6,994 | 52.16 | ||||||
| Registered voters | 13,409 | |||||||
| 1999 Manitoba general election: St. Vital | ||||||||
|---|---|---|---|---|---|---|---|---|
| Party | Candidate | Votes | % | ±% | Expenditures | |||
| New Democratic | Nancy Allan | 5,298 | 50.91 | +16.29 | $24,796.00 | |||
| Progressive Conservative | Shirley Render | 3,699 | 36.09 | -5.38 | $30,635.47 | |||
| Liberal | Lynn Clark | 1,099 | 10.72 | -13.19 | $10,303.82 | |||
| Manitoba Party | Brian Hanslip | 188 | 1.83 | $846.32 | ||||
| Total valid votes | 10,204 | 100.00 | ||||||
| Rejected and declined votes | 46 | |||||||
| Turnout | 10,250 | 74.04 | ||||||
| Registered voters | 13,844 | |||||||
| 1995 Manitoba general election: St. Vital | ||||||||
|---|---|---|---|---|---|---|---|---|
| Party | Candidate | Votes | % | |||||
| Progressive Conservative | Shirley Render | 4,021 | 41.47 | |||||
| New Democratic | Sig Laser | 3,357 | 34.62 | |||||
| Liberal | Tim Ryan | 2,319 | 23.91 | |||||
| 1988 Manitoba general election | ||||||||
|---|---|---|---|---|---|---|---|---|
| Party | Candidate | Votes | % | ±% | ||||
| Liberal | Bob Rose | 4,431 | 42.22 | +27.16 | ||||
| Progressive Conservative | Paul Herriot | 3,614 | 34.43 | -5.19 | ||||
| New Democratic | Gerri Unwin | 2,282 | 21.74 | -23.59 | ||||
| Western Independence | Katharina Cameron | 123 | 1.17 | n/a | ||||
| Libertarian | Trevor Wiebe | 46 | 0.44 | n/a | ||||
| Total valid votes | 10,496 | 100.00 | - | |||||
| Rejected ballots | 18 | – | – | |||||
| Turnout | 10,514 | 79.08 | ||||||
| Eligible voters | 13,296 | |||||||
| Liberal gain from New Democratic | Swing | +25.37 | ||||||
| Source: Elections Manitoba[8] | ||||||||
| 1986 Manitoba general election | ||||||||
|---|---|---|---|---|---|---|---|---|
| Party | Candidate | Votes | % | ±% | ||||
| New Democratic | Jim Walding | 4,430 | 45.32 | −7.48 | ||||
| Progressive Conservative | Paul Herriot | 3,872 | 39.62 | −1.02 | ||||
| Liberal | Walter Pederson | 1,472 | 15.06 | +8.50 | ||||
| Turnout | 9,805 | 73.81 | −6.80 | |||||
| New Democratic hold | Swing | -3.23 | ||||||
| Source: Elections Manitoba[9] | ||||||||
| 1981 Manitoba general election | ||||||||
|---|---|---|---|---|---|---|---|---|
| Party | Candidate | Votes | % | ±% | ||||
| New Democratic | Jim Walding | 5,504 | 52.80 | +11.18 | ||||
| Progressive Conservative | John Robertson | 4,236 | 40.64 | +4.69 | ||||
| Liberal | Gord Patterson | 684 | 6.56 | -15.87 | ||||
| Total valid votes | 10,424 | 100.00 | ||||||
| Rejected votes | 34 | |||||||
| Turnout | 10,458 | 80.61 | ||||||
| Electors on the lists | 12,974 | |||||||
| New Democratic hold | Swing | +3.24 | ||||||
| 1977 Manitoba general election | ||||||||
|---|---|---|---|---|---|---|---|---|
| Party | Candidate | Votes | % | ±% | ||||
| New Democratic | Jim Walding | 3,924 | 41.62 | +2.37 | ||||
| Progressive Conservative | Gil Shaw | 3,390 | 35.95 | +13.38 | ||||
| Liberal | Eddie Coutu | 2,115 | 22.43 | −15.75 | ||||
| Total valid votes | 9,429 | 100.00 | ||||||
| Rejected votes | 18 | |||||||
| Turnout | 9,447 | 84.70 | −1.14 | |||||
| Electors on the lists | 11,154 | |||||||
| New Democratic hold | Swing | -5.50 | ||||||
| 1973 Manitoba general election | ||||||||
|---|---|---|---|---|---|---|---|---|
| Party | Candidate | Votes | % | ±% | ||||
| New Democratic | Jim Walding | 3,870 | 39.25 | +3.56 | ||||
| Liberal | Dan Kennedy | 3,765 | 38.18 | +9.87 | ||||
| Progressive Conservative | John Gee | 2,225 | 22.57 | −13.44 | ||||
| Total valid votes | 9,860 | 100.00 | ||||||
| Rejected votes | 51 | |||||||
| Turnout | 9,911 | 85.84 | +17.80 | |||||
| Electors on the lists | 11,546 | |||||||
| New Democratic hold | Swing | -3.15 | ||||||
| Manitoba provincial by-election, April 5, 1971 | ||||||||
|---|---|---|---|---|---|---|---|---|
| Party | Candidate | Votes | % | ±% | ||||
| New Democratic | Jim Walding | 3,378 | 35.94 | +0.25 | ||||
| Liberal | Dan Kennedy | 3,083 | 32.80 | +4.49 | ||||
| Progressive Conservative | Kenneth Pratt | 2,925 | 31.12 | −4.89 | ||||
| Independent | Sam Bordman | 13 | 0.14 | |||||
| Total valid votes | 9,399 | 100 | ||||||
| Rejected and declined ballots | 10 | |||||||
| Turnout | 9,409 | 83.05 | +15.01 | |||||
| Electors on the lists | 11,329 | |||||||
| New Democratic gain from Progressive Conservative | Swing | +2.57 | ||||||
| 1969 Manitoba general election | ||||||||
|---|---|---|---|---|---|---|---|---|
| Party | Candidate | Votes | % | ±% | ||||
| Progressive Conservative | Jack Hardy | 2,587 | 36.01 | |||||
| New Democratic | Jim Walding | 2,564 | 35.69 | |||||
| Liberal | Joe Stangl | 2,034 | 28.31 | |||||
| Total valid votes | 7,185 | 100.00 | ||||||
| Rejected votes | 39 | |||||||
| Turnout | 7,224 | 68.04 | ||||||
| Electors on the lists | 10,617 | |||||||
| Progressive Conservative hold | Swing | |||||||
Previous boundaries
References
- Marcoux, Jacques (2019-08-27). "New Manitoba election boundaries give upper hand to Progressive Conservatives, CBC News analysis finds". CBC. Retrieved 2019-09-15.
- "Candidates: 41st General Election". Elections Manitoba. 29 March 2016. Retrieved 31 March 2016.
- "41ST GENERAL ELECTION, APRIL 19, 2016 - OFFICIAL RESULTS". Elections Manitoba. 19 April 2016. Retrieved 16 November 2016.
- "Election Returns: 41st General Election". Elections Manitoba. 2016. Retrieved 7 September 2018.
- "Election Returns: 40th General Election". Elections Manitoba. 2011. Retrieved 7 September 2018.
- http://www.electionsmanitoba.ca/en/Results/39_division_results/39_stvital_summary_results.html - 2007 results
- http://www.electionsmanitoba.ca/apps/results/37gen/pbp.asp?ED=46 - 1999 Results
- "Candidates: 34th General Election" (PDF). Elections Manitoba. April 26, 1988. Retrieved 2 October 2018.
- "Historical Summary" (PDF). Retrieved 2018-11-28.