Dauphin (provincial electoral district)
Dauphin is a provincial electoral division in the Canadian province of Manitoba. It was originally created in 1881 with the expansion of the province's western boundary, eliminated in 1886, re-established in 1892, and finally abolished in 1999. Most of its territory went to the new riding of Dauphin-Roblin, though a small amount went to the riding of Swan River. Dauphin-Roblin was largely replaced by a new Dauphin riding in the 2008 redistribution, expanding to include Ste. Rose du Lac.
- For the former federal electoral district, see Dauphin
 | |||
| Provincial electoral district | |||
| Legislature | Legislative Assembly of Manitoba | ||
| MLA |
Progressive Conservative | ||
| District created | 1881 | ||
| First contested | 1881 | ||
| Last contested | 2016 | ||
Dauphin was initially centred on the community of Dauphin, Manitoba, though it now encompasses much rural territory as well. It is located in the province's mid-northern region, close to the provincial border with Saskatchewan.
List of provincial representatives
| Name | Party | Took Office | Left Office |
|---|---|---|---|
| John A. Davidson | Lib | 1881 | 1882 |
| Lib-Cons | 1882 | 1886 | |
| Theodore Arthur Burrows | Lib-Cons, but supporting Thomas Greenway | 1892 | 1896 |
| Lib | 1896 | 1903 | |
| John Gunne | Cons | 1903 | 1907 |
| John Campbell | Lib | 1907 | 1910 |
| James G. Harvey | Cons | 1910 | 1914 |
| William Buchanan | Cons | 1914 | 1915 |
| William Harrington | Lib | 1915 | 1920 |
| George Palmer | DLP | 1920 | 1920 |
| ILP | 1920 | 1922 | |
| Archibald Esplen | Lib | 1922 | 1927 |
| Robert Ferguson | Cons | 1927 | 1932 |
| Robert Hawkins | Lib-Prog | 1932 | 1949 |
| Ernest McGirr | Cons | 1949 | 1953 |
| William Bullmore | SC | 1953 | 1958 |
| Independent | 1958 | 1958 | |
| Stewart McLean | Cons | 1958 | 1969 |
| Peter Burtniak | NDP | 1969 | 1977 |
| James Galbraith | PC | 1977 | 1981 |
| John Plohman | NDP | 1981 | 1995 |
| Stan Struthers | NDP | 1995 | 2016 |
| Brad Michaleski | PC | 2016 | present |
Electoral results
Dauphin (2011-present)
| 2019 Manitoba general election | ||||||||
|---|---|---|---|---|---|---|---|---|
| Party | Candidate | Votes | % | ±% | Expenditures | |||
| Progressive Conservative | Brad Michaleski | 4,799 | 50.5% | -9.51 | ||||
| New Democratic | Darcy Scheller | 4,023 | 42.4% | +18.64 | ||||
| Liberal | Cathy Scofield-Singh | 674 | 7.1% | +0.78 | ||||
| Total valid votes | 100.0 | |||||||
| Total rejected ballots | ||||||||
| Turnout | ||||||||
| Eligible voters | ||||||||
| 2016 Manitoba general election | ||||||||
|---|---|---|---|---|---|---|---|---|
| Party | Candidate | Votes | % | ±% | Expenditures | |||
| Progressive Conservative | Brad Michaleski | 4,795 | 60.01 | +18.89 | $40,261.43 | |||
| New Democratic | Darcy Scheller | 1,899 | 23.76 | -31.17 | $27,668.94 | |||
| Green | Kate Storey | 595 | 7.45 | +5.01 | $10.00 | |||
| Liberal | Garry Gurke | 505 | 6.32 | +4.8 | $10,170.71 | |||
| Manitoba | Darrel Inkster | 168 | 2.10 | $1,727.88 | ||||
| Total valid votes/Expense limit | 7,372 | 100.0 | ||||||
| Eligible voters | – | |||||||
| Source: Elections Manitoba[1][2] | ||||||||
| 2011 Manitoba general election | ||||||||
|---|---|---|---|---|---|---|---|---|
| Party | Candidate | Votes | % | Expenditures | ||||
| New Democratic | Stan Struthers | 4,483 | 54.93 | $33,296.00 | ||||
| Progressive Conservative | Lloyd J. McKinney | 3,356 | 41.12 | $24,113.55 | ||||
| Green | Tamela Friesen | 199 | 2.44 | $936.70 | ||||
| Liberal | Sisay Tessema | 124 | 1.52 | $0.00 | ||||
| Total valid votes | 8,162 | 100.00 | ||||||
| Rejected and declined ballots | 22 | 0.27 | ||||||
| Turnout | 8,184 | 62.09 | ||||||
| Electors on the lists | 13,181 | |||||||
| Source: Elections Manitoba[3] | ||||||||
Dauphin-Roblin (1999-2011)

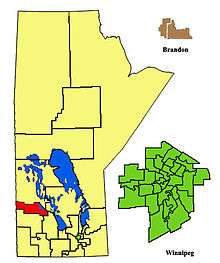
The 1998-2011 boundaries for Dauphin-Roblin highlighted in red
| 2007 Manitoba general election: Dauphin—Roblin | ||||||||
|---|---|---|---|---|---|---|---|---|
| Party | Candidate | Votes | % | ±% | Expenditures | |||
| New Democratic | Stan Struthers | 4,214 | 53.64 | −0.63 | $18.341.99 | |||
| Progressive Conservative | Lloyd McKinney | 3,257 | 41.46 | +6.33 | $13,909.20 | |||
| Liberal | Yarko Petryshyn | 385 | 4.84 | −3.21 | $340.29 | |||
| Total valid votes | 7,856 | 100.00 | ||||||
| Rejected and declined ballots | 21 | |||||||
| Turnout | 7,877 | 60.49 | ||||||
| Electors on the lists | 13,021 | |||||||
| 2003 Manitoba general election: Dauphin—Roblin | ||||||||
|---|---|---|---|---|---|---|---|---|
| Party | Candidate | Votes | % | ±% | Expenditures | |||
| New Democratic | Stan Struthers | 4,602 | 54.27 | −1.17 | $19,591.59 | |||
| Progressive Conservative | Bill Griffin | 2,979 | 35.13 | −4.51 | $21,020.48 | |||
| Liberal | Joelle Robinson | 683 | 8.05 | 8.05 | $5,877.85 | |||
| Green | Larry Powell | 216 | 2.55 | 2.55 | $84.49 | |||
| Total valid votes | 8,480 | 100.00 | ||||||
| Rejected and declined ballots | 29 | |||||||
| Turnout | 8,509 | 62.22 | ||||||
| Electors on the lists | 13,675 | |||||||
| 1999 Manitoba general election: Dauphin—Roblin | ||||||||
|---|---|---|---|---|---|---|---|---|
| Party | Candidate | Votes | % | ±% | Expenditures | |||
| New Democratic | Stan Struthers | 5,596 | 55.44 | $27,418.00 | ||||
| Progressive Conservative | Lorne Boguski | 4,001 | 39.64 | $31,178.48 | ||||
| Manitoba | Doug McPhee | 455 | 4.51 | $2,427.16 | ||||
| Total valid votes | 7,814 | 100.00 | ||||||
| Rejected and declined ballots | 42 | |||||||
| Turnout | 10,094 | 72.54 | ||||||
| Electors on the lists | 13,916 | |||||||
References
- "Candidates: 41st General Election". Elections Manitoba. 29 March 2016. Retrieved 31 March 2016.
- "Election Returns: 41st General Election". Elections Manitoba. 2016. Retrieved 12 September 2018.
- "Election Returns: 40th General Election". Elections Manitoba. 2011. Retrieved 12 September 2018.
- http://www.elections.mb.ca/en/Results/39_division_results/39_dauphin-roblin_summary_results.html Archived 2011-10-07 at the Wayback Machine - 2007 Results
- http://www.electionsmanitoba.ca/apps/results/37gen/pbp.asp?ED=9 Archived 2011-07-17 at the Wayback Machine - 1999 Results
This article is issued from Wikipedia. The text is licensed under Creative Commons - Attribution - Sharealike. Additional terms may apply for the media files.