Flin Flon (electoral district)
Flin Flon is a provincial electoral division in the Canadian province of Manitoba. It was created by redistribution in 1957, and has formally existed since the provincial election of 1958.
 | |||
| Provincial electoral district | |||
| Legislature | Legislative Assembly of Manitoba | ||
| MLA |
New Democratic | ||
| District created | 1958 | ||
| First contested | 1958 | ||
| Last contested | 2016 | ||
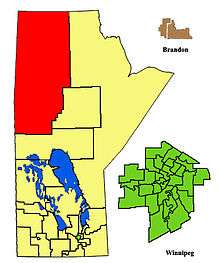
At about 80,000 square kilometers, Flin Flon occupies roughly 20% of Manitoba's total area, and is the second largest riding in the province after Rupertsland. It was a smaller riding before 1989, when it gained a significant amount of territory from the former riding of Churchill. It is a mostly rural and sparsely populated riding, located in the province's northwestern corner.
Flin Flon is bordered by Saskatchewan to the west, Nunavut to the north, the ridings of Rupertsland and Thompson to the east, and the riding of The Pas to the south. The actual city of Flin Flon is located in the southwestern corner of the riding, and is its only urban centre.
The riding's population in 1996 was 14,470. In 1999, the average family income was $55,113, and the unemployment rate was 9.70%. Manufacturing accounts for 17% of Flin Flon's economy, followed by mining and oil production at 16%.
73.4% of Flin Flon's residents are aboriginal.[1]
Flin Flon has been held by the New Democratic Party of Manitoba (NDP) since 1969. The current MLA is Tom Lindsey, who was elected in the provincial election of 2016. He replaced the incumbent, Clarence Pettersen who was de-selected by the NDP and decided to contest the election as an Independent.[2]
List of provincial representatives
| Assembly | Years | Member | Party | |
|---|---|---|---|---|
| Riding created from The Pas | ||||
| 25th | 1958-1959 | Francis Bud Jobin | Liberal-Progressive | |
| 26th | 1959-1962 | Charles Witney | Progressive Conservative | |
| 27th | 1962-1966 | |||
| 28th | 1966-1969 | |||
| 29th | 1969-1973 | Thomas Barrow | New Democratic | |
| 30th | 1973-1977 | |||
| 31st | 1977-1981 | |||
| 32nd | 1982-1985 | Jerry Storie | ||
| 33rd | 1985-1988 | |||
| 34th | 1988-1990 | |||
| 35th | 1990-1995 | |||
| 36th | 1995-1999 | Gerard Jennissen | ||
| 37th | 1999-2003 | |||
| 38th | 2003-2007 | |||
| 39th | 2007-2011 | |||
| 40th | 2011-2016 | Clarence Pettersen | ||
| 41st | 2016–2019 | Tom Lindsey | ||
| 42nd | 2019–present | |||
Electoral results
2019 Manitoba general election
| 2019 Manitoba general election | ||||||||
|---|---|---|---|---|---|---|---|---|
| Party | Candidate | Votes | % | ±% | Expenditures | |||
| New Democratic | Tom Lindsey | 2,435 | 57.8% | +24.95 | ||||
| Progressive Conservative | Theresa Wride | 1,294 | 30.7% | +2.37 | ||||
| Liberal | James Lindsay | 279 | 6.6% | -21.56 | ||||
| Green | Saara Murnick | 203 | 4.8% | -- | ||||
| Total valid votes | 100.0 | |||||||
| Total rejected ballots | ||||||||
| Turnout | ||||||||
| Eligible voters | ||||||||
2016 Manitoba general election
| 2016 Manitoba general election | ||||||||
|---|---|---|---|---|---|---|---|---|
| Party | Candidate | Votes | % | ±% | Expenditures | |||
| New Democratic | Tom Lindsey | 1,106 | 32.85 | –23.99 | $43,604.96 | |||
| Progressive Conservative | Angela Enright | 954 | 28.33 | +4.36 | $18,686.00 | |||
| Liberal | Leslie Joan Beck | 948 | 28.16 | +12.82 | $19,946.62 | |||
| Independent | Clarence Pettersen | 359 | 10.66 | –46.18 | $6,320.44 | |||
| Total valid votes | 3,367 | 100.0 | ||||||
| Total rejected and declined ballots | 36 | 1.06 | ||||||
| Turnout | 3,403 | 34.44 | ||||||
| Eligible voters | 9,880 | |||||||
| New Democratic hold | Swing | –14.18 | ||||||
| Source: Elections Manitoba[3][4] | ||||||||
2011 Manitoba general election
| 2011 Manitoba general election | ||||||||
|---|---|---|---|---|---|---|---|---|
| Party | Candidate | Votes | % | ±% | Expenditures | |||
| New Democratic | Clarence Pettersen | 1,890 | 56.84 | −19.89 | $28,114.64 | |||
| Progressive Conservative | Darcy Linklater | 797 | 23.97 | - | $14,069.96 | |||
| Liberal | Thomas Heine | 510 | 15.34 | −6.74 | $10,115.06 | |||
| Green | Saara Harvie | 111 | 3.33 | - | $0.00 | |||
| Total valid votes | 3,308 | |||||||
| Rejected and declined votes | 17 | |||||||
| Turnout | 3,325 | 35.34 | −0.9 | |||||
| Electors on the lists | 9,409 | |||||||
2007 Manitoba general election
| 2007 Manitoba general election | ||||||||
|---|---|---|---|---|---|---|---|---|
| Party | Candidate | Votes | % | ±% | Expenditures | |||
| New Democratic | Gerard Jennissen | 2,255 | 76.73 | $10,879.75 | ||||
| Liberal | Gary Zamzow | 651 | 22.08 | – | $3,607.58 | |||
| Total valid votes | 2,915 | 98.88 | ||||||
| Rejected and declined votes | 33 | |||||||
| Turnout | 2,948 | 36.24 | ||||||
| Electors on the lists | 8,135 | |||||||
Source: Elections Manitoba. [5]
2003 Manitoba general election
| 2003 Manitoba general election | ||||||||
|---|---|---|---|---|---|---|---|---|
| Party | Candidate | Votes | % | ±% | Expenditures | |||
| New Democratic | Gerard Jennissen | 2,402 | 73.21 | +8.62 | $11,470.02 | |||
| Liberal | Gary Zamzow | 557 | 16.98 | – | $8,001.78 | |||
| Progressive Conservative | Lloyd McDonald | 322 | 9.81 | -19.39 | $210.08 | |||
| Total valid votes | ||||||||
| Rejected and declined votes | 19 | |||||||
| Turnout | 3,300 | 39.17 | ||||||
| Electors on the lists | 8,424 | |||||||
Source: Elections Manitoba.[6]
1999 Manitoba general election
| 1999 Manitoba general election | ||||||||
|---|---|---|---|---|---|---|---|---|
| Party | Candidate | Votes | % | ±% | Expenditures | |||
| New Democratic | Gerard Jennissen | 3,026 | 64.59 | $18,573.00 | ||||
| Progressive Conservative | Tom Therien | 1,368 | 29.20 | $22,044.17 | ||||
| Manitoba | Phillip Ng | 268 | 5.72 | $1,209.00 | ||||
| Total valid votes | 4,662 | 99.51 | ||||||
| Rejected and declined votes | 23 | |||||||
| Turnout | 4,685 | 51.45 | ||||||
| Electors on the lists | 9,106 | |||||||
Source: Elections Manitoba. [7]
Previous boundaries

References
- https://www.gov.mb.ca/mbs/reports/pubs/ped_profiles/2018b_2016/2018_flinflon.pdf
- The Reminder "Pettersen vying for re-election as an independent", 19 March 2016
- "Candidates: 41st General Election". Elections Manitoba. 29 March 2016. Retrieved 31 March 2016.
- "41st General Election Official Results" (PDF). Elections Manitoba. 2016. Retrieved 16 September 2016.
- http://www.electionsmanitoba.ca/en/Results/39_division_results/39_flinflon_summary_results.html - 2007 results
- http://www.electionsmanitoba.ca/downloads/PDF_Summary_GE2003.pdf
- http://www.electionsmanitoba.ca/apps/results/37gen/pbp.asp?ED=12 - 1999 results