St. James (provincial electoral district)
St. James is a provincial electoral division in the Canadian province of Manitoba.
 | |||
| Provincial electoral district | |||
| Legislature | Legislative Assembly of Manitoba | ||
| MLA |
New Democratic | ||
| District created | 1957 | ||
| First contested | 1958 | ||
| Last contested | 2016 | ||
| Demographics | |||
| Census subdivisions | Winnipeg | ||
Historical riding
The original St. James riding was established at the province's creation in 1870, and lasted until the election of 1879. It was located in what was then a separate community on Winnipeg's periphery.
List of provincial representatives
| Name | Party | Took Office | Left Office |
|---|---|---|---|
| Edwin Bourke | Canadian Party/Opposition | 1870 | 1874 |
| Independent | 1874 | 1878 | |
| David Walker | Government/Conservative | 1878 | 1879 |
Modern riding
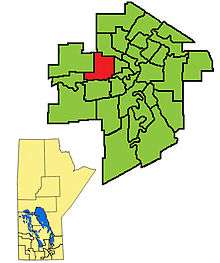
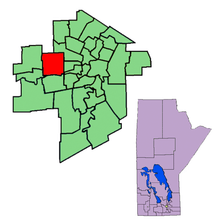
The modern St. James riding was created by redistribution in 1957 out of part of Assiniboia, and has formally existed since the provincial election of 1958. The riding is located in the western section of Winnipeg.
St. James is bordered on the east by Wellington, Minto and Wolseley, to the south by Tuxedo, to the north by Wellington and Lakeside, and to the west by Assiniboia and Kirkfield Park.
The riding's population in 1996 was 20,417. In 1999, the average family income was $47,842, and the unemployment rate was 6.20%. Almost 19% of St. James's population is over 65 years of age, and almost 38% of dwelling units are rented.
The service sector accounts for 15% of St. James's industry, following by government services (14%) and manufacturing (13%).
St. James was a marginal Progressive Conservative/NDP riding for most of its history to 1988. It was won in that year by Liberal Paul Edwards, who was elected leader of his party in 1993. The NDP recaptured the seat in 1995.
Recent boundary changes
The St. James riding underwent a dramatic redistribution in 1999. Previously, the riding occupied roughly the same space as the current riding of Minto. In fact, the original plan of the Manitoba Electoral Boundaries Commission in 1999 was to rename St. James as Minto, and create a new riding called King Edward to its immediate west (primarily from the old riding of Sturgeon Creek). Instead, the boundaries legislation passed by the Manitoba legislature in 1999 determined that the new riding would be called St. James.
Although the current riding has some territory in common with its predecessor of the same name, it is probably more accurately regarded as the successor riding to Sturgeon Creek. The NDP captured this seat from the Tories in 1999, and retained it in 2003.
List of provincial representatives
| Name | Party | Took Office | Left Office |
|---|---|---|---|
| Douglas Stanes | PC | 1958 | 1969 |
| Alvin Mackling | NDP | 1969 | 1973 |
| George Minaker | PC | 1973 | 1981 |
| Alvin Mackling | NDP | 1981 | 1988 |
| Paul Edwards | Lib | 1988 | 1995 |
| MaryAnn Mihychuk | NDP | 1995 | 1999 |
| Bonnie Korzeniowski | NDP | 1999 | 2011 |
| Deanne Crothers | NDP | 2011 | 2016 |
| Scott Johnston | PC | 2016 | 2019 |
| Adrien Sala | NDP | 2019 |
Electoral results
| 2019 Manitoba general election | ||||||||
|---|---|---|---|---|---|---|---|---|
| ** Preliminary results — Not yet official ** | ||||||||
| Party | Candidate | Votes | % | ±% | ||||
| New Democratic | Adrien Sala | 4,009 | 46.91 | +12.3 | ||||
| Progressive Conservative | Michelle Richards | 2,767 | 32.38 | -6.1 | ||||
| Liberal | Bernd Hohne | 965 | 11.29 | -2.5 | ||||
| Green | Jeff Buhse | 805 | 9.42 | -0.6 | ||||
| Total valid votes | 8,546 | 100.0 | ||||||
| Total rejected ballots | ||||||||
| Turnout | 57.2 | |||||||
| Eligible voters | ||||||||
| New Democratic gain from Progressive Conservative | Swing | +9.2 | ||||||
| 2016 provincial election redistributed results[1] | |||
|---|---|---|---|
| Party | % | ||
| Progressive Conservative | 38.5 | ||
| New Democratic | 34.6 | ||
| Liberal | 13.8 | ||
| Green | 10.0 | ||
| Others | 3.2 | ||
| 2016 Manitoba general election | ||||||||
|---|---|---|---|---|---|---|---|---|
| Party | Candidate | Votes | % | ±% | Expenditures | |||
| Progressive Conservative | Scott Johnston | 3,532 | 42.09 | +3.76 | $32,538.01 | |||
| New Democratic | Deanne Crothers | 2,723 | 32.45 | -17.31 | $38,621.27 | |||
| Liberal | Michelle Finley | 1,150 | 13.70 | +6.01 | $12,111.25 | |||
| Green | Jeff Buhse | 850 | 10.13 | +5.90 | $676.87 | |||
| Manitoba | Bradley Gross | 137 | 1.63 | – | $0.00 | |||
| Total valid votes | 8,392 | 98.97 | ||||||
| Total rejected ballots | 87 | 1.03 | +0.75 | |||||
| Turnout | 8,479 | 61.94 | -0.08 | |||||
| Eligible voters | 13,689 | |||||||
| Progressive Conservative gain from New Democratic | Swing | +10.53 | ||||||
| Source: Elections Manitoba[2][3][4] | ||||||||
| 2011 Manitoba general election | ||||||||
|---|---|---|---|---|---|---|---|---|
| Party | Candidate | Votes | % | ±% | Expenditures | |||
| New Democratic | Deanne Crothers | 4,432 | 49.61 | −6.04 | $25,563.25 | |||
| Progressive Conservative | Scott Gillingham | 3,414 | 38.21 | +7.38 | $31,468.19 | |||
| Liberal | Gerard Allard | 685 | 7.67 | −0.96 | $5,903.97 | |||
| Green | Trevor Vandale | 377 | 4.22 | – | $205.40 | |||
| Total valid votes | 8,908 | |||||||
| Rejected and declined ballots | 25 | |||||||
| Turnout | 8,933 | 62.02 | +2.82 | |||||
| Electors on the lists | 14,403 | |||||||
| 2007 Manitoba general election | ||||||||
|---|---|---|---|---|---|---|---|---|
| Party | Candidate | Votes | % | ±% | Expenditures | |||
| New Democratic | Bonnie Korzeniowski | 4,231 | 55.65 | +1.97 | $16,378.94 | |||
| Progressive Conservative | Kristine McGhee | 2,344 | 30.83 | -2.51 | $27,110.14 | |||
| Liberal | Fred Morris | 656 | 8.63 | -4.35 | $1,535.39 | |||
| Green | Mike Johannson | 339 | 4.47 | – | $0.00 | |||
| Total valid votes | 7,572 | 99.59 | ||||||
| Rejected and declined ballots | 31 | |||||||
| Turnout | 7,603 | 59.20 | ||||||
| Electors on the lists | 12,842 | |||||||
| 2003 Manitoba general election | ||||||||
|---|---|---|---|---|---|---|---|---|
| Party | Candidate | Votes | % | ±% | Expenditures | |||
| New Democratic | Bonnie Korzeniowski | 3,982 | 53.68 | +8.92 | $21,389.61 | |||
| Progressive Conservative | Cliff Allbutt | 2,473 | 33.34 | -5.05 | $15,753.00 | |||
| Liberal | Alana McKenzie | 963 | 12.98 | -3.25 | $33,210.99 | |||
| Source: Elections Manitoba[6][7] | ||||||||
| 1999 Manitoba general election | ||||||||
|---|---|---|---|---|---|---|---|---|
| Party | Candidate | Votes | % | ±% | Expenditures | |||
| New Democratic | Bonnie Korzeniowski | 4,483 | 44.76 | +14.06 | $27,649.00 | |||
| Progressive Conservative | Gerry McAlpine | 3,845 | 38.39 | +2.76 | $28,652.89 | |||
| Liberal | Wayne Helgason | 1,625 | 16.23 | -17.44 | $29,766.43 | |||
| Total valid votes | 9,953 | 100.00 | ||||||
| Rejected and declined ballots | 62 | |||||||
| Turnout | 10,015 | 72.01 | ||||||
| Electors on the lists | 13,098 | |||||||
| 1990 Manitoba general election: St. James | ||||||||
|---|---|---|---|---|---|---|---|---|
| Party | Candidate | Votes | % | ±% | ||||
| Liberal | Paul Edwards | 3,014 | 35.09 | -5.05 | ||||
| Progressive Conservative | Joanne Thibault | 2,719 | 31.66 | -2.58 | ||||
| New Democratic | Len Sawatsky | 2,586 | 30.11 | +7.98 | ||||
| Progressive | Charles Lamont | 148 | 1.72 | +0.97 | ||||
| Confederation of Regions | Fred Debrecen | 122 | 1.42 | -0.02 | ||||
| Total valid votes | 8,589 | 100.00 | - | |||||
| Rejected ballots | 22 | – | – | |||||
| Turnout | 8,611 | 73.37 | ||||||
| Eligible voters | 11,737 | |||||||
| Source: Elections Manitoba[9] | ||||||||
| 1988 Manitoba general election: St. James | ||||||||
|---|---|---|---|---|---|---|---|---|
| Party | Candidate | Votes | % | ±% | ||||
| Liberal | Paul Edwards | 3,939 | 40.14 | |||||
| Progressive Conservative | Jae Eadie | 3,360 | 34.24 | |||||
| New Democratic | Allan MacDonald | 2,171 | 22.13 | |||||
| Confederation of Regions | Fred Debrecen | 137 | 1.40 | |||||
| Progressive | Charles Lamont | 74 | 0.75 | |||||
| Libertarian | Dennis Rice | 69 | 0.70 | |||||
| Western Independence | Merle Hartlin | 62 | 0.63 | |||||
| Total valid votes | 9,812 | 100.00 | ||||||
| Rejected ballots | 29 | – | ||||||
| Turnout | 9,841 | 78.54 | ||||||
| Eligible voters | 12,530 | |||||||
| Source: Elections Manitoba[10] | ||||||||
Previous boundaries
References
- Marcoux, Jacques (2019-08-27). "New Manitoba election boundaries give upper hand to Progressive Conservatives, CBC News analysis finds". CBC. Retrieved 2019-09-15.
- "Candidates: 41st General Election". Elections Manitoba. 29 March 2016. Retrieved 31 March 2016.
- "41ST GENERAL ELECTION, APRIL 19, 2016 - OFFICIAL RESULTS". Elections Manitoba. 19 April 2016. Retrieved 12 November 2016.
- "Election Returns: 41st General Election". Elections Manitoba. 2016. Retrieved 6 September 2018.
- http://www.electionsmanitoba.ca/en/Results/39_division_results/39_stjames_summary_results.html - 2007 results
- "Election Returns: 38th General Election". Elections Manitoba. 2011. Retrieved 6 September 2018.
- http://www.elections.mb.ca/en/Results/38_division_results/38_st-james_summary_results.html
- http://www.electionsmanitoba.ca/apps/results/37gen/pbp.asp?ED=43 - 1999
- "Candidates: 35th General Election" (PDF). Elections Manitoba. September 11, 1990. Retrieved 30 September 2018.
- "Candidates: 34th General Election" (PDF). Elections Manitoba. April 26, 1988. Retrieved 30 September 2018.