Brandon West
Brandon West is a provincial electoral division in the Canadian province of Manitoba. It encompasses half of the City of Brandon, the other half being represented in Brandon East.
 | |||
| Provincial electoral district | |||
| Legislature | Legislative Assembly of Manitoba | ||
| MLA |
Progressive Conservative | ||
| District created | 1968 | ||
| First contested | 1969 | ||
| Last contested | 2019 | ||
| Demographics | |||
| Census subdivisions | Brandon | ||
Historical riding
The original riding of Brandon West existed from 1886 to 1888, after the City of Brandon was divided into two electoral divisions. It was eliminated in 1888, when the city became a single division again.
List of provincial representatives
| Name | Party | Took Office | Left Office |
|---|---|---|---|
| John Kirchhoffer | Cons | 1886 | 1888 |
Current riding
The modern riding of Brandon West was created in 1968, when the City of Brandon was again divided into two electoral districts. It was formally brought into being in the provincial election of 1969.
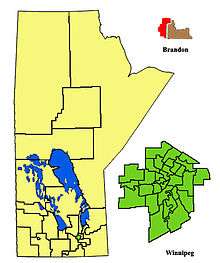
The riding is surrounded by Brandon East to the east and by Minnedosa in all other directions. The City of Brandon itself is located in the southwestern region of the province.
The riding's population in 1996 was 19,808. In 1999, the average family income was $56,860, and the unemployment rate was 6.30%. The service sector accounts for 16% of industry in the riding, followed by health and social services at 15%.
Brandon West includes the more economically advantaged section of Brandon, and usually elected Progressive Conservative members from 1969 to 1999. It was sometimes said that Brandon West voters elected Tories and Brandon East voters elected New Democrats to ensure that the city would have a member on the government side regardless of the provincial outcome.
Scott Smith of the New Democratic Party won the seat in 1999, and retained it with over 60% of the vote in 2003. However, he lost the seat to Progressive Conservative candidate Rick Borotsik by just 56 votes.
List of provincial representatives
| Name | Party | Took Office | Left Office |
|---|---|---|---|
| Edward McGill | PC | 1969 | 1981 |
| Henry Carroll | NDP | 1981 | 1982 |
| Independent | 1982 | 1986 | |
| James McCrae | PC | 1986 | 1999 |
| Scott Smith | NDP | 1999 | 2007 |
| Rick Borotsik | PC | 2007 | 2011 |
| Reg Helwer | PC | 2011 | present |
Electoral results
| 2019 Manitoba general election | ||||||||
|---|---|---|---|---|---|---|---|---|
| Party | Candidate | Votes | % | ±% | Expenditures | |||
| Progressive Conservative | Reg Helwer | 4,311 | 57.9 | -11.19 | $20,202.15 | |||
| New Democratic | Nick Brown | 1757 | 23.6 | +0.46 | $1,132.68 | |||
| Green | Robert Brown | 748 | 10.05 | – | $33.24 | |||
| Liberal | Sunday Frangi | 567 | 7.61 | -0.14 | $541.53 | |||
| Total valid votes/Expense Limit | 7,446 | 100.0 | – | $47,973 | ||||
| Source: Elections Manitoba[1][2][3] | ||||||||
| 2016 Manitoba general election | ||||||||
|---|---|---|---|---|---|---|---|---|
| Party | Candidate | Votes | % | ±% | Expenditures | |||
| Progressive Conservative | Reg Helwer | 5,624 | 69.09 | +20.43 | $33,113.21 | |||
| New Democratic | Linda Ross | 1,884 | 23.14 | -23.84 | $13,539.46 | |||
| Liberal | Billy Moore | 631 | 7.75 | +3.39 | $1,314.33 | |||
| Total valid votes/Expense limit | 8,139 | 100.0 | $ | |||||
| Eligible voters | – | |||||||
| Source: Elections Manitoba[4][5][6] | ||||||||
| 2011 Manitoba general election | ||||||||
|---|---|---|---|---|---|---|---|---|
| Party | Candidate | Votes | % | ±% | Expenditures | |||
| Progressive Conservative | Reg Helwer | 4,219 | 48.66 | +0.62 | $29,570.60 | |||
| New Democratic | Jim Murray | 4,073 | 46.98 | −0.50 | $24,888.84 | |||
| Liberal | George Buri | 378 | 4.36 | +0.32 | $7,641.08 | |||
| Total valid votes | 8,692 | 100.00 | ||||||
| Rejected and declined ballots | 41 | |||||||
| Turnout | 8,733 | 59.79 | −7.01 | |||||
| Electors on the lists | 14,607 | |||||||
| Source: Elections Manitoba[7] | ||||||||
| 2007 Manitoba general election | ||||||||
|---|---|---|---|---|---|---|---|---|
| Party | Candidate | Votes | % | ±% | Expenditures | |||
| Progressive Conservative | Rick Borotsik | 4,730 | 48.04 | +13.11 | $29,059.52 | |||
| New Democratic | Scott Smith | 4,674 | 47.48 | −13.54 | $27,506.06 | |||
| Liberal | Martha Jo Willard | 398 | 4.04 | −0.01 | $6,098.53 | |||
| Communist | Lisa Gallagher | 43 | 0.44 | |||||
| Total valid votes | 9,845 | 100.00 | ||||||
| Rejected and declined ballots | 39 | |||||||
| Turnout | 9,884 | 66.80 | +6.37 | |||||
| Electors on the lists | 14,796 | |||||||
| 2003 Manitoba general election | ||||||||
|---|---|---|---|---|---|---|---|---|
| Party | Candidate | Votes | % | ±% | Expenditures | |||
| New Democratic | Scott Smith | 5,210 | 61.02 | +11.76 | $20,721.62 | |||
| Progressive Conservative | Reg Atkinson | 2,982 | 34.93 | −10.79 | $15,828.88 | |||
| Liberal | Candace Sigurdson | 346 | 4.05 | −0.04 | $2,086.52 | |||
| Total valid votes | 8,538 | 100.00 | ||||||
| Rejected and declined ballots | 28 | |||||||
| Turnout | 8,566 | 60.43 | −12.70 | |||||
| Electors on the lists | 14,174 | |||||||
| 1999 Manitoba general election | ||||||||
|---|---|---|---|---|---|---|---|---|
| Party | Candidate | Votes | % | ±% | Expenditures | |||
| New Democratic | Scott Smith | 4,898 | 49.26 | $17,671.00 | ||||
| Progressive Conservative | James McCrae | 4,546 | 45.72 | $29,994.07 | ||||
| Liberal | Lisa Roy | 407 | 4.09 | – | $600.00 | |||
| Communist | Lisa Gallagher | 92 | 0.93 | $0.00 | ||||
| Total valid votes | 9,943 | 100.00 | ||||||
| Rejected and declined ballots | 75 | |||||||
| Turnout | 10,018 | 73.13 | ||||||
| Electors on the lists | 13,698 | |||||||
| 1995 Manitoba general election | ||||||||
|---|---|---|---|---|---|---|---|---|
| Party | Candidate | Votes | % | ±% | Expenditures | |||
| Progressive Conservative | James McCrae | 4,471 | 49.40 | |||||
| New Democratic | Derry Decter | 2,790 | 30.83 | |||||
| Liberal | Mark Barber | 1,789 | 19.78 | – | ||||
| Total valid votes | 9,050 | 100.00 | ||||||
| Rejected and declined ballots | 33 | |||||||
| Turnout | 9,083 | 67.75 | ||||||
| Electors on the lists | 13,407 | |||||||
References
- "Election Candidate And Registered Party Election Expense Limits - Final Expense Limit" (PDF). Elections Manitoba. Elections Manitoba. Retrieved 2 March 2020.
- "Summary of Votes Received: 42nd General Election" (PDF). Elections Manitoba. Elections Manitoba. Retrieved 2 March 2020.
- "Candidate Election Returns". Elections Manitoba. Elections Manitoba. Retrieved 2 March 2020.
- "Candidates: 41st General Election". Elections Manitoba. 29 March 2016. Retrieved 31 March 2016.
- "41ST GENERAL ELECTION, APRIL 19, 2016 - OFFICIAL RESULTS". Elections Manitoba. 19 April 2016. Retrieved 10 November 2016.
- "Election Returns: 41st General Election". Elections Manitoba. 2016. Retrieved 11 September 2018.
- "Election Returns: 40th General Election". Elections Manitoba. 2011. Retrieved 11 September 2018.
- "Home". Elections.mb.ca. 2013-02-21. Archived from the original on 2012-03-01. Retrieved 2013-12-04.
- "Home". Elections.mb.ca. 2013-02-21. Archived from the original on 2012-03-01. Retrieved 2013-12-04.
- "Home". Elections.mb.ca. 2013-02-21. Archived from the original on 2011-07-16. Retrieved 2013-12-04.