Logarithmic scale
A logarithmic scale (or log scale) is a way of displaying numerical data over a very wide range of values in a compact way—typically the largest numbers in the data are hundreds or even thousands of times larger than the smallest numbers. Such a scale is nonlinear: the numbers 10 and 20, and 60 and 70, are not the same distance apart on a log scale. Rather, the numbers 10 and 100, and 60 and 600 are equally spaced. Thus moving a set distance along the scale means the number has been multiplied by 10 (or some other fixed factor). Often exponential growth curves are displayed on a log scale, otherwise they would increase too quickly to fit within a small graph. Another way to think about it is that the number of digits of the data grows at a constant rate. The numbers 10, 100, 1000, and 10000 are equally spaced on a log scale, but the number of digits is going up by 1 each time: 2, 3, 4, and 5 digits. In this way, adding two digits multiplies the quantity measured on the log scale by a factor of 100.


Common uses
The markings on slide rules are arranged in a log scale for multiplying or dividing numbers by adding or subtracting lengths on the scales.

The following are examples of commonly used logarithmic scales, where a larger quantity results in a higher value:
- Richter magnitude scale and moment magnitude scale (MMS) for strength of earthquakes and movement in the Earth
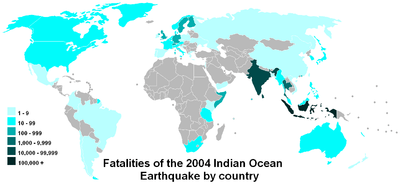 A logarithmic scale makes it easy to compare values that cover a large range, such as in this map.
 - Sound level, with units decibel
- Neper for amplitude, field and power quantities
- Frequency level, with units cent, minor second, major second, and octave for the relative pitch of notes in music
- Logit for odds in statistics
- Palermo Technical Impact Hazard Scale
- Logarithmic timeline
- Counting f-stops for ratios of photographic exposure
- The rule of 'nines' used for rating low probabilities
- Entropy in thermodynamics
- Information in information theory
- Particle size distribution curves of soil
The following are examples of commonly used logarithmic scales, where a larger quantity results in a lower (or negative) value:
- pH for acidity
- Stellar magnitude scale for brightness of stars
- Krumbein scale for particle size in geology
- Absorbance of light by transparent samples
Some of our senses operate in a logarithmic fashion (Weber–Fechner law), which makes logarithmic scales for these input quantities especially appropriate. In particular our sense of hearing perceives equal ratios of frequencies as equal differences in pitch. In addition, studies of young children in an isolated tribe have shown logarithmic scales to be the most natural display of numbers in some cultures.[1] It can also be used for geographical purposes, for instance for measuring the speed of earthquakes.
Graphic representation
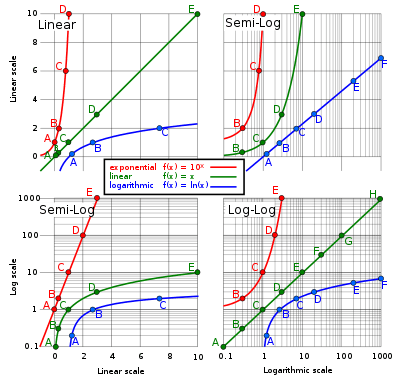
The top left graph is linear in the X and Y axes, and the Y-axis ranges from 0 to 10. A base-10 log scale is used for the Y axis of the bottom left graph, and the Y axis ranges from 0.1 to 1,000.
The top right graph uses a log-10 scale for just the X axis, and the bottom right graph uses a log-10 scale for both the X axis and the Y axis.
Presentation of data on a logarithmic scale can be helpful when the data:
- covers a large range of values, since the use of the logarithms of the values rather than the actual values reduces a wide range to a more manageable size;
- may contain exponential laws or power laws, since these will show up as straight lines.
A slide rule has logarithmic scales, and nomograms often employ logarithmic scales. The geometric mean of two numbers is midway between the numbers. Before the advent of computer graphics, logarithmic graph paper was a commonly used scientific tool.
Log–log plots
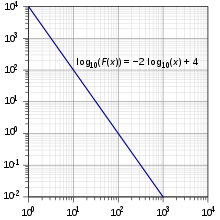
If both the vertical and horizontal axes of a plot are scaled logarithmically, the plot is referred to as a log–log plot.
Logarithmic units
A logarithmic unit is a unit that can be used to express a quantity (physical or mathematical) on a logarithmic scale, that is, as being proportional to the value of a logarithm function applied to the ratio of the quantity and a reference quantity of the same type. The choice of unit generally indicates the type of quantity and the base of the logarithm.
Examples
Examples of logarithmic units include units of data storage capacity (bit, byte), of information and information entropy (nat, shannon, ban), signal level (decibel, bel, neper). Logarithmic frequency quantities are used in electronics (decade, octave) and for music pitch intervals (octave, semitone, cent, etc.). Other logarithmic scale units include the Richter magnitude scale point.
In addition, several industrial measures are logarithmic, such as standard values for resistors, the American wire gauge, the Birmingham_gauge used for wire and needles, and so on.
Table of examples
| Unit | Base of logarithm | Underlying quantity | Interpretation |
|---|---|---|---|
| bit | 2 | number of possible messages | quantity of information |
| byte | 28 = 256 | number of possible messages | quantity of information |
| decibel | 10(1/10) ≈ 1.259 | any power quantity (sound power, for example) | sound power level (for example) |
| decibel | 10(1/20) ≈ 1.122 | any root-power quantity (sound pressure, for example) | sound pressure level (for example) |
| semitone | 2(1/12) ≈ 1.059 | frequency of sound | pitch interval |
The two definitions of a decibel are equivalent, because a ratio of power quantities is equal to the square of the corresponding ratio of root-power quantities.
Motivation
The motivation behind the concept of logarithmic units is that defining a quantity on a logarithmic scale in terms of a logarithm to a specific base amounts to making a (totally arbitrary) choice of a unit of measurement for that quantity, one that corresponds to the specific (and equally arbitrary) logarithm base that was selected. Due to the identity

the logarithms of any given number a to two different bases (here b and c) differ only by the constant factor logc b. This constant factor can be considered to represent the conversion factor for converting a numerical representation of the pure (indefinite) logarithmic quantity Log(a) from one arbitrary unit of measurement (the [log c] unit) to another (the [log b] unit), since

For example, Boltzmann's standard definition of entropy S = k ln W (where W is the number of ways of arranging a system and k is Boltzmann's constant) can also be written more simply as just S = Log(W), where "Log" here denotes the indefinite logarithm, and we let k = [log e]; that is, we identify the physical entropy unit k with the mathematical unit [log e]. This identity works because

Thus, we can interpret Boltzmann's constant as being simply the expression (in terms of more standard physical units) of the abstract logarithmic unit [log e] that is needed to convert the dimensionless pure-number quantity ln W (which uses an arbitrary choice of base, namely e) to the more fundamental pure logarithmic quantity Log(W), which implies no particular choice of base, and thus no particular choice of physical unit for measuring entropy.
See also
- Alexander Graham Bell
- Bode plot
- John Napier
- Level (logarithmic quantity)
- Logarithm
- Logarithmic mean
- Log semiring
- Preferred number
Scale
Applications
References
- "Slide Rule Sense: Amazonian Indigenous Culture Demonstrates Universal Mapping Of Number Onto Space". ScienceDaily. 2008-05-30. Retrieved 2008-05-31.
Further reading
- Dehaene, Stanislas; Izard, Véronique; Spelke, Elizabeth; Pica, Pierre (2008). "Log or linear? Distinct intuitions of the number scale in Western and Amazonian indigene cultures". Science. 320 (5880): 1217–20. Bibcode:2008Sci...320.1217D. doi:10.1126/science.1156540. PMC 2610411. PMID 18511690.
- Tuffentsammer, Karl; Schumacher, P. (1953). "Normzahlen – die einstellige Logarithmentafel des Ingenieurs" [Preferred numbers - the engineer's single-digit logarithm table]. Werkstattechnik und Maschinenbau (in German). 43 (4): 156.
- Tuffentsammer, Karl (1956). "Das Dezilog, eine Brücke zwischen Logarithmen, Dezibel, Neper und Normzahlen" [The decilog, a bridge between logarithms, decibel, neper and preferred numbers]. VDI-Zeitschrift (in German). 98: 267–274.
- Ries, Clemens (1962). Normung nach Normzahlen [Standardization by preferred numbers] (in German) (1 ed.). Berlin, Germany: Duncker & Humblot Verlag. ISBN 978-3-42801242-8. (135 pages)
- Paulin, Eugen (2007-09-01). Logarithmen, Normzahlen, Dezibel, Neper, Phon - natürlich verwandt! [Logarithms, preferred numbers, decibel, neper, phon - naturally related!] (PDF) (in German). Archived (PDF) from the original on 2016-12-18. Retrieved 2016-12-18.
External links
| Wikimedia Commons has media related to Logarithmic scale. |
- "GNU Emacs Calc Manual: Logarithmic Units". Gnu.org. Retrieved 2016-11-23.
- Non-Newtonian calculus website