Ontario Peninsula
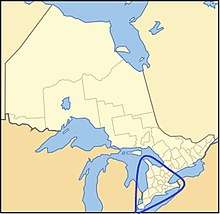
The Ontario Peninsula is a peninsula and salient in Canada that comprises part of Southern Ontario, specifically Southwestern Ontario and most of the Golden Horseshoe. It includes Bruce Peninsula and Niagara Peninsula. It is connected to Central Ontario to the east and is surrounded on other sides by Georgian Bay, Lake Huron, St. Clair River, Lake St. Clair, Detroit River, Lake Erie, Niagara River, and Lake Ontario. While many of Southern Ontario's most populous cities, including Toronto, Canada's most populous city,[1] Hamilton, and Mississauga, are in its eastern part, its western part also has some large cities, like London and Windsor.
Simcoe County, York Region, and the City of Toronto form the neck of the Ontario Peninsula, though some definitions of the Ontario peninsula include Durham Region to the east.
Climate
Like other parts of southern Canada, the Ontario Peninsula enjoys warm or hot summers with normal thunderstorm activity, including severe thunderstorms that can have hail, damaging winds, and even tornadoes during peak season. It has cold winters, snowfall can be abundant, particularly in the affected snowbelt locations but there are many winter thaw periods breaking entrenched cold. The Ontario Peninsula has a humid continental climate, specifically, the majority of it falls into the Köppen climate classification Dfb, except for Essex County, Ontario, parts of the Greater Toronto and Hamilton Area and the Niagara Peninsula are within the Dfa zone, but the entire peninsula is near the Dfa/Dfb borderline.
History
Southern Ontario was colonized by France in the 1600s, but the British gained control of Ontario after the Seven Years' War.
The Ontario Peninsula experienced much of the fighting during the War of 1812,[2] including Americans invading it and burning York (now called Toronto). After the war, population and trade boomed, and the Welland Canal was built.
When the British divided Canada into separate provinces, Toronto became the capital of Ontario. It eventually became Canada's main economic centre.
Most populous entities
By each definition, Toronto or its corresponding entity is the most populous not only in the Ontario Peninsula but in Canada as a whole.
Most populous metropolitan areas
| Rank (2016) |
Rank (2011) |
Geographic name | Type | Population (2016) |
Population (2011) |
Change |
|---|---|---|---|---|---|---|
| 1 | 1 | Toronto (Mississauga, Brampton, Markham, Vaughan) | CMA | 5,928,040 | 5,583,064 | +6.18% |
| 2 | 2 | Hamilton (Burlington) | CMA | 747,545 | 721,053 | +3.67% |
| 3 | 3 | Kitchener–Waterloo-Cambridge | CMA | 523,894 | 496,383 | +5.54% |
| 4 | 4 | London | CMA | 494,069 | 474,786 | +4.06% |
| 5 | 5 | St. Catharines - Niagara (Niagara Falls, Welland) | CMA | 406,074 | 392,184 | +3.54% |
| 6 | 6 | Oshawa (Whitby, Clarington) | CMA | 379,848 | 356,177 | +6.65% |
| 7 | 7 | Windsor (Lakeshore) | CMA | 329,144 | 319,246 | +3.10% |
| 8 | 8 | Barrie (Innisfil) | CMA | 197,059 | 187,013 | +5.37% |
| 9 | 9 | Brantford (Brant) | CMA | 134,203 | 135,501 | −0.96% |
| 10 | 10 | Chatham-Kent | CA | 102,042 | 104,075 | −1.95% |
| 11 | 11 | Sarnia (St. Clair) | CA | 96,151 | 97,131 | −1.01% |
| 12 | 12 | Norfolk | CA | 64,044 | 63,175 | +1.38% |
| 13 | 13 | Leamington (Kingsville) | CA | 49,147 | 49,765 | −1.24% |
| 14 | 14 | Woodstock | CA | 40,902 | 37,754 | +8.34% |
| 15 | 15 | Midland (Tay, Penetanguishene) | CA | 35,859 | 35,419 | +1.24% |
| 16 | 16 | Owen Sound (Georgian Bluffs) | CA | 31,820 | 32,092 | −0.85% |
| 17 | 17 | Stratford | CA | 31,465 | 30,903 | +1.82% |
| 18 | 18 | Centre Wellington | CA | 28,191 | 26,693 | +5.61% |
| 19 | 19 | Collingwood | CA | 21,793 | 19,241 | +13.26% |
| 20 | 20 | Wasaga Beach | CA | 20,675 | 17,537 | +17.89% |
| 21 | 21 | Tillsonburg | CA | 15,872 | 15,301 | +3.73% |
| 22 | 22 | Ingersoll | CA | 12,757 | 12,146 | +5.03% |
Most populous municipalities
| Rank (2016) |
Municipality | Municipal status | Land area (km2, 2011) |
Growth Rate
2011–2016 |
Population (2016) |
Population (2011) |
Population (2006) |
Population (2001) |
Population (1996) |
|---|---|---|---|---|---|---|---|---|---|
| 1 | Toronto | City | 630.2 | 4.46% | 2,731,571 | 2,615,060 | 2,503,281 | 2,481,494 | 2,385,421 |
| 2 | Mississauga | City | 292.4 | 1.14% | 721,599 | 713,443 | 668,549 | 612,925 | 544,382 |
| 3 | Brampton | City | 266.3 | 13.31% | 593,638 | 523,911 | 433,806 | 325,428 | 268,251 |
| 4 | Hamilton | City | 1,117.2 | 3.26% | 536,917 | 519,949 | 504,559 | 490,268 | 467,799 |
| 5 | London | City | 420.6 | 4.83% | 383,822 | 366,151 | 352,395 | 336,539 | 325,669 |
| 6 | Markham | City | 212.6 | 9.03% | 328,966 | 301,709 | 261,573 | 208,615 | 173,383 |
| 7 | Vaughan | City | 273.5 | 6.22% | 306,233 | 288,301 | 238,866 | 182,022 | 132,549 |
| 8 | Kitchener | City | 136.8 | 6.42% | 233,222 | 219,153 | 204,668 | 190,399 | 178,420 |
| 9 | Windsor | City | 146.3 | 2.99% | 217,188 | 210,891 | 216,473 | 209,218 | 197,694 |
| 10 | Richmond Hill | Town | 101.0 | 5.11% | 195,022 | 185,541 | 162,704 | 132,030 | 101,725 |
| 11 | Oakville | Town | 138.9 | 6.20% | 193,832 | 182,520 | 165,613 | 144,738 | 128,405 |
| 12 | Burlington | City | 185.7 | 4.29% | 183,314 | 175,779 | 164,415 | 150,836 | 136,976 |
| 13 | Oshawa | City | 145.68 | 6.6% | 159,458 | 149,607 | 141,590 | 139,051 | 134,364 |
| 14 | Barrie | City | 77.4 | 4.22% | 141,434 | 135,711 | 128,430 | 103,710 | 79,191 |
| 15 | St. Catharines | City | 96.1 | 1.30% | 133,113 | 131,400 | 131,989 | 129,170 | 130,926 |
| 16 | Guelph | City | 87.2 | 8.30% | 131,794 | 121,688 | 114,943 | 106,170 | 95,821 |
| 17 | Cambridge | City | 113.0 | 2.50% | 129,920 | 126,748 | 120,371 | 110,372 | 101,429 |
| 18 | Whitby | Town | 146.53 | 5.2% | 128,377 | 122,022 | 111,184 | 87,413 | 73,794 |
| 19 | Ajax | Town | 67.1 | 9.19% | 119,677 | 109,600 | 90,167 | 73,753 | 64,430 |
| 20 | Milton | Town | 363.2 | 30.54% | 110,128 | 84,362 | 53,939 | 31,471 | 32,104 |
| 21 | Waterloo | City | 64.0 | 6.28% | 104,986 | 98,780 | 97,475 | 86,543 | 77,949 |
| 22 | Chatham-Kent | Municipality | 2,458.1 | -1.95% | 101,647 | 103,671 | 108,177 | 107,341 | 109,950 |
| 23 | Brantford | City | 72.5 | 4.11% | 97,496 | 93,650 | 90,192 | 86,417 | 86,417 |
| 24 | Pickering | City | 231.6 | 3.44% | 91,771 | 88,721 | 87,838 | 87,139 | 78,989 |
| 25 | Niagara Falls | City | 209.7 | 6.11% | 88,071 | 82,997 | 82,184 | 78,815 | 76,917 |
| 26 | Newmarket | Town | 38.3 | 5.31% | 84,224 | 79,978 | 74,295 | 65,788 | 57,125 |
| 27 | Sarnia | City | 164.7 | -1.07% | 71,594 | 72,366 | 71,419 | 70,876 | 72,738 |
| 28 | Caledon | Town | 688.2 | 11.84% | 66,502 | 59,460 | 57,050 | 50,605 | 39,893 |
| 29 | Norfolk County | City | 1,607.6 | 1.38% | 64,044 | 63,175 | 62,563 | 60,847 | 60,534 |
| 30 | Halton Hills | Town | 276.3 | 3.64% | 61,161 | 59,013 | 55,289 | 48,184 | 42,390 |
| 31 | Aurora | Town | 49.8 | 4.21% | 55,445 | 53,203 | 47,629 | 40,167 | 34,857 |
| 32 | Welland | City | 81.1 | 3.28% | 52,293 | 50,631 | 50,331 | 48,402 | 48,411 |
Most populous population centres
| Rank | Population centre | Size group | Population in 2016 | Population in 2011 |
|---|---|---|---|---|
| 1 | Toronto | Large urban | 5,429,524 | 5,144,412 |
| 2 | Hamilton | Large urban | 693,645 | 671,008 |
| 3 | Waterloo | Large urban | 470,015 | 446,295 |
| 4 | London | Large urban | 383,437 | 365,715 |
| 5 | Windsor | Large urban | 287,069 | 277,970 |
| 6 | St. Catharines–Niagara | Large urban | 229,246 | 220,616 |
| 7 | Barrie | Large urban | 145,614 | 140,383 |
| 8 | Guelph | Large urban | 132,397 | 122,457 |
| 9 | Milton | Large urban | 101,715 | 75,880 |
| 10 | Brantford | Medium | 98,179 | 94,269 |
| 11 | Sarnia | Medium | 72,125 | 73,044 |
| 12 | Welland–Pelham | Medium | 62,388 | 60,540 |
| 13 | Chatham | Medium | 43,550 | 44,676 |
| 14 | Georgetown | Medium | 42,123 | 40,185 |
| 15 | St. Thomas | Medium | 41,813 | 40,973 |
| 16 | Woodstock | Medium | 40,404 | 37,443 |
| 17 | Leamington | Medium | 32,991 | 32,520 |
| 18 | Stouffville | Small | 32,634 | 24,654 |
| 19 | Stratford | Medium | 31,053 | 30,516 |
| 20 | Orangeville | Medium | 30,734 | 29,007 |
| 21 | Bradford | Small | 29,862 | 23,024 |
| 22 | Keswick–Elmhurst Beach | Small | 26,757 | 26,002 |
| 23 | Bolton | Small | 26,378 | 27,108 |
| 24 | Midland | Medium | 24,353 | 23,791 |
| 25 | Innisfil | Small | 23,992 | 20,365 |
| 26 | Owen Sound | Small | 22,032 | 22,354 |
| 27 | Fergus | Small | 20,767 | 19,335 |
| 28 | Collingwood | Small | 20,102 | 17,986 |
| 29 | Alliston | Small | 18,809 | 15,343 |
| 30 | Wasaga Beach | Small | 17,808 | 15,378 |
| 31 | Tillsonburg | Small | 15,594 | 14,933 |
| 32 | Port Colborne | Small | 15,037 | 15,079 |
| 33 | Fort Erie | Small | 14,621 | 14,490 |
| 34 | Strathroy | Small | 14,401 | 14,391 |
| 35 | Simcoe | Small | 13,922 | 13,383 |
| 36 | Amherstburg | Small | 13,910 | 13,724 |
| 37 | New Hamburg | Small | 13,595 | 11,709 |
| 38 | Angus–Borden CFB-BFC | Small | 12,640 | 10,132 |
| 39 | Ingersoll | Small | 12,587 | 11,977 |
| 40 | Paris | Small | 12,310 | 11,722 |
| 41 | Beamsville | Small | 11,834 | 10,655 |
| 42 | Elmira | Small | 10,161 | 9,677 |
| 43 | Wallaceburg | Small | 10,098 | 10,127 |
| 44 | Caledonia | Small | 9,674 | 9,871 |
| 45 | Acton | Small | 9,462 | 9,506 |
| 46 | Binbrook | Small | 8,794 | 4,926 |
| 47 | Crystal Beach | Small | 8,524 | 8,059 |
| 48 | Kincardine | Small | 8,315 | 7,802 |
| 49 | Shelburne | Small | 8,126 | 5,841 |
| 50 | Port Elgin | Small | 7,862 | 7,304 |
| 51 | Aylmer | Small | 7,621 | 7,249 |
| 52 | Goderich | Small | 7,536 | 7,327 |
| 53 | Sutton | Small | 7,531 | 6,694 |
| 54 | Listowel | Small | 7,530 | 6,828 |
| 55 | Essex | Small | 7,446 | 7,127 |
| 56 | Hanover | Small | 7,413 | 7,240 |
| 57 | King | Small | 6,970 | 4,603 |
| 58 | St. Marys | Small | 6,951 | 6,373 |
| 59 | Port Dover | Small | 6,161 | 5,710 |
| 59 | Dunnville | Small | 5,759 | 5,267 |
| 61 | Corunna | Small | 5,686 | 5,892 |
| 62 | Chippawa | Small | 5,620 | 5,246 |
| 63 | Smithville | Small | 5,489 | 4,842 |
| 64 | Tay | Small | 5,408 | 5,217 |
| 65 | Petrolia | Small | 5,375 | 5,144 |
| 66 | Tottenham | Small | 5,143 | 4,720 |
| 67 | Mount Albert | Small | 4,925 | 4,044 |
| 68 | Meaford | Small | 4,910 | 4,860 |
| 69 | Tilbury | Small | 4,768 | 4,675 |
| 70 | Mississauga Beach | Small | 4,662 | 4,349 |
| 71 | Exeter | Small | 4,649 | 4,210 |
| 72 | Mount Forest | Small | 4,643 | 4,466 |
| 73 | Rockwood | Small | 4,629 | 4,290 |
| 74 | Nobleton | Small | 4,614 | 2,554 |
| 75 | Mitchell | Small | 4,573 | 4,257 |
| 76 | Walkerton | Small | 4,517 | 4,403 |
| 77 | Blenheim | Small | 4,344 | 4,595 |
| 78 | Caledon East | Small | 4,282 | 2,706 |
| 79 | Delhi | Small | 4,240 | 4,172 |
| 80 | Ayr | Small | 4,171 | 3,909 |
| 81 | Vineland | Small | 4,074 | 3,807 |
| 82 | Stayner | Small | 4,029 | 3,844 |
| 83 | Dorchester | Small | 3,911 | 4,003 |
| 84 | Beeton | Small | 3,730 | 3,730 |
| 85 | Southampton | Small | 3,678 | 3,382 |
| 86 | St. George | Small | 3,255 | 3,124 |
| 87 | Wellesley | Small | 3,246 | 2,929 |
| 88 | Ballantrae | Small | 3,223 | 2,994 |
| 89 | Waterford | Small | 3,132 | 3,027 |
| 90 | Clinton | Small | 3,049 | 2,979 |
| 91 | Ridgetown | Small | 3,002 | 2,986 |
| 92 | Tavistock | Small | 2,955 | 2,784 |
| 93 | Hagersville | Small | 2,939 | 2,579 |
| 94 | Virgil | Small | 2,937 | 2,734 |
| 95 | Wingham | Small | 2,934 | 2,875 |
| 96 | Wheatley | Small | 2,898 | 2,934 |
| 97 | Norwich | Small | 2,852 | 2,707 |
| 98 | Harrow | Small | 2,710 | 2,713 |
| 99 | Schomberg | Small | 2,691 | 2,321 |
| 100 | Grand Bend | Small | 2,684 | 2,564 |
| 101 | Seaforth | Small | 2,680 | 2,627 |
| 102 | Erin | Small | 2,647 | 2,523 |
| 103 | Palmerston | Small | 2,624 | 2,599 |
| 104 | Durham | Small | 2,609 | 2,635 |
| 105 | Lucan | Small | 2,541 | 2,014 |
| 106 | Thornbury | Small | 2,485 | 2,363 |
| 107 | Dresden | Small | 2,451 | 2,385 |
| 108 | Wyoming | Small | 2,361 | 2,248 |
| 109 | Arthur | Small | 2,333 | 2,314 |
| 110 | Elmvale | Small | 2,314 | 2,248 |
| 111 | Forest | Small | 2,277 | 2,389 |
| 112 | Colchester | Small | 2,229 | 2,104 |
| 113 | Port Stanley | Small | 2,148 | 2,270 |
| 114 | Glencoe | Small | 2,126 | 2,065 |
| 115 | Thamesford | Small | 2,116 | 1,953 |
| 116 | Drayton | Small | 2,111 | 1,775 |
| 117 | Dundalk | Small | 2,046 | 1,988 |
| 118 | Wiarton | Small | 1,989 | 2,034 |
| 119 | St. Jacobs | Small | 1,988 | 1,891 |
| 120 | Carlisle | Small | 1,869 | 1,879 |
| 121 | McGregor | Small | 1,859 | 1,474 |
| 122 | Ilderton | Small | 1,856 | 1,700 |
| 123 | Chesley | Small | 1,843 | 1,895 |
| 124 | Mount Brydges | Small | 1,842 | 1,834 |
| 125 | Harriston | Small | 1,797 | 1,700 |
| 126 | Parkhill | Small | 1,737 | 1,853 |
| 127 | Cayuga | Small | 1,713 | 1,622 |
| 128 | Oro Station–Hawkestone | Small | 1,691 | 1,682 |
| 129 | Everett | Small | 1,670 | 1,645 |
| 130 | Grand Valley | Small | 1,643 | 1,476 |
| 131 | Milverton | Small | 1,576 | 1,476 |
| 132 | Watford | Small | 1,536 | 1,491 |
| 133 | Caledon | Small | 1,482 | 1,572 |
| 134 | Dutton | Small | 1,368 | 1,300 |
| 135 | Plattsville | Small | 1,366 | 1,143 |
| 136 | West Lorne | Small | 1,337 | 1,415 |
| 137 | Mildmay | Small | 1,219 | 1,178 |
| 138 | Markdale | Small | 1,216 | 1,175 |
| 139 | Cookstown | Small | 1,214 | 975 |
| 140 | Claremont | Small | 1,202 | 1,175 |
| 141 | Stevensville | Small | 1,179 | 1,054 |
| 142 | Creemore | Small | 1,170 | 1,147 |
| 143 | Bourget | Small | 1,169 | 1,080 |
| 144 | Belmont | Small | 1,140 | 1,026 |
| 145 | Lucknow | Small | 1,121 | 1,095 |
| 146 | New Dundee | Small | 1,119 | 1,219 |
| 147 | Bayfield | Small | 1,112 | 951 |
| 148 | Port Rowan | Small | 1,102 | 1,069 |
| 149 | Stoney Point | Small | 1,087 | 1,146 |
| 150 | Paisley | Small | 1,045 | 998 |
| 151 | Palgrave | Small | 1,044 | 1,002 |
| 152 | Jarvis | Small | 1,037 | 913 |
References
- Canada, Government of Canada, Statistics. "Population and Dwelling Count Highlight Tables, 2016 Census". www12.statcan.gc.ca. Retrieved 2017-06-02.
- "Battles". The War of 1812 Website. The Discriminating General. Retrieved May 29, 2011.
- "Statistical Area Classification - Variant of SGC 2016 (Census metropolitan area and census agglomeration)". Statistics Canada. November 16, 2016. Archived from the original on November 16, 2016. Retrieved November 16, 2016.
There are 35 CMAs and 117 CAs in 2016. Two new CMAs were created: Belleville (Ont.) and Lethbridge (Alta.). Eight new CAs were created: Gander (N.L.), Sainte-Marie (Que.), Arnprior (Ont.), Carleton Place (Ont.), Wasaga Beach (Ont.), Winkler (Man.), Weyburn (Sask.) and Nelson (Alta.). The CAs of Amos (Que.) and Temiskaming Shores (Ont.) were retired because the population of their cores dropped below 10,000 in 2011.
| Regions | |
|---|---|
| Counties | |
| Districts | |
| Regional municipalities | |
| Single-tier municipalities | |
| Separated municipalities | |
| |